. 2024 Oct 5;7(1):1272.
doi: 10.1038/s42003-024-06949-1.

Spatial multi-omics in whole skeletal muscle reveals complex tissue architecture

Affiliations

Spatial multi-omics in whole skeletal muscle reveals complex tissue architecture

Clara Martínez Mir et al. Commun Biol. .

Abstract

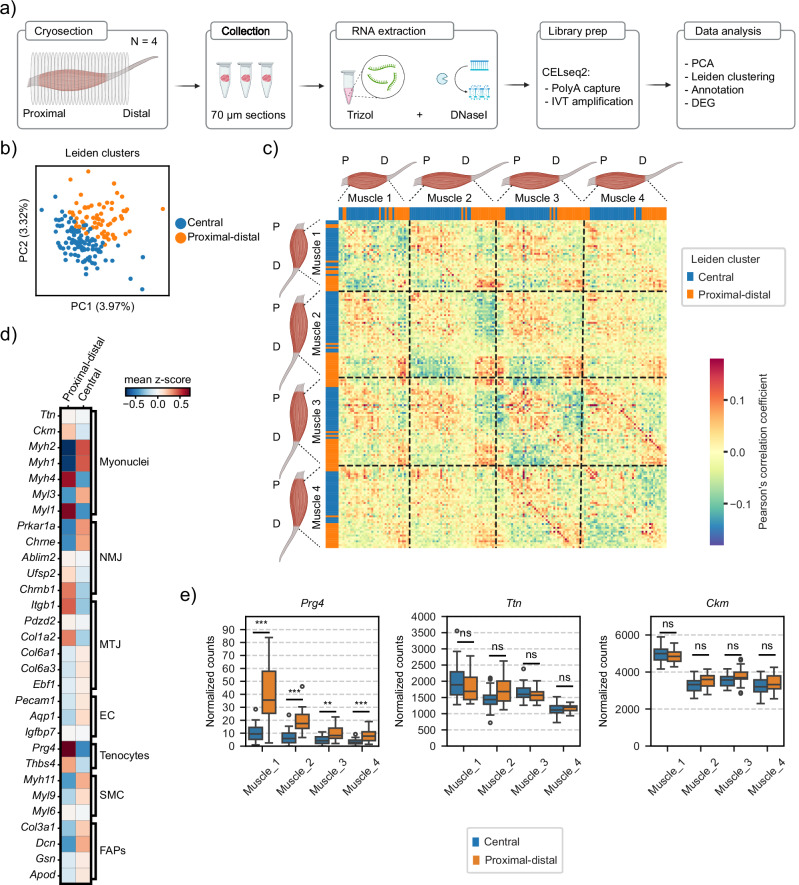
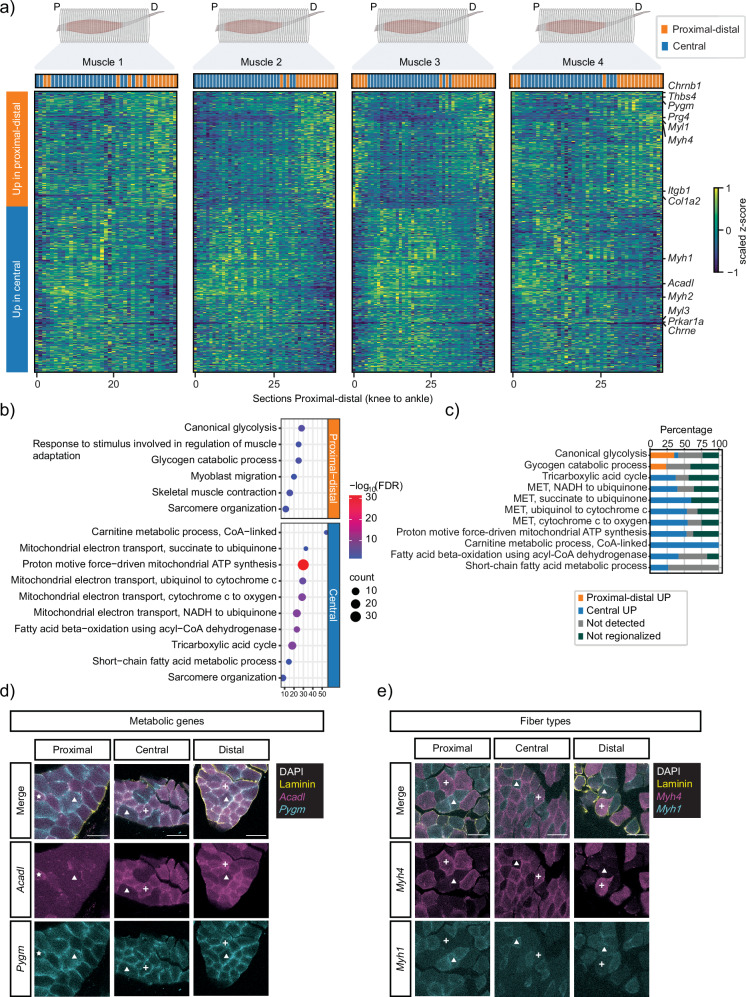
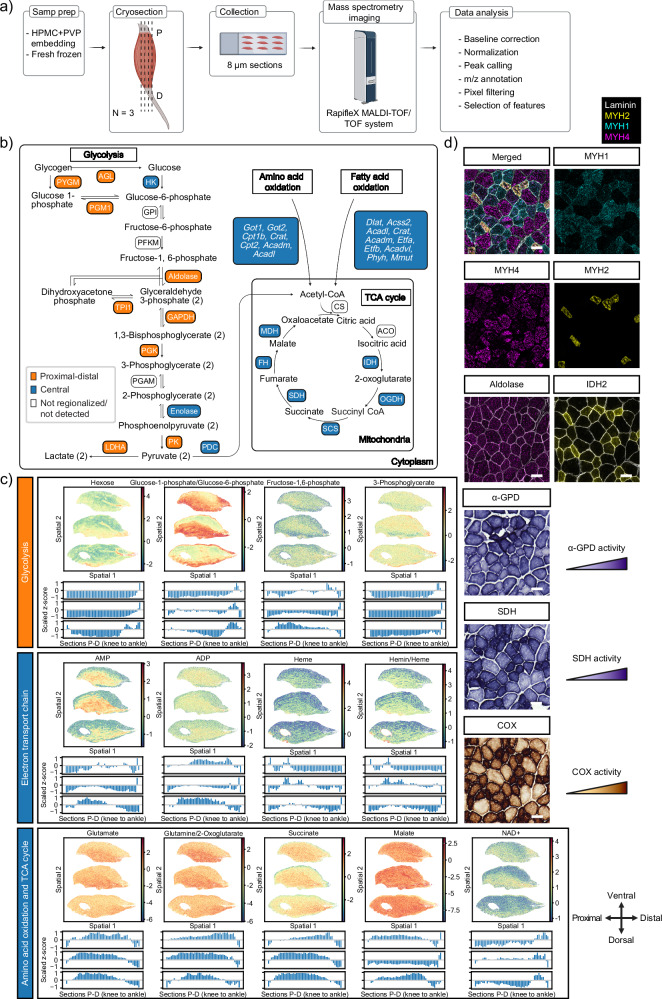
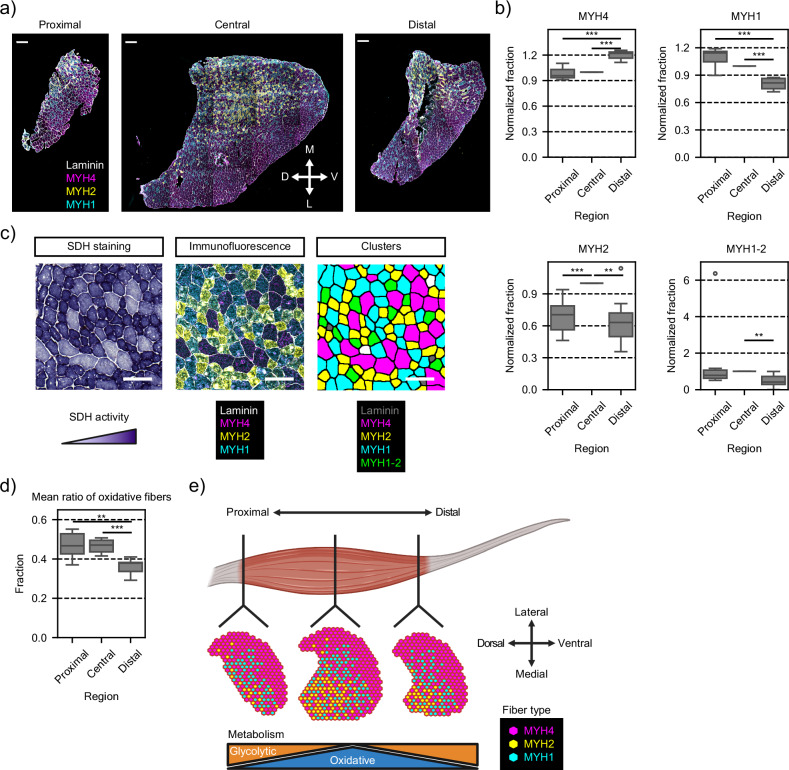
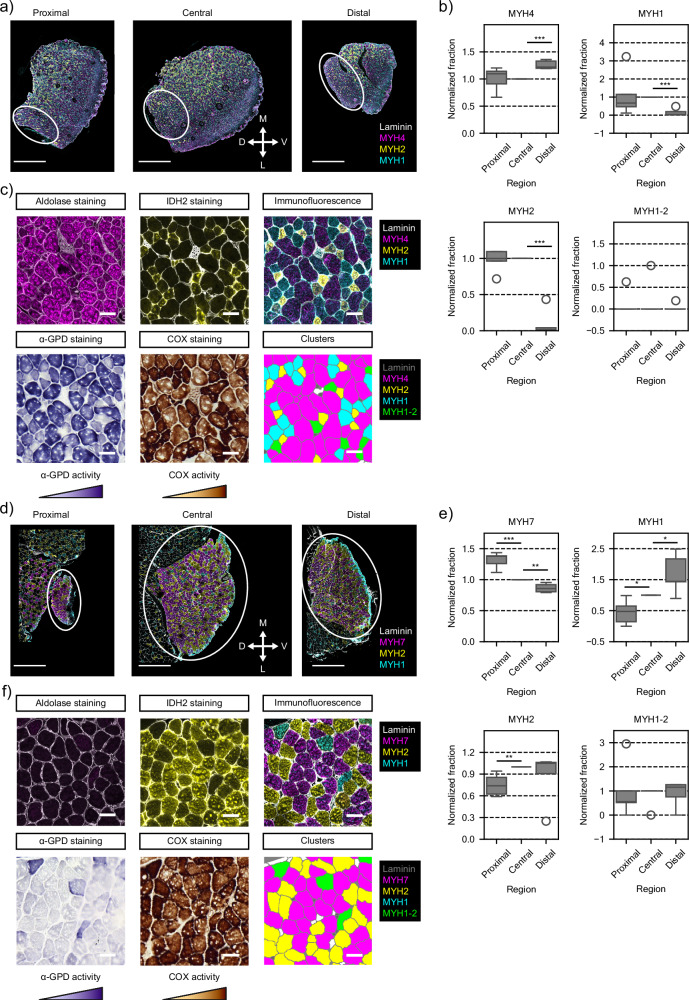
Myofibers are large multinucleated cells that have long thought to have a rather simple organization. Single-nucleus transcriptomics, spatial transcriptomics and spatial metabolomics analysis have revealed distinct transcription profiles in myonuclei related to myofiber type. However, the use of local tissue collection or dissociation methods have obscured the spatial organization. To elucidate the full tissue architecture, we combine two spatial omics, RNA tomography and mass spectrometry imaging. This enables us to map the spatial transcriptomic, metabolomic and lipidomic organization of the whole murine tibialis anterior muscle. Our findings on heterogeneity in fiber type proportions are validated with multiplexed immunofluorescence staining in tibialis anterior, extensor digitorum longus and soleus. Our results demonstrate unexpectedly strong regionalization of gene expression, metabolic differences and variable myofiber type proportion along the proximal-distal axis. These new insights in whole-tissue level organization reconcile sometimes conflicting results coming from previous studies relying on local sampling methods.


Conflict of interest statement

The authors declare the following competing interests: during the writing of the manuscript, B.H. was employed by Bruker Daltonics GmbH.

Figures

Fig. 1
Fig. 1. Spatial organization of transcripts in homeostatic TA muscles.
a Summary of TOMOseq experimental procedure: muscles were cryosectioned perpendicularly along the proximal-distal axis into 70 μm slices, and each slice was collected in a different tube. RNA extraction was performed for each tube, followed by library preparation, sequencing and data analysis. b Scatterplots after PCA displaying n = 171 sections. Sections are colored by Leiden cluster annotation (Supplementary Data 1). c Pairwise correlation heatmap of individual sections among all genes detected at more than four transcripts in at least three consecutive sections (Supplementary Data 1). Sections are colored by Leiden cluster annotation. d Mean z-score of unique transcript counts of marker genes for specialized myogenic nuclei (body myonuclei, NMJ and MTJ) and non-myogenic cells (ECs, tenocytes, SMCs and FAPs) in the two groups of sections. e Distribution of normalized transcript counts of one tenocyte marker (Prg4) and two muscle markers (Ttn and Ckm) in the two clusters of sections for each muscle. Sections are grouped and colored by Leiden cluster annotation. Box plot characteristics: center line, median; box limits, upper and lower quartiles; whiskers, 1.5x interquartile range; points, outliers. Two-side t-test and adjusted for multiple testing with Benjamini–Hochberg correction, ***p = 1.23e−05 (Muscle 1), ***p = 1.19e−06 (Muscle 2), **p = 6.70e−04 (Muscle 3), ***p = 2.87e−04 (Muscle 4). Diagrams in (a) and muscle diagrams in (c) were created with BioRender.com. P proximal, D distal, IVT in vitro transcription, PCA principal component analysis, DEG differential gene expression, MTJ myotendinous junction, NMJ neuromuscular junction.
Fig. 2
Fig. 2. Differential gene expression analysis between proximal-distal and central areas of TA muscles.
a Heat maps display the average proximal–distal expression patterns of the 686 DEG between proximal/distal and central sections detected by TOMOseq in each muscle. Genes were clustered based on the proximal-distal expression pattern. b GO-term analysis for the DEGs shown in (a). c Bar chart displays the percentage of genes that are differentially expressed between the clusters of sections, not regionalized, or not detected from selected GO categories in (b). HCR RNA-FISH for metabolic (d) and fiber type (e) genes identified by TOMOseq on proximal, central, and distal sections. Gray, DAPI; yellow, laminin subunit α-1. Scale bar, 50 μm. d White triangles indicate expression of Pygm; white crosses indicate expression of Acadl and Pygm; white stars indicate expression of Acadl. e White triangles and crosses indicate expression of Myh1 and Myh4, respectively. Muscle diagrams in (c) were created with BioRender.com. P proximal, D distal, MET mitochondrial electron transport, FDR false discovery rate.
Fig. 3
Fig. 3. Mass spectrometry imaging on longitudinal sections of TA muscles.
a Summary of MALDI-MSI experimental procedure: muscles were cryosectioned longitudinally along the proximal-distal axis into 8 μm slices. Sections were processed with a rapifleX MALDI-TOF/TOF system (Bruker Daltonics) and solariX 15 T MALDI-2xR-FTICR and spatial distribution maps of metabolites and lipids were reconstructed. b Scheme of different metabolic pathways identified by TOMOseq. Colors indicate in what cluster the enzyme (capitals), or gene (italics) is enriched based on the DEG analysis of TOMOseq data. c Heatmaps and in silico TOMOseq from MALDI-MSI display spatial distribution of identified metabolites from glycolysis, tricarboxylic acid (TCA) cycle, electron transport chain and amino acid oxidation in three different muscles (top to bottom: Muscle 1, Muscle 2, and Muscle 3). Color bar indicates the z-score of the log10 transformed normalized intensity values. Black arrows display proximal-distal (spatial 1) and dorsal-ventral (spatial 2) orientation of the tissue sections. d Immunofluorescence and histochemistry stainings to characterize the glycolytic and oxidative capacity of different fiber types on consecutive TA cryosections. Scale bar, 50 μm. Images in (a) and (b) were created with BioRender.com. P proximal, D distal, ACADL, ACADM, ACADVL acyl-Coenzyme A dehydrogenase, ACO aconitase, ACSS2 acyl-Coenzyme A synthetase, AGL glycogen debranching enzyme, CPT1B CPT2, carnitine palmitoyltransferase, CRAT carnitine o-acetyltransferase, CS citrate synthase, DLAT dihydrolipoamide s-acetyltransferase, ETFA, ETFB electron transfer flavoprotein, FH fumarate hydratase, GAPDH glyceraldehyde-3-phosphate dehydrogenase, GOT1, GOT2 aspartate aminotransferase, GPI glucose-6-phosphate isomerase, HK hexokinase, IDH isocitrate dehydrogenase, LDHA lactate dehydrogenase-A, MDH malate dehydrogenase, MMUT methylmalonyl Coenzyme A mutase, OGDH oxoglutarate dehydrogenase, PDC pyruvate dehydrogenase complex, PFKM phosphofructokinase, PGAM phosphoglycerate mutase, PGK phosphoglycerate kinase, PGM1 phosphoglucomutase, PHYH phytanoyl-Coenzyme A hydroxylase, PK pyruvate kinase, PYGM glycogen phosphorylase, SDH succinate dehydrogenase, SCS succinyl Coenzyme A synthetase, TPI1 Triosephosphate Isomerase, α-GPD α-glycerophosphate dehydrogenase, COX cytochrome c oxidase.
Fig. 4
Fig. 4. Fiber type characterization along the proximal-distal axis of TAs.
a Immunofluorescence staining of representative cryosections from proximal, central, and distal regions of TA muscles used for quantification of fiber types. White arrows display medial-lateral and dorsal-ventral orientation of the tissue sections. Yellow, type 2a myofiber (MYH2); cyan, type 2x myofiber (MYH1); magenta, type 2b myofiber (MYH4); gray, laminin subunit α-1. Scale bar, 300 μm. D dorsal, V ventral, M medial, L lateral. b Distribution of normalized fractions of the four different fiber types (MYH4, MYH1, MYH2 and MYH1-2) across seven replicates (Muscle 1, n = 3; Muscle 2, n = 2; Muscle 3, n = 2). For each replicate, central sections were used as reference for normalization. Box plot characteristics: center line, median; box limits, upper and lower quartiles; whiskers, 1.5x interquartile range; points, outliers. Two-side t-test, ***p = 5.00e−05 (MYH4 proximal vs. distal), ***p = 1.14e−06 (MYH4 central vs. distal), ***p = 8.17e−05 (MYH1 proximal vs. distal), ***p = 4.57e−06 (MYH1 central vs. distal), ***p = 6.05e−04 (MYH2 proximal vs. central), **p = 4.68e−03 (MYH2 central vs. distal), **p = 2.16e−03 (MYH1-2 central vs. distal). c Succinate dehydrogenase (SDH) staining analysis for oxidative capacity on TA muscle (left panel); immunofluorescence staining for fiber types of consecutive cryosections (middle panel); and, assigned fiber type based on clustering analysis of the immunofluorescence staining (right panel). Scale bar, 100 μm. d Distribution of oxidative fibers ratios (MYH2, MYH1 and MYH1-2) across seven replicates (Muscle 1, n = 3; Muscle 2, n = 2; Muscle 3, n = 2). Box plot characteristics: center line, median; box limits, upper and lower quartiles; whiskers, 1.5x interquartile range; points, outliers. Two-side t-test, **p = 4.58e−03 (proximal vs. distal), ***p = 5.22e−04 (central vs. distal). e Schematic representation of the heterogeneous distribution of fiber types and metabolism along the three body axes of TA muscles. Images in (e) were created with BioRender.com.
Fig. 5
Fig. 5. Fiber type characterization along the proximal-distal axis of EDLs and SOLs.
Immunofluorescence staining of representative cryosections from proximal, central, and distal regions of EDL (a) and SOL (d) muscles used for quantification of fiber types. White arrows display medial-lateral and dorsal-central orientation of the tissue sections. Circles surround the muscle of interest. Yellow, type 2a myofiber (MYH2); cyan, type 2x myofiber (MYH1); magenta, type 2b (MYH4) or type 1 myofiber (MYH7); gray, laminin subunit α-1. Scale bar, 1000 μm. D dorsal, V ventral, M medial, L lateral. b Distribution of normalized fraction of the four different fiber types (MYH4, MYH1, MYH2 and MYH1-2) across 5 EDL replicates (Muscle 1, n = 1; Muscle 2, n = 2; Muscle 3, n = 2). For each replicate, central sections were used as reference for normalization. Box plot characteristics: center line, median; box limits, upper and lower quartiles; whiskers, 1.5x interquartile range; points, outliers. Two-side t-test, ***p = 8.06e−05 (MYH4 central vs. distal), ***p = 1.21e−05 (MYH1 central vs. distal), ***p = 5.09e−06 (MYH2 central vs. distal). e Distribution of normalized fraction of the four different fiber types (MYH7, MYH1, MYH2 and MYH1-2) across 5 SOL replicates (Muscle 1, n = 2; Muscle 2, n = 1; Muscle 3, n = 2). For each replicate, central sections were used as reference for normalization. Box plot characteristics: center line, median; box limits, upper and lower quartiles; whiskers, 1.5x interquartile range; points, outliers. Two-side t-test, ***p = 5.80e−04 (MYH7 proximal vs. central), **p = 2.87e−03 (MYH7 central vs. distal), **p = 5.72e−03 (MYH2 proximal vs. central), *p = 1.47e−02 (MYH1 proximal vs. central), *p = 4.26e−02 (MYH1 central vs. distal). Histochemistry and immunofluorescence staining for oxidative and glycolytic potential of fibers on consecutive cryosections of EDL (c) and SOL (f), and assigned fiber type based on clustering analysis of the immunofluorescence staining. Scale bar, 50 μm.

References

    1. Cramer, A. A. W. et al. Nuclear numbers in syncytial muscle fibers promote size but limit the development of larger myonuclear domains. Nat. Commun.11, 6287 (2020). - PMC - PubMed
    1. Hansson, K.-A. et al. Myonuclear content regulates cell size with similar scaling properties in mice and humans. Nat. Commun.11, 6288 (2020). - PMC - PubMed
    1. Scime, A., Caron, A. Z. & Grenier, G. Advances in myogenic cell transplantation and skeletal muscle tissue engineering. Front. Biosci.14, 3012–3023 (2009). - PubMed
    1. Talbot, J. & Maves, L. Skeletal muscle fiber type: using insights from muscle developmental biology to dissect targets for susceptibility and resistance to muscle disease. WIREs Dev. Biol.5, 518–534 (2016). - PMC - PubMed
    1. Smith, J. A. B., Murach, K. A., Dyar, K. A. & Zierath, J. R. Exercise metabolism and adaptation in skeletal muscle. Nat. Rev. Mol. Cell Biol.24, 607–632 (2023). - PMC - PubMed