. 2024 Oct 5;81(1):425.
doi: 10.1007/s00018-024-05455-1.

AP-1B regulates interactions of epithelial cells and intraepithelial lymphocytes in the intestine

Affiliations

AP-1B regulates interactions of epithelial cells and intraepithelial lymphocytes in the intestine

Ryohtaroh Matsumoto et al. Cell Mol Life Sci. .

Abstract

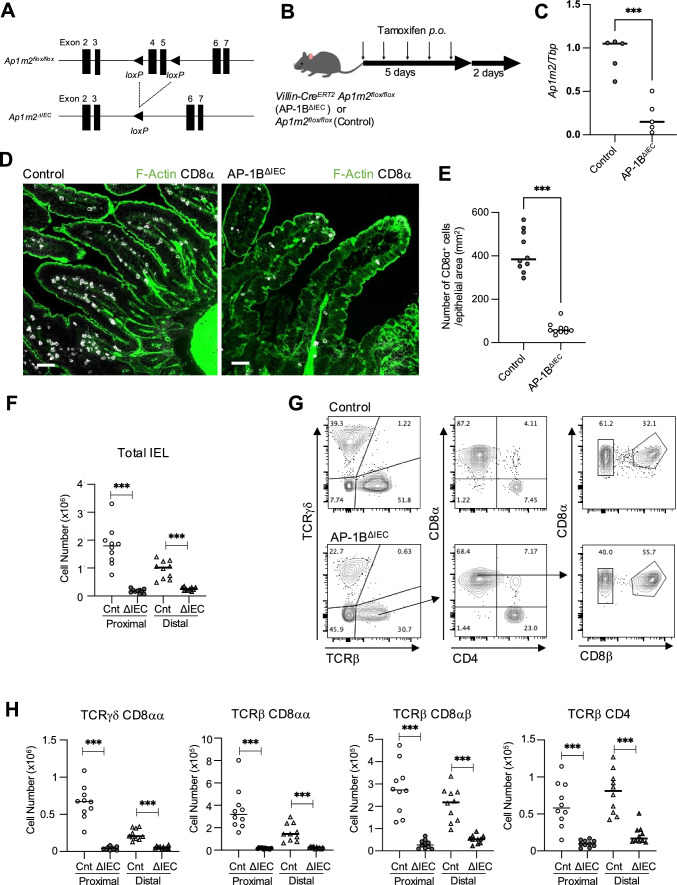
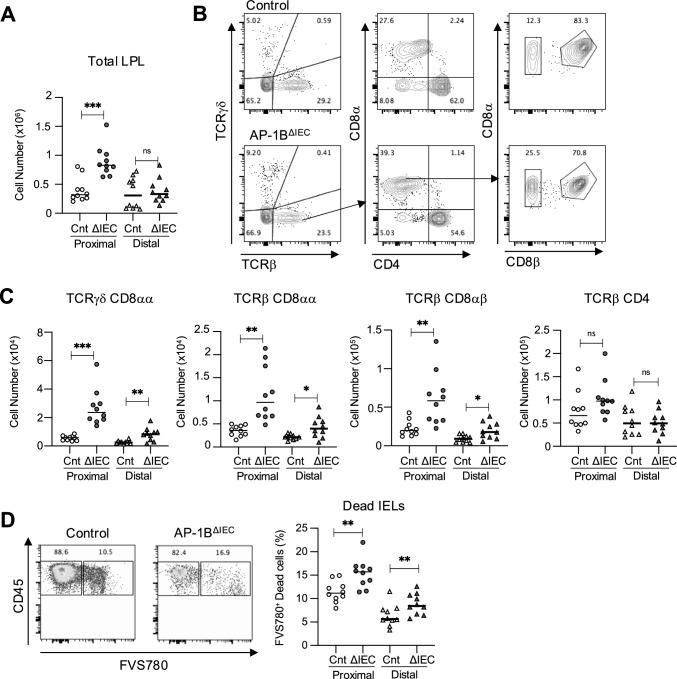
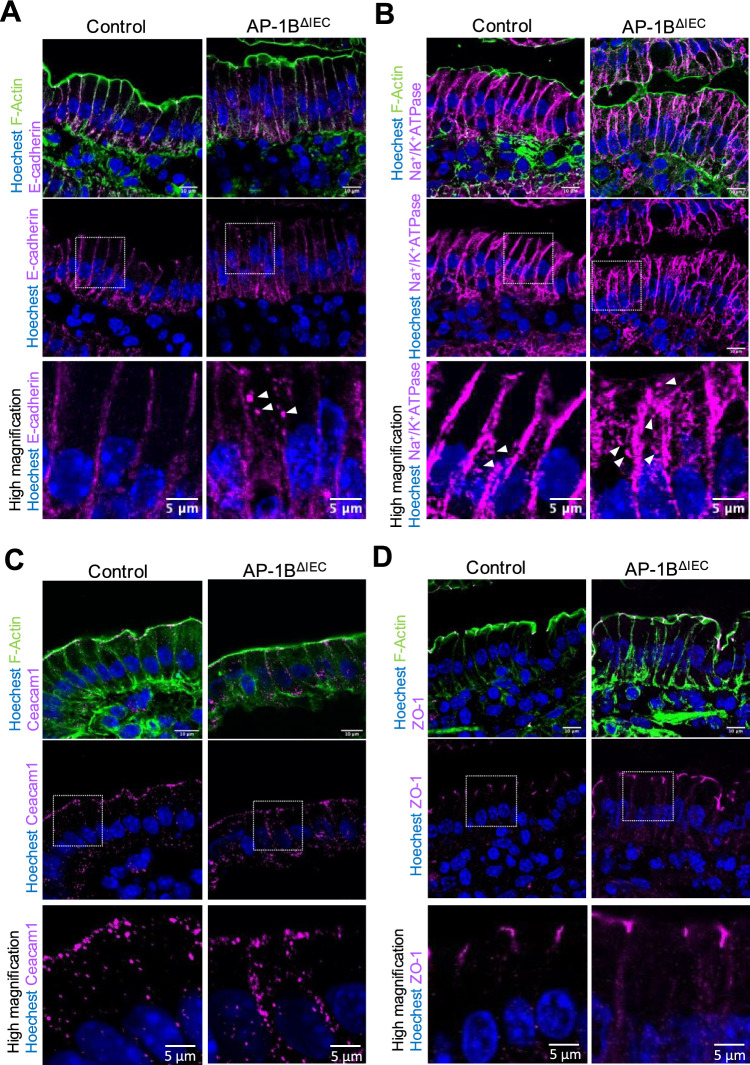
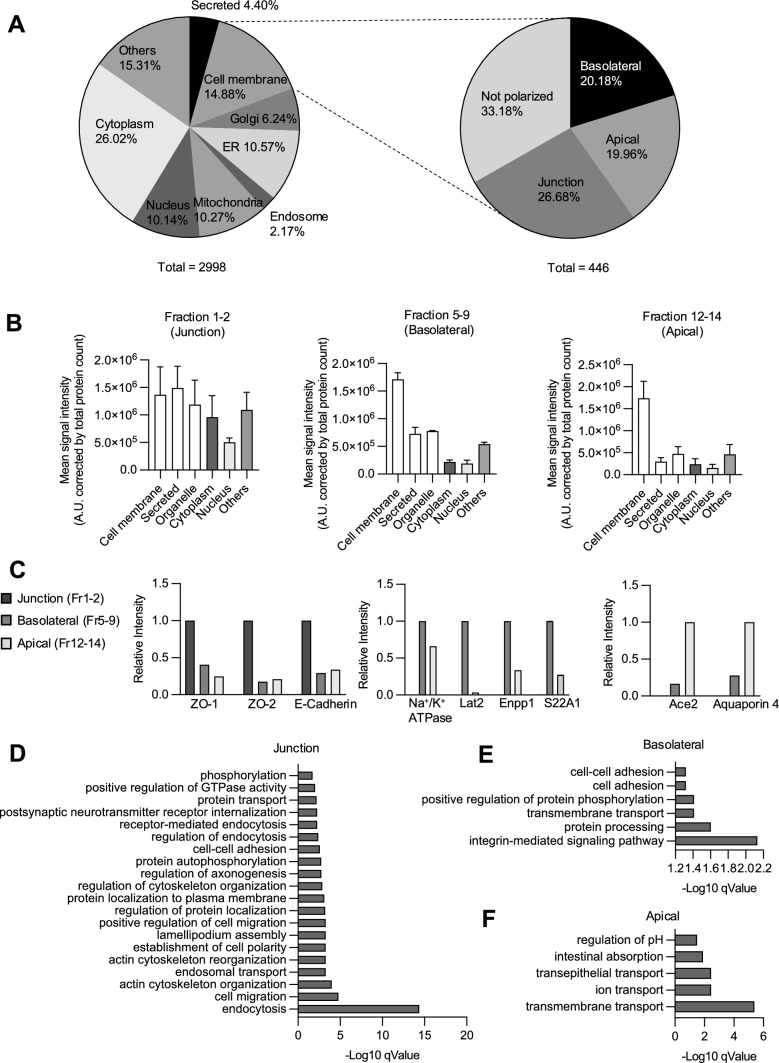
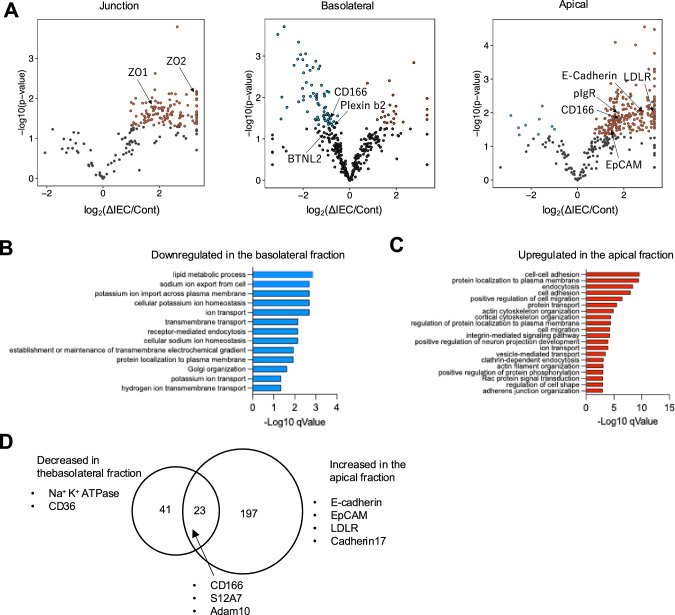
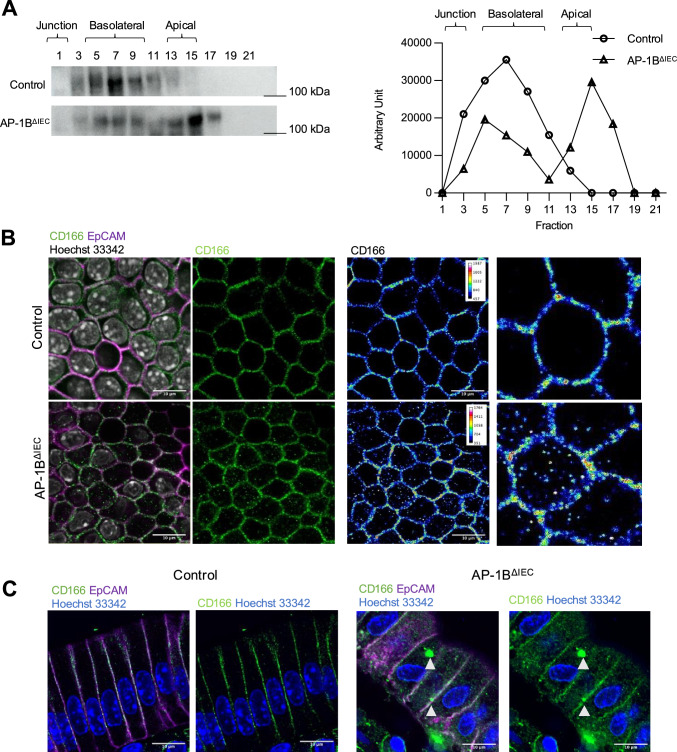
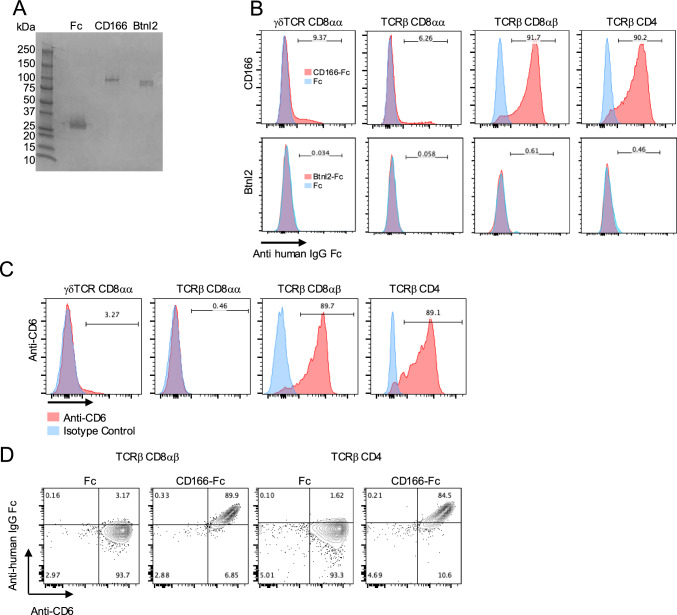
Intraepithelial lymphocytes (IELs) reside in the epithelial layer and protect against foreign pathogens, maintaining the epithelial barrier function in the intestine. Interactions between IEL and epithelial cells are required for IELs to function effectively; however, the underlying molecular machinery remains to be elucidated. In this study, we found that intestinal epithelium-specific deficiency of the clathrin adaptor protein (AP)-1B, which regulates basolateral protein sorting, led to a massive reduction in IELs. Quantitative proteomics demonstrated that dozens of proteins, including known IEL-interacting proteins (E-cadherin, butyrophilin-like 2, and plexin B2), were decreased in the basolateral membrane of AP-1B-deficient epithelial cells. Among these proteins, CD166 interacted with CD6 on the surface of induced IEL. CD166 knockdown, using shRNA in intestinal organoid cultures, significantly inhibited IEL recruitment to the epithelial layer. These findings highlight the essential role of AP-1B-mediated basolateral sorting in IEL maintenance and survival within the epithelial layer. This study reveals a novel function of AP-1B in the intestinal immune system.

Keywords: Alcam; Induced IEL; Iodixanol density gradient ultracentrifugation; Natural IEL; TMT-based quantitative proteome analysis.


Conflict of interest statement

The authors have no relevant financial or non-financial interests to disclose.

Figures

Fig. 1
Fig. 1
The number of IELs is decreased in the intestine of AP-1B germ line knockout mice. A Immunofluorescence images of CD8α (green) and EpCAM (magenta) in the small intestine of AP-1B germline knockout mice (AP-1B KO) and control littermates (WT). Scale bars are 100 µm. B The gating strategy for identifying IEL subsets using flow cytometry
Fig. 2
Fig. 2
AP-1B deficiency in intestinal epithelial cells results in decreased IEL numbers. A The scheme for generating Villin-CreERT2 Ap1m2flox/flox mice (AP-1BΔIEC mice). B Schedule of tamoxifen administration to AP-1BΔIEC and Ap1m2flox/flox mice (control). Mice were orally administrated 10 mg/ml tamoxifen at 100 µL for 5 consecutive days. Two days after the final administration, mice were used for the subsequent experiments. C Ap1m2 gene expression in the intestine of AP-1BΔIEC after tamoxifen was administered. D Immunofluorescence images of CD8α (gray), and F-actin (green) in the small intestine of AP-1BΔIEC and control mice. Scale bars: 50 µm. E The number of CD8α+ cells residing in the epithelium was counted across at least three sections from ten AP-1BΔIEC and control mice, and the data were normalized to the epithelial area using ImageJ. *** P < 0.001 calculated using the t test with Weltch’s correction. F Flow cytometry data of the number of live IEL (CD45+ FVS780) in AP-1BΔIEC and control mice. IELs were isolated from the small intestine, 10 cm below the stomach (proximal) and 10 cm from the cecum (distal). The total cell number was counted by using cell counting beads. * P < 0.05, ** P < 0.01, *** P < 0.001 calculated using Dunnett’s T3 multiple comparison test (n = 10). The representative data from three independent experiments are shown. G Gating strategy of CD45+ FVS780 IELs. H Flow cytometry data of the IEL number in AP-1BΔIEC and control mice. * P < 0.05, ** P < 0.01, *** P < 0.001 calculated by Dunnett’s T3 multiple comparison test (n = 10). The representative data from three independent experiments are shown. In each graph, dots represent values obtained from individual mice, and horizontal bars represent the average values
Fig. 3
Fig. 3
The proportion of T cells in the lamina propria is increased in AP-1BΔIEC mice. A The number of lamina propria lymphocytes (LPLs) in AP-1BΔIEC and control mice. The total cell number was counted by using cell counting beads. These experiments were performed three times independently. * P < 0.05, ** P < 0.01, *** P < 0.001 calculated using Dunnett’s T3 multiple comparison test (n = 10). B Gating strategy for isolation of the LPLs from the AP-1BΔIEC and control mice. The parent gate is CD45+ live singlet cells. C The cell number of each LPL subsets in AP-1BΔIEC and control mice were measured by flow cytometry analysis and calculated by multiplying the total cell number by frequency. D IELs were separated as described in the “Materials and methods” section. The frequency of FVS780+ dead cells in CD45+ cells is shown. These experiments were performed three times independently. * P < 0.05, ** P < 0.01, *** P < 0.001 calculated using Dunnett’s T3 multiple comparison test (n = 10). In each graph, dots represent values obtained from individual mice, and horizontal bars represent the average values
Fig. 4
Fig. 4
Fractionation of the plasma membrane of intestinal epithelial cells by iodixanol density gradient ultracentrifugation. A An experimental scheme of plasma membrane fractionation from isolated intestinal epithelia. A 10 cm duodenum was removed from each mouse below the stomach. Intestinal epithelium was stripped off from the mucus layer and homogenized by nitrogen cavitation. After discarding the nucleus by low-speed centrifugation, the cell membrane was enriched using ultracentrifugation. The enriched cell membrane was added to the top of a 10–30% iodixanol gradient and was fractionated by ultracentrifugation. Fractionation of the plasma membranes of the control (B) and AP-1BΔIEC (D) was confirmed by western blotting using specific membrane markers. C,E The line graphs show the intensities of each marker’s western blot signal, quantitated by densitometry and plotted against the fraction number. F The graph is a line graph showing the band intensities of E-cadherin that appeared at three molecular weights in AP-1BΔIEC mice
Fig. 5
Fig. 5
Immunofluorescence images for membrane proteins in intestinal epithelial cells. Immunofluorescence images of the small intestine for E-cadherin (A), Na+/K+-ATPase (B), Ceacam 1 (C), and ZO-1 (D). Proteins are indicated in magenta in each panel. Nuclei were stained with Hoechst 33342 and shown in blue. F-actin was stained with phalloidin and shown in green. All images were taken with an FV3000 confocal microscope using FV31S-SW software. Scale bars are 10 µm in upper two panels, and 5 µm in high magnified images. Representative images from at least three independent experiments are shown
Fig. 6
Fig. 6
Quantitative proteome analysis of membrane fractions of intestinal epithelial cells. A Pie charts showing the subcellular localization of all 2998 proteins identified by mass spectrometry (left), of which 446 were plasma membrane proteins and were classified as apical, basolateral, junction, or not polarized (right). Subcellular localizations were referenced from the UniProt release on 7/23/2022. B Quantification of the signal intensity obtained from proteins that are annotated as cellular components indicated in the x-axis normalized by the total number of proteins in each fraction. C Relative signal intensities of marker proteins of each fraction. ZO-1, ZO-2, and E-cadherin were used for junction area markers. Na+/K+ ATPase, large neutral amino acids transporter small subunit 2 (Lat2), ectonucleotide pyrophosphatase/phosphodiesterase family member 1 (Enpp1) and solute carrier family 22 member 1 (S22A1) were used as the basolateral membrane markers. Ace2 and Aquaporin 4 were used as the apical membrane markers. Gene ontology (GO) analysis (biological process) by DAVID database were performed on the membrane proteins detected in the junction region (D), the basolateral region (E), and the apical region (F) of the control mice
Fig. 7
Fig. 7
Protein sorting in the intestinal epithelial cells is disturbed by AP-1B deficiency. A Volcano plots based on proteomic analysis show differences in membrane protein expression levels for each membrane fraction of AP-1B-deficient epithelial cells and controls. Each dot represents a protein. Proteins with log2(AP-1BΔIEC/Control) > 1.3 and P < 0.05 are indicated by red dots, and proteins with log2(AP-1BΔIEC/Control) < −1.3 and P < 0.05 are shown by blue dots. Plasma membrane protein was filtered by subcellular location information from UniProt. Gene Ontology analysis (biological process) was performed on the basolateral (B) or apical (C) membrane proteins that were altered between AP-1BΔIEC and control mice. Proteins that decreased or increased in AP-1BΔIEC mice (P < 0.05) were listed and subjected to analysis using the DAVID database. Biological processes that were significantly decreased in the basolateral fraction or increased in the apical fractions were represented by blue and red bars, respectively. D The Venn diagram illustrates proteins that decreased in the basolateral fraction and increased in the apical fraction of AP-1BΔIEC mice compared to that of control mice
Fig. 8
Fig. 8
AP-1B deficiency causes mislocalization of CD166 in the small intestine. A Western blot analysis of the expression of membrane fractions from AP-1B deficient epithelial cells and control epithelial cells. The representative data from three independent experiments are shown. B Whole-mount immunofluorescence staining of the small intestinal epithelium from AP-1BΔIEC and control mice. The right panels show pseudo-color images depicting signal intensities of CD166 immunostaining. The representative data from two independent experiments is shown. Gray indicates Hoechst 33342, green is CD166, and magenta is EpCAM. C Immunofluorescence images of the small intestine cryosections from control and AP-1BΔIEC mice. Blue indicates Hoechst 33342, green is CD166, and magenta is EpCAM. All pictures were taken with the FV3000 confocal microscope and FV31S-SW application with a 60× objective lens. Obtained pictures were analyzed by using ImageJ software with the OlympusViewer plugin. Scale bars are 10 µm
Fig. 9
Fig. 9
CD166 attaches to CD6+ IELs. A Coomassie brilliant blue staining after SDS-PAGE of Fc recombinant proteins. From the right, human IgG1 Fc fragment protein (Fc) was used as a control, and CD166-Fc and Btnl2-Fc were applied. B Binding assay of CD166-Fc and Btnl-Fc recombinant protein to IELs. IELs were incubated with CD166-Fc and Btnl-Fc (red) or Fc fragment protein (control, blue) for 30 min at 4 °C. Fc proteins were detected by fluorescence-activated cell sorting (FACS) using anti-human IgG Fc antibody. The numbers represent the frequency of cells attached to Fc-fusion proteins. C FACS analysis of CD6 expression on IELs. Anti-mouse CD6 (red) or isotype control (blue) were used. The number represents the frequency of CD6+ IELs in each IEL subset. D Co-staining experiment of anti-CD6 antibody and CD166-Fc proteins for induced IELs
Fig. 10
Fig. 10
CD166 gene knockdown decreases the interactions between IELs and small intestinal organoids. A Intestinal organoids were stained with EpCAM (magenta) and CD166 (green). Scale bars are 50 µm or 20 µm. B IELs were co-cultured with intestinal organoids. IELs (green) attached to organoids (EpCAM, magenta) were counted in panels C and E. Scale bars represent 50 µm. C IELs were pretreated with CD166-Fc or control Fc and subsequently co-cultured with small intestinal organoids. Organoids were co-cultured for 7 days. IELs (green) attached to the organoid epithelium (magenta) were counted as described in the “Materials and methods” section. The images presented in the figure are two-dimensional projections of three-dimensional stacked images acquired using a confocal microscope. Student’s t test, * P < 0.05. Scale bars are 50 µm. This experiment was repeated three times. D Quantitative PCR of the relative expression level of Alcam, encoding CD166. *** P < 0.001, Dunnet’s T3 multiple comparison test used, E IELs were co-cultured with CD166-knockdown organoids for 7 days. After fixation, IEL (green) attached to the organoid epithelium (magenta) were counted. Dunnet’s T3 multiple comparison test: ** P < 0.01, *** P < 0.001. Scale bars are 50 µm. This experiment was repeated twice. All pictures were taken with the FV3000 confocal microscope and FV31S-SW application with a 20× lens or 60× lens. Obtained pictures were analyzed by using ImageJ software with the OlympusViewer plugin. In each graph, the dots represent the values obtained from each culture well and the bars represent the average

References

    1. Nakatsu F, Hase K, Ohno H (2014) The role of the clathrin adaptor AP-1: polarized sorting and beyond. Membranes 4:747–763. 10.3390/membranes4040747 - PMC - PubMed
    1. Bonifacino JS (2014) Adaptor proteins involved in polarized sorting. J Cell Biol 204(1):7–17. 10.1083/jcb.201310021 - PMC - PubMed
    1. Ohno H, Stewart J, Fournier MC, Bosshart H, Rhee I, Miyatake S, Saito T, Gallusser A, Kirchhausen T, Bonifacino JS (1995) Interaction of tyrosine-based sorting signals with clathrin-associated proteins. Science 269:1872–1875. 10.1126/science.7569928 - PubMed
    1. Ohno H, Tomemori T, Nakatsu F, Okazaki Y, Aguilar RC, Foelsch H, Mellman I, Saito T, Shirasawa T, Bonifacino JS (1999) μ1B, a novel adaptor medium chain expressed in polarized epithelial cells. FEBS Lett 449(2–3):215–220. 10.1016/s0014-5793(99)00432-9 - PubMed
    1. Fölsch H, Ohno H, Bonifacino JS, Mellman I (1999) A novel clathrin adaptor complex mediates basolateral targeting in polarized epithelial cells. Cell 99:189–198. 10.1016/s0092-8674(00)81650-5 - PubMed

MeSH terms