. 2024 Jan-Dec;16(1):2409924.
doi: 10.1080/19490976.2024.2409924. Epub 2024 Oct 6.

Helicobacter pylori PldA modulates TNFR1-mediated p38 signaling pathways to regulate macrophage responses for its survival

Affiliations

Helicobacter pylori PldA modulates TNFR1-mediated p38 signaling pathways to regulate macrophage responses for its survival

Wei Yang Sit et al. Gut Microbes. 2024 Jan-Dec.

Abstract

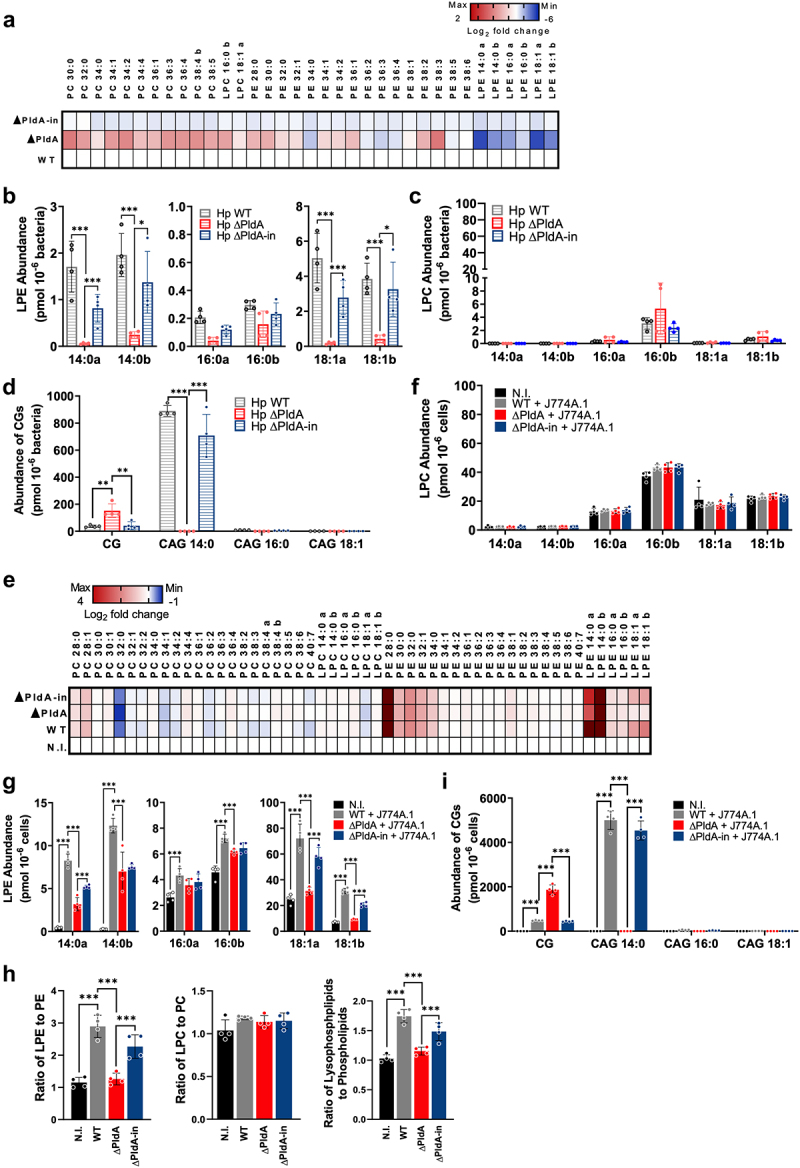
Helicobacter pylori, a dominant member of the gastric microbiota was associated with various gastrointestinal diseases and presents a significant challenge due to increasing antibiotic resistance. This study identifies H. pylori's phospholipase A (PldA) as a critical factor in modulating host macrophage responses, facilitating H. pylori 's evasion of the immune system and persistence. PldA alters membrane lipids through reversible acylation and deacylation, affecting their structure and function. We found that PldA incorporates lysophosphatidylethanolamine into macrophage membranes, disrupting their bilayer structure and impairing TNFR1-mediated p38-MK2 signaling. This disruption results in reduced macrophage autophagy and elevated RIP1-dependent apoptosis, thereby enhancing H. pylori survival, a mechanism also observed in multidrug-resistant strains. Pharmacological inhibition of PldA significantly decreases H. pylori viability and increases macrophage survival. In vivo studies corroborate PldA's essential role in H. pylori persistence and immune cell recruitment. Our findings position PldA as a pivotal element in H. pylori pathogenesis through TNFR1-mediated membrane modulation, offering a promising therapeutic target to counteract bacterial resistance.

Keywords: H. pylori phospholipase A; Host-pathogen interaction; TNFR1 signaling; innate immunity; membrane fluidity.


Conflict of interest statement

No potential conflict of interest was reported by the author(s).

Figures

None
Graphical abstract
Figure 1.
Figure 1.
Effect of H. pylori virulence factors on macrophage recruitment and autophagy modulation. (a) C57BL/6 mice received orogastric inoculations every 2 days with WT H. pylori (1 × 109 CFU), resulting in 4 total inoculations. Infiltration levels of F4/80+/CD11b+ macrophages (b) in gastric tissues following the regimen described in (a). (c) J744A.1 cells were uninfected (N.I.) or infected with WT, isogenic mutant ΔPldA, capJ-knockout (ΔCapJ), vacA-knockout (ΔVacA), or cagA-knockout (ΔCagA) at a MOI of 100 at 37°C and under 5% CO2 for 3 hr. Chloroquine (CQ) was added to the cells at a concentration of 10 μM before infection with different strains of H. pylori. the expression levels of LC3-II were detected by Western blotting analysis. Actin was used as an internal control. (d) quantification of the ratio of LC3-II to actin in (c). (e) J744A.1 cells were infected with WT, Δ PldA, or ΔPldA-in at a MOI of 100 for 1, 3, and 6 hr, respectively. LC3-II expression was determined by Western blot analysis. Actin was used as an internal control. (f) quantification of the ratio of LC3-II to actin in (e). Each value represents the mean ± SD from 3 independent experiments in (d) and (f). (g to h) J744A.1 cells were infected with WT, ΔPldA, or ΔPldA-in at a MOI of 100 for 3 hr. Gentamicin CFU assays were used to determine the viability of internalized H. pylori (g). J744A.1 viability (uninfected or infected with WT, ΔPldA, or ΔPldA-in) was assessed using trypan blue exclusion assays. Results are presented relative to the viability of uninfected macrophage (h). Each value represents the mean ± SD from 3 (g) or 5 (h) independent experiments. (b) data points represent individual mice, with bars indicating mean ± SEM collated from 3 separate experiments. Statistical analysis involved the Mann-Whitney test and subsequent Dunn’s post hoc test. (d, f to h) statistical significance (α = 0.05) was calculated using a two-tailed unpaired Student’s t-test. *p < .05, **p < .01, **p < .001.
Figure 2.
Figure 2.
H. pylori PldA affects lipid composition. (a) heatmap of lipid changes in H. pylori (WT, ∆PldA, and ∆PldA-in). Color scale represents the log2 fold change of lipid abundance relative to WT. 4 replicates for each group were performed. (b to d) the abundance of LPEs (b), and LPCs (c), and cholesteryl derivatives (d) (pmol/million bacteria) in H. pylori. The data presented are means ± standard deviations from 4 independent experiments. A two-tailed unpaired Student’s t-test was used to determine statistical significance (α = 0.05). (e) heatmap of lipid changes in uninfected (N.I.) and infected J774A.1 (WT, ∆PldA, and ∆PldA-in). Cells were infected with WT, ∆PldA, or ∆PldA-in at a MOI of 100 for 3 hr. 4 replicates for each group were performed. Color scale represents the log2 fold change of lipid abundance relative to WT. The abundance of LPCs (f), LPEs (g), and cholesteryl derivatives (i) (pmol/million cells). (h) ratio of LPE/PE (left panel), LPC/PC (middle panel) and lysophospholipids/phospholipids (right panel) changes in uninfected (N.I.) and infected J774A.1 (WT, ∆PldA, and ∆PldA-in). The data presented are means ± standard deviations from 4 independent experiments. A two-tailed unpaired Student’s t-test was used to determine statistical significance (α = 0.05). A phospholipid is labeled b when it is the (sn)-1 isomer and a when it is the (sn)-2 isomer. *p < .05, **p < .01, **p < .001.
Figure 3.
Figure 3.
H. pylori PldA reduces the activation of p38-MK2 signaling in macrophages. (a to d) the presence of PldA reduces the activation of p38-MK2 signaling in H. pylori-infected macrophages. The p38, p-p38, MK2, and p-MK2 levels in uninfected (N.I.) or H. pylori-infected J774A.1 (WT, ∆PldA, and ∆CGT) (a), or (WT, ∆PldA, ∆PldA-in) (b) at a MOI of 100 for 3 hr were detected by immunoblotting and the quantified ratio of p-p38 to p38 and pMK2 to MK2 were displayed as the middle and the right panel. The levels of p38 and p-p38 in uninfected (N.I.) or H. pylori-infected J774A.1 (WT or ∆PldA) without or with crude lysates from WT or ∆CGT were detected by immunoblotting (c). The p38, p-p38, MK2, and p-MK2 levels in uninfected (N.I.) or H. pylori-infected J774A.1 (WT, ∆PldA, ∆PldA-in) at a MOI of 10 or 100 for 3 hr were detected by immunoblotting (d). Actin was used as an internal control. This data is representative of 3 independent experiments and presented as mean ± standard deviations. A two-tailed unpaired Student’s t-test was used to determine statistical significance (α = 0.05). *p < .05, **p < .01, **p < .001.
Figure 4.
Figure 4.
PldA suppresses autophagosome formation in infected macrophages through p38-MK2 signaling. (a) the presence of PldA reduces the phosphorylation of beclin-S90 via the p38-MK2 signaling pathway in H. pylori-infected macrophages. LC3-II, p-BENC1 (S90), BECN-1, p-p38, p38, p-MK2, and MK2 levels in uninfected (N.I.) or H. pylori-infected J774A.1 (WT, ∆PldA, and ∆PldA-in) at a MOI of 100 for 3 hr were detected by immunoblotting and the quantification of p-BENC1 (S90) to BECN-1 were displayed as the lower panel. Actin was used as an internal control. This data is representative of 3 independent experiments. (b) immunofluorescence staining of LC3-II (green) in uninfected (N.I.) or H. pylori-infected J774A.1 (WT, ∆PldA, and ∆PldA-in) cells at a MOI of 100 for 3 hr. Nuclei were stained with DAPI (blue). (c) quantification of the LC3-II puncta formation in (b). (d) immunofluorescence staining of LC3-II (green) and H. pylori (red) in uninfected (N.I.) or H. pylori-infected J774A.1 (WT, ∆PldA, and ∆PldA-in) cells at a MOI of 100 for 3 hr. (e) colocalization analysis of LC3-II and H. pylori in (d). The data in (c) and (e) represent the mean ± SD. Statistical significance was calculated using a two-tailed unpaired Student’s t-test n = 30. The scale bar represents 5 μm. *p < .05, **p < .01, **p < .001.
Figure 5.
Figure 5.
Effect of TNFR1 inhibition or presence of PldA on membrane fluidity, TNFR1 clustering, and RIP1 ubiquitination. (a) J744A.1 was pretreated with DMSO, R7050 (10 μM) or TAK242 (10 μM) for 30 min, followed by non-infection or infection with various H. pylori strains (WT, ∆PldA, or ∆PldA-in) at a MOI of 100 for 3 hr. The p-p38, p38, p-MK2 and MK2 levels were detected by immunoblotting analysis. Actin was used as the internal control. (b) A Laurdan imaging analysis of the membrane lipid order in uninfected and infected J744A.1. The general polarisation (GP) value indicates the degree of fluidity in the plasma membrane. The GP images are presented as merged means of intensity and rainbow RGB pseudocolored images. Red indicates less membrane dynamic, while blue indicates high membrane dynamic. Scale bar, 5 μm. (c) GP value distribution in (b). The infection of macrophages with WT and ΔPldA strains resulted in a reduction in the order of the plasma membrane, as indicated by a lower GP relative to ΔPldA-infected J774A.1. (d) The statistical results for the GP values in individual cells are presented. n = 30. A two-sided, unpaired Student’s t-test was used for these analyses. (e) Immunofluorescence staining of TNFR1 (green) in uninfected (N.I.) or H. pylori-infected J774A.1 (WT, ΔPldA, and ΔPldA-in) at a MOI of 100 for 3 hr. Nuclei were stained with DAPI (blue). (f to h) quantification of TNFR1 cluster formation (f), cluster size (g), and intensity density (h) in (e). Statistical analysis was conducted on individual cells. n = 100. A two-sided unpaired Student’s t-test was used for analysis. Scale bar, 5 μm (I) Co-immunoprecipitation with anti-RIP1 from lysates was carried out to detect the presence of ubiquitinated forms of RIP1. This data is representative of 2 independent experiments. *p < .05, **p < .01, **p < .001.
Figure 6.
Figure 6.
The presence of PldA inhibits macrophage p38-MK2 activation and induces RIP1-dependent apoptosis. (a to c) J744A.1 cells were infected with WT, Δ PldA, or ΔPldA-in at a MOI of 100 for 3 hr. (a) the levels of p38, p-p38, p-RIP1 (S321), p-RIP1 (S166), and RIP1 were detected by immunoblotting. Actin was used as an internal control. Quantification of ratio of p-RIP1 (S321) to actin and ratio of p-RIP1 (S166) to actin was displayed as the middle and right panel respectively. (b) the levels of active caspase-8 (p18) and caspase-3 (p17) were also detected by immunoblotting. Actin was used as an internal control. Quantification of ratio of active caspase-8 (p18) to actin and ratio of active caspase-3 (p17) to actin was displayed as the middle and right panel respectively. (c) Co-immunoprecipitation with anti-RIP1 from lysates was carried out to detect caspase-8 (p43) and FADD levels in RIP1-associated complex II. (d) J744A.1 was treated with or without BIRB-796 (100 nM) for 30 min, followed by infection with different H. pylori strains (WT, ∆PldA, or ∆PldA-in) at a MOI of 100 for 3 hr. The levels of p-RIPK1 (S321) and RIPK were determined by immunoblotting. Actin was used as an internal control. (e) J744A.1 was treated with DMSO (CTL), BIRB-796 (100 nM), or nec-1 (50 μM) for 30 min, followed by infection with various H. pylori strains (WT, ∆PldA, or ∆PldA-in) at a MOI of 100 for 3 hr. Assays using trypan blue exclusion were used to determine the number of live cells. Data presented are means ± SD from 3 independent experiments. Statistical significance was calculated using a two-tailed unpaired Student’s t-test. *p < .05, **p < .01, **p < .001.
Figure 7.
Figure 7.
PldA inhibits p38-MK2 activation in primary macrophage. (a to e) BMDMs were either uninfected (N. I.) or infected with WT, Δ PldA, or ΔPldA-in at a MOI of 100 for 3 hr. The levels of LC3-II, p-BENC1 (S90), and BECN-1 were detected by immunoblotting (a, left panel). LC3-II to actin ratio is determined (a, right panel). A gentamycin bacterial 16s rRNA assay was used to determine the internalization activity of H. pylori in BMDMs (b). Immunoblotting was used to detect the levels of p38, p-p38, MK2, and p-MK2 (c), the levels of p-RIP1 (S321), p-RIP1 (S166), and RIP1 (d), and the levels of active caspase-8 (p18) (e). Actin was used as an internal control. 3 independent experiments were conducted to obtain the data presented here. (f) trypan blue exclusion assays were used to determine the number of live cells in uninfected (N.I.) or infected with various H. pylori strains (WT, Δ PldA, or ΔPldA-in). (g) siTNFR1 transfected into BMDM and the expression of TNFR1 was verified using immunoblotting. Actin was used as an internal control. (h to j) siCTL and siTNFR1 BMDMs were either uninfected (N. I.) or infected with WT or Δ PldA at a MOI of 100 for 3 hr. Immunoblotting was used to detect the levels of p38, p-p38, p-MK2 and MK2 (h), the levels of LC3-II (i) and the levels of active caspase-8 (p18) (j). Actin was used as an internal control. Each value represents the mean ± SD from 3 independent experiments. Statistical significance (α = 0.05) was calculated using a two-tailed unpaired Student’s t-test. *p < .05, **p < .01, **p < .001.
Figure 8.
Figure 8.
Suppression of PldA reduces bacterial survival and alters macrophage responses both in vitro and in vivo. (a to b) the H. pylori strains were treated with or without HDSF (1 mm) for 1 hr, followed by non-infection or infection with various strains of H. pylori (WT or ∆PldA) at a MOI of 100 for 3 hr. The levels of p-p38, p38, p-MK2 and MK2 levels were detected by immunoblotting analysis. Actin was used as the internal control (a). Infected cells were treated with gentamycin (100 μg/ml), and the level of H. pylori internalized in macrophages was determined using a quantitative PCR analysis (b). (c) J774A.1 cells were infected with different strains of H. pylori (WT, ∆PldA, v633 or v1354), and immunoblotting assays were conducted to determine the level of p-p38 or p38. Actin was used as the internal control. (d to e) H. pylori was pretreated with HDSF (1 mm) for 1 hr, followed by non-infection or infection with various H. pylori strains (WT, ∆PldA, v633 or v1354) at a MOI of 100 for 3 hr. Immunoblotting was used to detect the levels of p38, p-p38 (d), LC3-II, and active caspase-8 (p18) (e). Actin was used as an internal control. (f) J774A.1 cells were infected with different strains of H. pylori (v633 or v1354). The infected cells were treated with gentamycin (100 μg/ml), and levels of H. pylori internalized in macrophages were assessed using qPCR analysis. Each value represents the mean ± SD from 4 (b) or 3 independent experiments. 633, v633; and 1354, v1354. C57BL/6 mice received orogastric inoculations every 2 days with either WT H. pylori, ΔPldA, or WT H. pylori pre-treated with HDSF (1 × 109 CFU), resulting in 4 total inoculations. (g) quantification of CD45+ leukocyte infiltration in gastric tissues following the regimen described. (h) infiltration levels of F4/80+/CD11b+ macrophages (left), Gr-1+/CD11b+ neutrophils (middle), and CD4+ T-cells (right) in gastric tissues following the regimen described. (i) gastric tissue bacterial loads of H. pylori assessed using qPCR, normalized to gapdh. (b and f) statistical significance (α = 0.05) was calculated using a two-tailed unpaired Student’s t-test. (g to i) data points represent individual mice, with bars indicating mean ± SEM collated from 3 independent experiments. Statistical analysis involved the Kruskal-Wallis test and subsequent Dunn’s post hoc test. *p < .05, **p < .01, ***p < .001.
Figure 9.
Figure 9.
A proposed model of PldA-mediated dysregulation in macrophage defense against H. pylori infection. During H. pylori infection, the PldA enzyme is activated, which triggers the production of lysophospholipids. These lipids can damage the macrophage membrane, preventing the clustering of TNFR1, which is important for effective TNF-TNFR1 signaling. This disruption weakens the host’s immune defense, creating a favorable environment for the persistence of H. pylori.

References

    1. WHO . IARC monographs on the evaluation of carcinogenic risks to humans. Schistosomes, Liver Flukes And Helicobacter pylori. 1994;61:177–28. - PMC - PubMed
    1. Peek RM Jr., Crabtree JE.. Helicobacter infection and gastric neoplasia. J Pathol. 2006;208(2):233–248. doi:10.1002/path.1868. - DOI - PubMed
    1. Antimicrobial Resistance C, Ikuta KS, Sharara F, Swetschinski L, Robles Aguilar G, Gray A, Han C, Bisignano C, Rao P, Wool E.. Global burden of bacterial antimicrobial resistance in 2019: a systematic analysis. Lancet. 2022;399(10325):629–655. doi:10.1016/S0140-6736(21)02724-0. - DOI - PMC - PubMed
    1. Mohammadzadeh R, Menbari S, Pishdadian A, Farsiani H. Helicobacter pylori virulence factors: subversion of host immune system and development of various clinical outcomes. Expert Rev Mol Med. 2023;25:e23. doi:10.1017/erm.2023.17. - DOI - PubMed
    1. Hessey SJ, Spencer J, Wyatt JI, Sobala G, Rathbone BJ, Axon AT, Dixon MF. Bacterial adhesion and disease activity in Helicobacter associated chronic gastritis. Gut. 1990;31(2):134–138. doi:10.1136/gut.31.2.134. - DOI - PMC - PubMed

MeSH terms

Substances

LinkOut - more resources