. 2024 Oct 6;15(1):8658.
doi: 10.1038/s41467-024-52666-y.

GLUT1 overexpression in CAR-T cells induces metabolic reprogramming and enhances potency

Affiliations

GLUT1 overexpression in CAR-T cells induces metabolic reprogramming and enhances potency

Justin A Guerrero et al. Nat Commun. .

Abstract

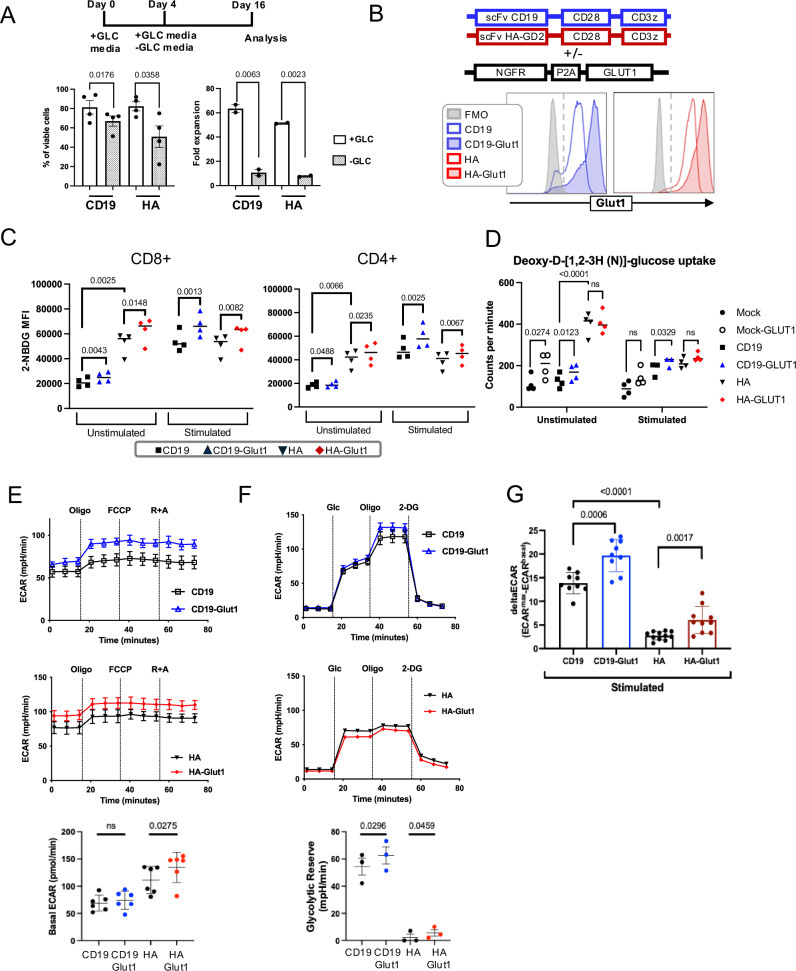
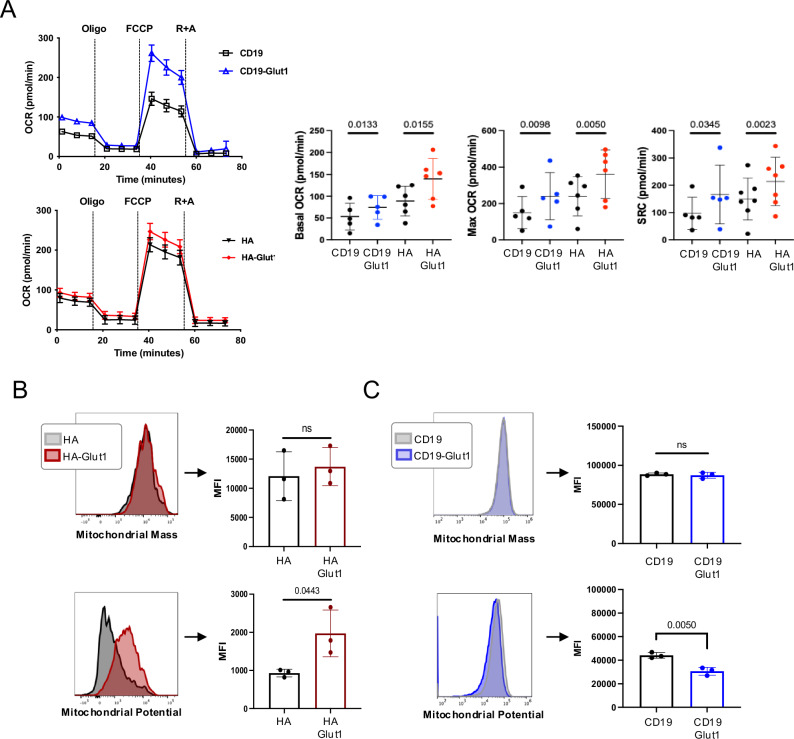
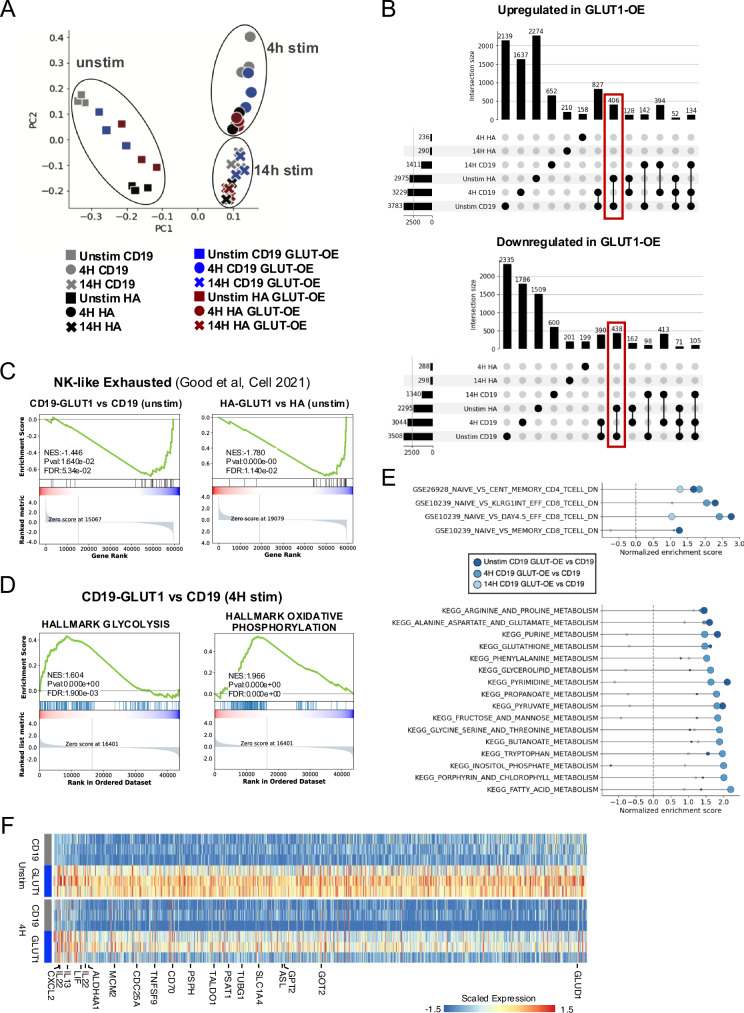
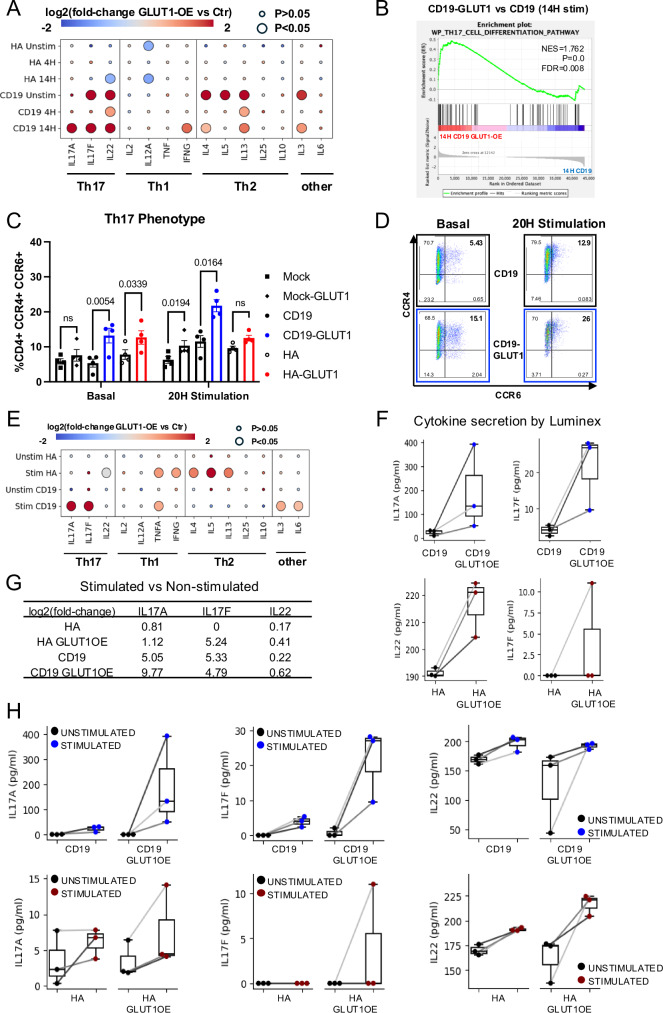
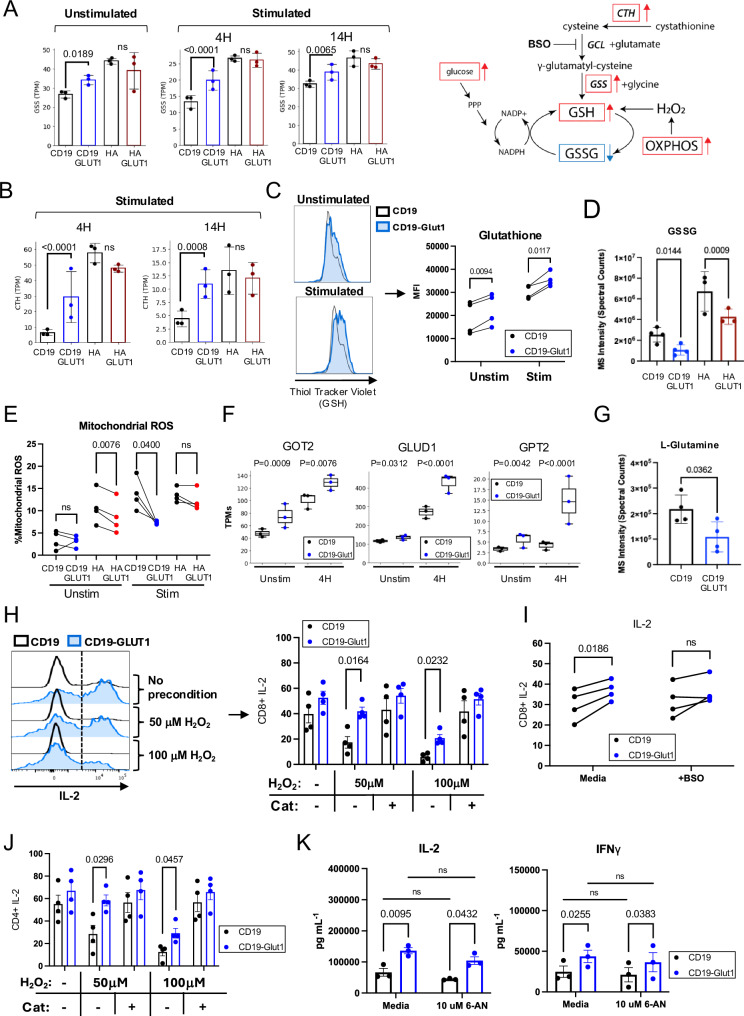
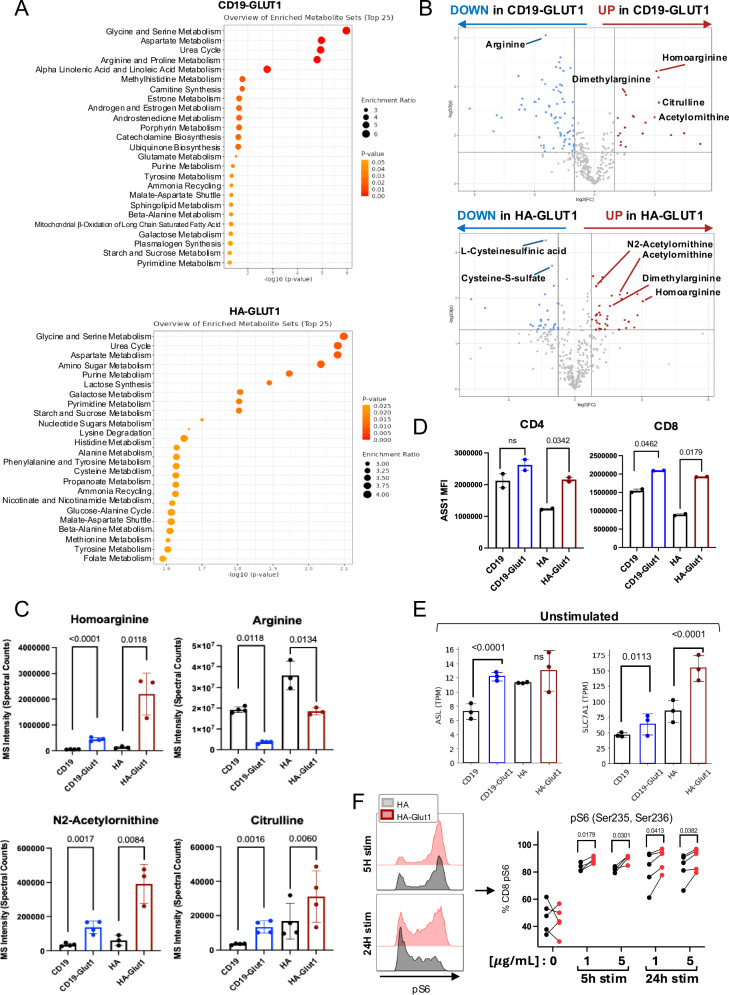
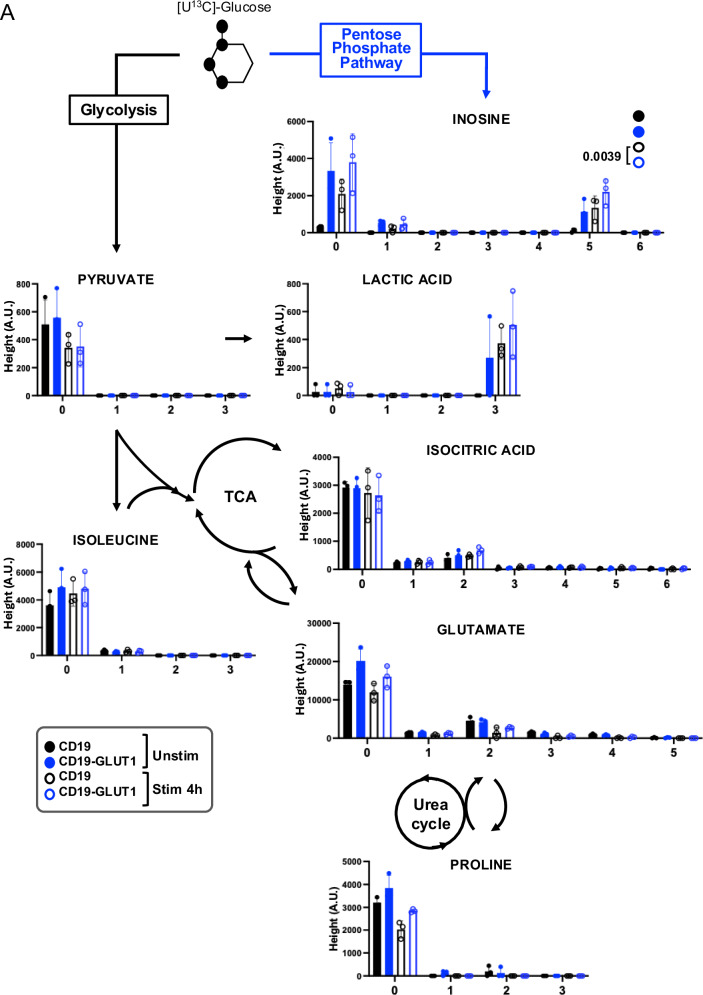
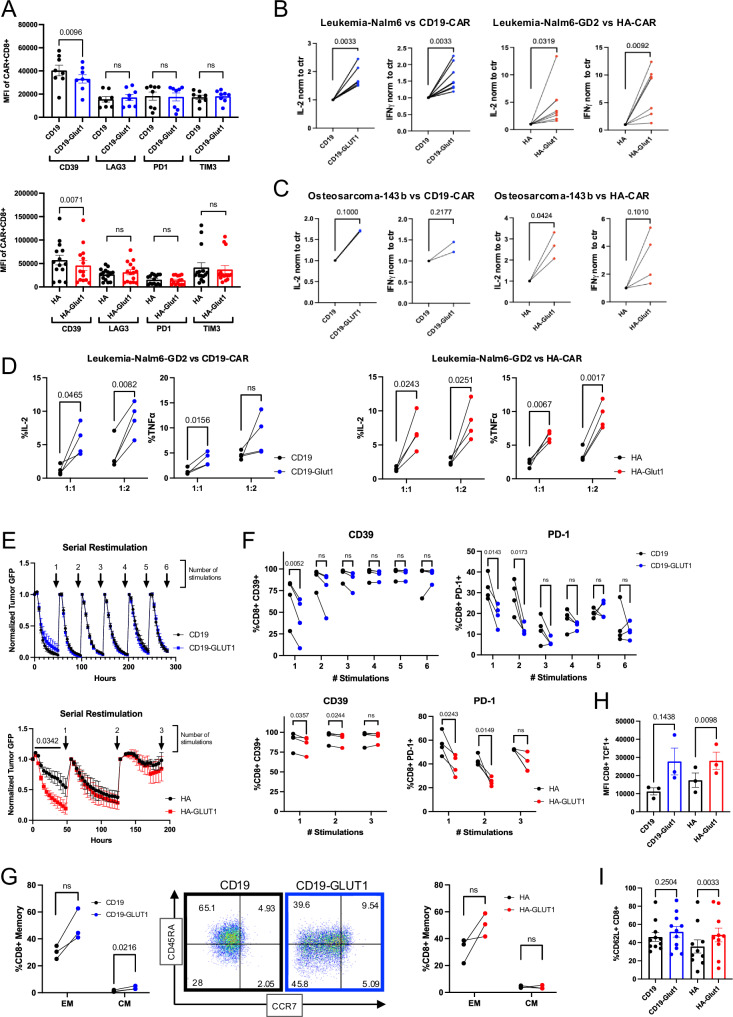
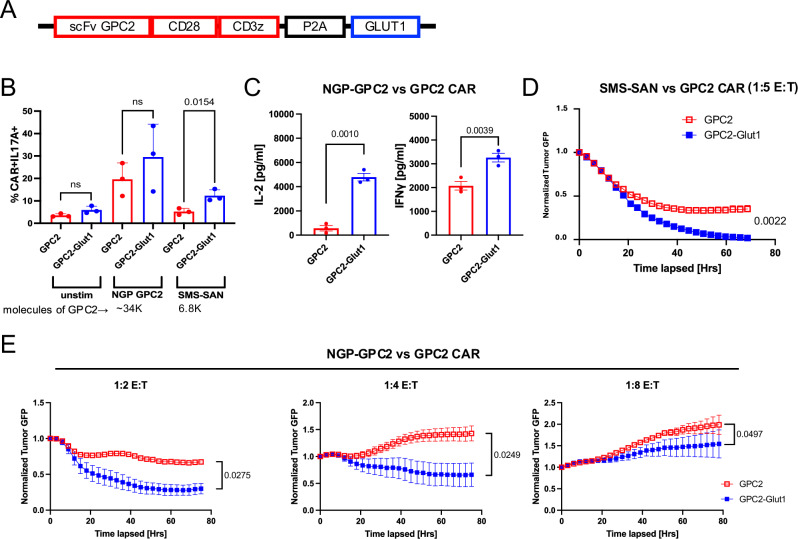
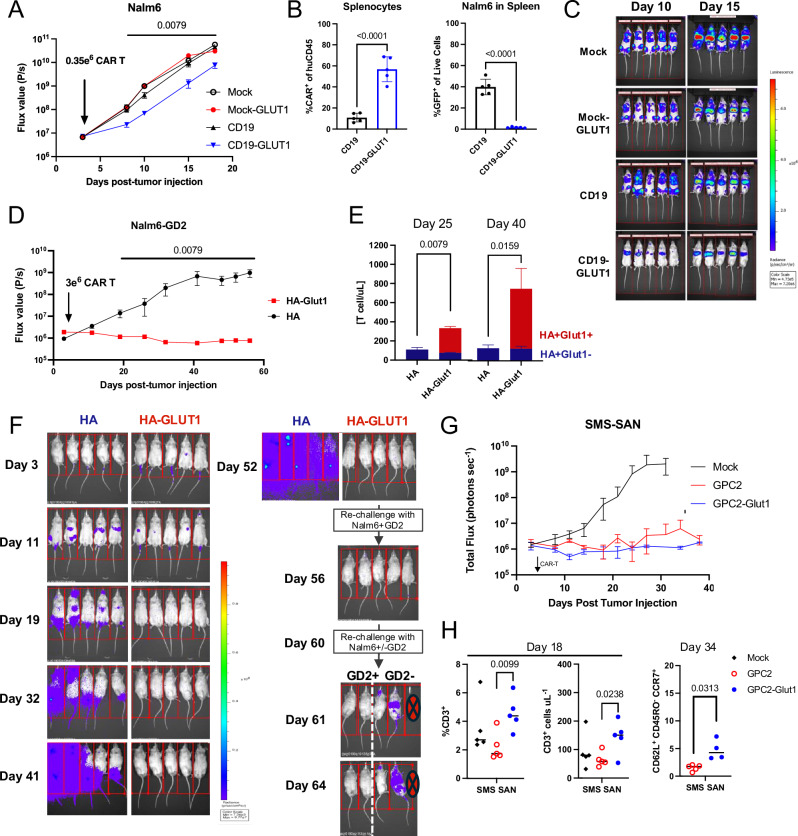
The intensive nutrient requirements needed to sustain T cell activation and proliferation, combined with competition for nutrients within the tumor microenvironment, raise the prospect that glucose availability may limit CAR-T cell function. Here, we seek to test the hypothesis that stable overexpression (OE) of the glucose transporter GLUT1 in primary human CAR-T cells would improve their function and antitumor potency. We observe that GLUT1OE in CAR-T cells increases glucose consumption, glycolysis, glycolytic reserve, and oxidative phosphorylation, and these effects are associated with decreased T cell exhaustion and increased Th17 differentiation. GLUT1OE also induces broad metabolic reprogramming associated with increased glutathione-mediated resistance to reactive oxygen species, and increased inosine accumulation. When challenged with tumors, GLUT1OE CAR-T cells secrete more proinflammatory cytokines and show enhanced cytotoxicity in vitro, and demonstrate superior tumor control and persistence in mouse models. Our collective findings support a paradigm wherein glucose availability is rate limiting for effector CAR-T cell function and demonstrate that enhancing glucose availability via GLUT1OE could augment antitumor immune function.


Conflict of interest statement

C.L.M. is a cofounder of and holds equity in Link Cell Therapies, CARGO therapeutics and GBM NewCo. E.S holds equity in Lyell Immunopharma and consults for Lepton Pharmaceuticals and Galaria. S.A.F. serves on the Scientific Advisory Boards for Alaunos Therapeutics and Fresh Wind Biotech and has equity interest in both; S.A.F. receives research funding from CARGO and Tune Therapeutics. C.L.M. receives research funding from Lyell, Tune and consults for CARGO, Link, GBMNewCo, Immatics, and Ensoma. K.L.D is a St. Baldrick’s Foundation Scholar and acknowledges support from Hyundai Hope on Wheels and Oxnard Foundation (K.L.D.). K.C. is currently employed by AstraZeneca. The remaining authors declare no competing interests.

Figures

Fig. 1
Fig. 1. GLUT1 overexpression enhances glycolysis.
A (TOP) Schematic of experimental design: CAR-T cells were activated in the presence of glucose and then cultured in media ± glucose starting on day 4. Glucose concentration is 11 mM for all experiments unless otherwise noted. (BOTTOM) Viability and fold expansion on day 16. Pooled data of n = 2–4 donors. P values determined by paired two-tailed t-tests. Error bars represent SD. B (TOP) Schema of retroviral vectors expressing CAR and NGFR-P2A-GLUT1. NGFR is used as a selectable membrane marker of GLUT1-OE cells. (BOTTOM) Representative flow cytometry histogram of GLUT1 surface expression using a GLUT1-specific H2RBD-GFP ligand, in control CD19 and HA CAR T cells ± NGFR-GLUT1 vector (CD19-GLUT1, HA-GLUT1). Analysis of GLUT1OE CAR T cells performed by gating on CAR+/NGFR+ populations (percentage of double-positive >80% for each experiment unless otherwise noted). FMO Fluorescence minus one control. C 2-NBDG median fluorescence intensity of (LEFT) CD8+ and (RIGHT) CD4+ control HA and CD19 CAR T cells and double positive gated NGFR+CAR+ cotransduced CD19-GLUT1, HA-GLUT1 ± 24H idiotype stimulation (1 µg/mL). Pooled data of n = 4 donors. P values determined by paired two-tailed t-tests. D Pooled data reflecting glucose uptake in CAR-T cells ± 24 h stimulation with idiotype using deoxy-D-[1,2-3H(N)]-glucose. Data from n = 4 donors. P values determined by paired two-tailed t-tests. E (TOP) Representative extracellular acidification rate (ECAR) measured using Seahorse for CD19 ± GLUT1OE on day 14 from one donor. (MIDDLE) ECAR for HA ± GLUT1OE. (BOTTOM) Pooled data for basal ECAR. Data are representative of three independent experiments with n = 6 donors. P values determined by paired two-tailed t-tests. Error bars represent SD. F (TOP) Representative ECAR (Glycolytic Stress Test) measured using Seahorse for CD19 ± GLUT1OE on day 12 from one donor. (MIDDLE) ECAR for HA ± GLUT1OE. (BOTTOM) Pooled glycolytic reserve data. Data are representative of one experiment with n = 3 donors. P values determined by paired two-tailed t-tests. Error bars represent SD. G ECAR measured at the baseline and 3 minutes after stimulation with 10 µg/ml of anti-idiotype crosslinked with 10 µg/mL of anti-mFAB on day 16. P values determined by unpaired two-tailed t-tests. Error bars represent SD.
Fig. 2
Fig. 2. GLUT1 overexpression enhances oxidative phosphorylation.
A (LEFT) Representative OCR (Oxygen Consumption Rate) data measured using Seahorse for CD19 ± GLUT1OE or for HA ± GLUT1OE on day 12. (RIGHT) Pool data for Basal and Maximum OCR and SRC (Spare Respiratory Capacity) from three independent experiments with n = 6 donors. P values determined by paired two-tailed t-tests. Error bars represent SD. B (TOP) Mitochondrial mass and (BOTTOM) potential detected using Mitotracker Green and Deep Red, respectively in HA ± GLUT1OE CAR-T cells on day 9 with representative histograms shown. Data from n = 3 donors. P values determined by paired two-tailed t-tests. Error bars represent SD. C (TOP) Mitochondrial mass and (BOTTOM) potential detected using Mitotracker Green and Deep Red, respectively in CD19 ± GLUT1OE CAR-T cells on day 9 with representative histograms shown. Data from n = 3 donors. P values determined by paired two-tailed t-tests. Error bars represent SD.
Fig. 3
Fig. 3. GLUT1 overexpression induces transcriptional reprogramming.
A Unbiased principal component analysis of bulk RNA derived from day 16 CD19 and HA ± GLUT1OE ± 1 µg / mL anti-idiotype stimulation collected at two different time points. Cotransduced cells were magnetically enriched for greater than 95% double positive prior to experiment. Pooled data from two experiments (stimulated and unstimulated) with total n = 6 donors. B UpSets plots showing intersection of genes differentially upregulated (TOP) or downregulated (BOTTOM) upon GLUT1OE in HA-CAR and CD19-CAR T cells unstimulated or at 4 h and 14 h post stimulation. Red boxes highlight shared changes between CD19-CAR and HA-CAR T cells as a consequence of GLUT1OE at baseline. RNAseq data from n = 6 donors on day 16. C GSEA analysis of the NK-like exhaustion signature in unstimulated (LEFT) CD19 and (RIGHT) HA-CAR-T cells, comparing GLUT1OE versus control. D GSEA analysis of (LEFT) glycolysis and (RIGHT) OXPHOS for CD19 ± GLUT1OE after 4 h of anti-idiotype stimulation (1 µg/mL). E (TOP) GSEA analysis of RNA-seq comparing CD19 GLUT1OE vs CD19 showing enrichment of memory and effector T cell signatures over naïve in CD4 and CD8 at every timepoint analyzed (unstimulated, 4 h or 14 h post-stimulation). (BOTTOM) Similar GSEA analysis using as reference KEGG pathways dataset showing wide metabolic reprogramming. The size of the dots correlates with −log10(P-value) by GSEA analysis, with the smallest dots representing non-significant pathways. F Heatmap representing differentially expressed genes with annotations for those significantly upregulated in CD19-GLUT1 ± 4 h of anti-idiotype stimulation.
Fig. 4
Fig. 4. GLUT1 overexpression induces Th17 differentiation.
A Bubble plot highlighting the changes in cytokine expression for CD19 and HA ± GLUT1OE CAR-T cells, ± idiotype stimulation. The color of the bubble represents the fold-change of expression, while the size represents statistical significance assessed by Wilcox’s rank-sum test. B GSEA analysis of Th17 signatures in CD19-CAR T cells with GLUT1OE versus control, at 14 h post-stimulation. C Pooled data of CD4+ CCR4+ CCR6+ Mock and CAR-T cells on day 17 (baseline) and after 20 h idiotype stimulation. Data from n = 4 donors. P values determined by paired two-tailed t-tests. Error bars represent SEM. D Representative flow cytometry of CD4+ gated CD19 ± GLUT1OE CAR-T cells showing Th17 phenotype. E Bubble plot highlighting the changes in cytokine secretion for CD19 and HA ± GLUT1OE CAR-T cells, ±Nalm6 challenge as captured by Luminex. The color of the bubble represents the fold-change of expression, while the size represents statistical significance assessed by Wilcox’s rank-sum test. F Boxplots of Th17-related cytokines in CD19-CAR and HA-CAR T cells ± GLUT1OE after 24 h stimulation with Nalm6 as captured using Luminex. Data points from the matched donors are connected with lines. G The log2(fold-change) in IL17A, IL17F, and IL22 expression in stimulated versus unstimulated state in each CAR-T cell. H Boxplots of Th17-related cytokines in stimulated versus unstimulated CD19-CAR and HA-CAR-T cells, with and without GLUT1-OE. Data points from the matched donors are connected with lines.
Fig. 5
Fig. 5. GLUT1 overexpression enhances metabolic pathways that favor resistance to REDOX suppression.
A (LEFT) Transcripts Per Million (TPMs) of GSS (Glutathione Synthetase) transcripts for CD19 and HA ± GLUT1OE CAR-T cells at baseline and stimulated for 4 h and 14 h with anti-idiotype. Data from n = 3 donors. P values calculated using DESeq2. (RIGHT) Schematic of pathways involved in GSH REDOX with relevant metabolomic derivatives. Red arrows indicate elements found to be enriched with GLUT1OE. Blue arrows indicate elements found to be decreased with GLUT1OE. B TPMs of CTH (cystathionine gamma-lyase) transcripts for CD19 and HA ± GLUT1OE CAR-T cells stimulated for (LEFT) 4 h and (RIGHT) 14 h with anti-idiotype. Data from n = 3 donors. P values calculated using DESeq2. C (LEFT) Representative histograms showing CAR+ intracellular GSH content using ThiolTracker for CD19 ± GLUT1OE CAR-T cells ± 4 h 1 µg / mL anti-idiotype stimulation. (RIGHT) Quantitative data of CAR + GSH MFI. Cotransduced cells were magnetically enriched for greater than 95% double positive prior to experiment. Data from n = 4 donors. P values determined by paired t-tests. D Untargeted LC-MS data depicting cysteineglutathione disulfide (GSSG, or oxidized GSH) abundance in electronically sorted CD19 and HA ± GLUT1OE CAR-T cells at day 14. Pooled data of n = 4 donors. P values determined by unpaired two-tailed t-tests. Error bars represent SD. E Pooled mitochondrial ROS data collected via intracellular staining. Day 15 CAR-T cells were subject to 2 h anti-idiotype stimulation. Data were reflective of n = 4 donors. P values determined by paired t-tests. F A TPMs of glutaminolysis-related genes GOT2, GLUD1, and GPT2 transcripts for CD19 ± GLUT1OE CAR-T cells unstimulated or stimulated for 4 h with anti-idiotype. Data from n = 3 donors. P values calculated using DESeq2. G Untargeted LC-MS data depicting L-glutamine abundance in electronically sorted CD19 ± GLUT1OE CAR-T cells at day 14. Pooled data of n = 4 donors. P values determined by unpaired two-tailed t-tests. Error bars represent SD. H Intracellular IL-2 staining for CD8+ CD19 ± GLUT1OE CAR-T cells ± pre-exposure to oxidative stress (hydrogen peroxide). (LEFT) Representative flow cytometry. (RIGHT) Pooled data. Cells were challenged with Nalm6-GL at a 1:1 ratio on day 14. Data from n = 4 donors. P values determined by paired t-tests. Error bars represent SEM. I Intracellular IL-2 staining for CD8+ CD19 ± GLUT1OE CAR-T cells stimulated ± BSO (Buthionine Sulfoximine). Cells were stimulated via 1 ug/L plate-bound anti-idiotype on day 14. Data from n = 4 donors. P values determined by paired t-tests. Error bars represent SEM. J Intracellular IL-2 staining for CD4+ CD19 ± GLUT1OE CAR-T cells ± pre-exposure to oxidative stress (hydrogen peroxide). Cells were challenged with Nalm6-GL at a 1:1 ratio on day 14. Data from n = 4 donors. P values determined by paired t-tests. Error bars represent SEM. K Cytokine secretion of CD19 ± GLUT1OE CAR-T cells challenged 1:1 with Nalm6 leukemia ± 6-Aminonicotinamide (6-AN) on day 14 as measured by ELISA. Data reflective of n = 3 donors. P values determined by paired t-tests. Error bars represent SEM.
Fig. 6
Fig. 6. GLUT1 overexpression alters arginine metabolism.
A LC-MS data depicting top metabolomic pathways enriched in electronically sorted (TOP) CD19-GLUT1 and (BOTTOM) HA-GLUT1 CAR-T cells on day 14. Significantly differential metabolites were analyzed using MetaboAnalyst. B Volcano plots of metabolite abundance related to the Urea Cycle in electronically sorted (TOP) CD19-GLUT1 and (BOTTOM) HA-GLUT1 CAR-T cells on day 14. Red circles indicate metabolites that significantly increased. Blue circles indicate metabolites that significantly decreased. Data from n = 4 donors. C Quantitative data showing metabolites involved in Urea Cycle for electronically sorted CD19 and HA ± GLUT1OE on day 14. Data from n = 3 or 4 donors. P values determined by unpaired two-tailed t-tests. Error bars represent SD. D Flow cytometric analysis of intracellular expression of Argininosuccinate synthase 1 (ASS1) on (LEFT) CD4 and (RIGHT) CD8 CD19 and HA ± GLUT1OE CAR-T cells on day 16. Quantitative data from n = 2 donors. P values determined by paired two-tailed t-tests. Error bars represent SD. E TPMs of (LEFT) ASL (argininosuccinate lyase) and (RIGHT) SLC7A1 transcripts for CD19 and HA ± GLUT1OE CAR-T cells at baseline. Data from n = 3 donors. P values determined by paired two-tailed t-tests. Error bars represent SD. F (LEFT) Representative histograms of intracellular phosphorylated ribosomal subunit 6 (pS6) 5 and 24 h after anti-idiotype stimulation for CD8 + HA ± GLUT1OE CAR-T cells on day 16. (RIGHT) Quantitative data of CD8+ pS6+ HA ± GLUT1OE CAR-T cells ± stimulation. Data from n = 4 or 5 donors. P values determined by paired two-tailed t-tests.
Fig. 7
Fig. 7. 13C-Glucose tracing in CD19 CAR-T cells with GLUT1OE.
A [U13C] glucose tracing. CAR-T cells ± GLUT1OE were administered 11 mM labeled glucose ± 4 h idiotype stimulation. X axis reflects isotopologue. Y axis represents Height in aleatory units. Statistics generated by paired, two tailed t-test (90% confidence) based on sum of total isotopologues ≥ 1 in each condition. Data from n = 3 donors. Error bars represent SD.
Fig. 8
Fig. 8. GLUT1 overexpression enhances potency and delays onset of exhaustion in response to tumor rechallenge.
A MFI of exhaustion markers CD39, LAG3, PD1 and TIM3 expressed by (TOP) CD19 or (BOTTOM) HA ± CD8+ GLUT1OE CAR-T cells on day 14. Pooled data of n = 14 donors. P values determined by paired two-tailed t-tests. Error bars represent SEM. B ELISA analysis of IL-2 and IFNγ secretion by CD19 and HA ± GLUT1OE CAR-T cells after 24 hour stimulation with (LEFT) Nalm6 or (RIGHT) Nalm6-GD2 leukemia tumor lines on day 14. Data from n = 6 donors. P values determined by paired two-tailed t-tests. C ELISA analysis of IL-2 and IFNγ secreted by CAR-T cells ± GLUT1OE CAR-T cells after 24 hour stimulation with 143b against (LEFT) CD19 and (RIGHT) HA on day 14. Data from n = 2–4 donors. P values determined by paired two-tailed t-tests. D Intracellular staining of IL-2 and TNFα by (LEFT) CD19 and (RIGHT) HA ± GLUT1OE CAR-T cells after 24 h of stimulation with Nalm6-GD2 leukemia at 1:1 and 1:2 E:T on day 14. Data from n = 4 donors. P values determined by paired two-tailed t-tests. E Serial rechallenge and tumor-GFP killing kinetics data using Incucyte. Pooled data of 4 donors (TOP) CD19 and (BOTTOM) HA ± GLUT1OE CAR-T cells sequentially challenged at 1:2 ratio with Nalm6 leukemia ± GD2. Incucyte p values generated using two way ANOVA. Error bars represent SEM. F Flow cytometry measurements of CD39 and PD-1 of CD8+ (TOP) CD19 and (BOTTOM) HA ± GLUT1OE CAR-T cells after each stimulation denoted by arrows in (E). P values determined by paired two-tailed t-tests. G Memory formation data of serially rechallenged CD8+ CAR-T cells after (LEFT) 4 stimulations for CD19 ± GLUT1OE with representative flow cytometry of CD62L+ cells and (RIGHT) 3 stimulations for HA ± GLUT1OE. EM- effector memory, CM- central memory. P values determined by paired two-tailed t-tests. H Pooled intracellular expression of TCF1 in CD19 and HA ± GLUT1OE CAR-T cells on day 16. Data from n = 3–4 donors. P values determined by paired two-tailed t-tests. Error bars represent SEM. I Pooled surface expression of CD62L in CD19 or HA ± GLUT1OE CAR-T cells on day 16. P values determined by paired two-tailed t-tests. Error bars represent SEM.
Fig. 9
Fig. 9. GLUT1 overexpression increases potency of GPC2-CAR T cells against neuroblastoma in vitro.
A Design of GPC2 CAR and GLUT1 expressing vector (B) Intracellular cytokine staining after 24 h of GPC2 ± GLUT1OE CAR T cells stimulated with three different tumor lines on day 14. Error bars represent mean ± SD of triplicate wells from one donor. P values determined by unpaired two-tailed t-tests. C Day 14 post activation CAR T cells stimulated with NGP-GPC2 at 1:1 E:T ratio. IL-2 and IFNγ secretion was assessed 24 h post-stimulation via ELISA. Data from n = 3 donors. P values determined by paired two-tailed t-tests. Error bars represent SEM. D Day 14 post-activation CAR T cells stimulated with SMS-SAN-GL tumor line at 1:5 E:T ratio and tumor killing was assessed using Incucyte. Error bars represent mean ± SD of triplicate wells from one representative donor (n = 2 donors). P values determined by two-way ANOVA. E Tumor killing kinetics of GPC2 ± GLUT1OE CAR T cells challenged with NGP-GPC2 across E:Ts captured by Incucyte. P values determined by two-way ANOVA.
Fig. 10
Fig. 10. GLUT1 overexpression enhances CAR-T cell tumor clearance in vivo.
A Tumor progression was monitored using bioluminescent imaging. Data are mean ± SD of n = 5 mice per group. Data representative of n = 2 experiments. P values determined by Mann-Whitney test. B Flow cytometry analysis of total splenocytes for (LEFT) %CAR+ cells of human CD45 and (RIGHT) Nalm6 GFP. Statistics generated by unpaired two-tailed t-tests reflective of n = 5 mice per group. C Representative BLI of tumor progression in vivo. D Tumor progression was monitored using bioluminescent imaging. Data are mean ± SD of n = 5 mice per group. Data representative of n = 3 experiments. P values determined by Mann-Whitney test. E T cells detected in peripheral blood at (TOP) 25 and (BOTTOM) 40 days post-tumor injection. Data are mean ± SEM of n = 5 mice per group. F BLI of tumor progression in vivo. At days 52 and 60 post-tumor injection, HA-GLUT1 CAR-T cells were re-challenged. On day 60, HA-GLUT1 cohort were challenged with either Nalm6-GD2 or Nalm6 tumor cells. G Tumor progression was monitored using bioluminescent imaging. Data are mean ± SD of n = 5 mice per group. Data representative of n = 3 experiments. P values determined by Mann-Whitney test. H Flow cytometry analysis of peripheral blood for (LEFT) %CD3+ of live cells on day 18 and (RIGHT) TSCM populations on day 34 post tumor injection. Statistics generated by unpaired two-tailed t-tests reflective of n = 5 mice per group. Data representative of n = 3 experiments. Error bars represent SD.

References

    1. Xu, X. et al. A metabolism toolbox for CAR T therapy. Front. Oncol.9, 322 (2019). - PMC - PubMed
    1. MacIver, N. J., Michalek, R. D. & Rathmell, J. C. Metabolic regulation of T lymphocytes. Annu Rev. Immunol.31, 259–283 (2013). - PMC - PubMed
    1. Michalek, R. D. et al. Cutting edge: distinct glycolytic and lipid oxidative metabolic programs are essential for effector and regulatory CD4+ T cell subsets. J. Immunol.186, 3299–3303 (2011). - PMC - PubMed
    1. Pearce, E. L. et al. Enhancing CD8 T-cell memory by modulating fatty acid metabolism. Nature460, 103–107 (2009). - PMC - PubMed
    1. Shi, L. Z. et al. HIF1alpha-dependent glycolytic pathway orchestrates a metabolic checkpoint for the differentiation of TH17 and Treg cells. J. Exp. Med.208, 1367–1376 (2011). - PMC - PubMed

Publication types

MeSH terms

Associated data