. 2024 Oct 6;15(1):8659.
doi: 10.1038/s41467-024-53008-8.

Uncovering the small proteome of Methanosarcina mazei using Ribo-seq and peptidomics under different nitrogen conditions

Affiliations

Uncovering the small proteome of Methanosarcina mazei using Ribo-seq and peptidomics under different nitrogen conditions

Muhammad Aammar Tufail et al. Nat Commun. .

Abstract

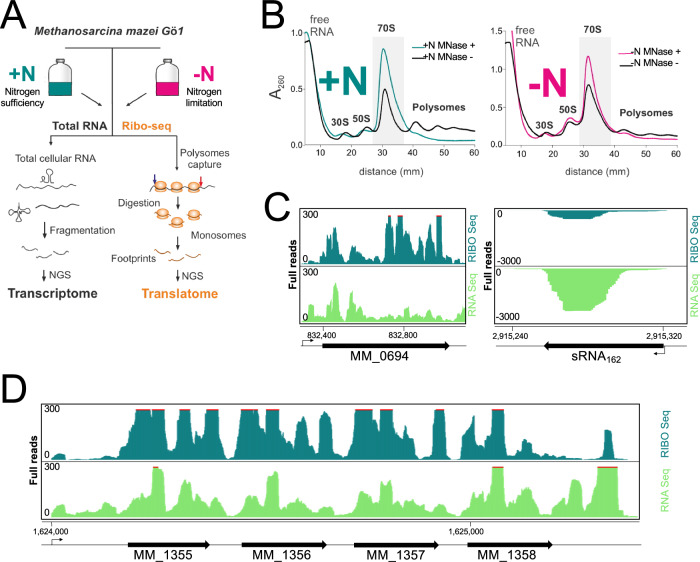
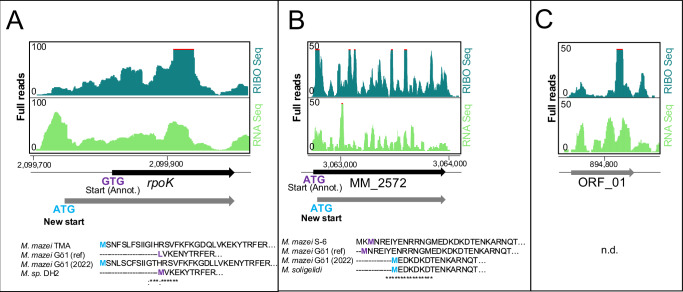
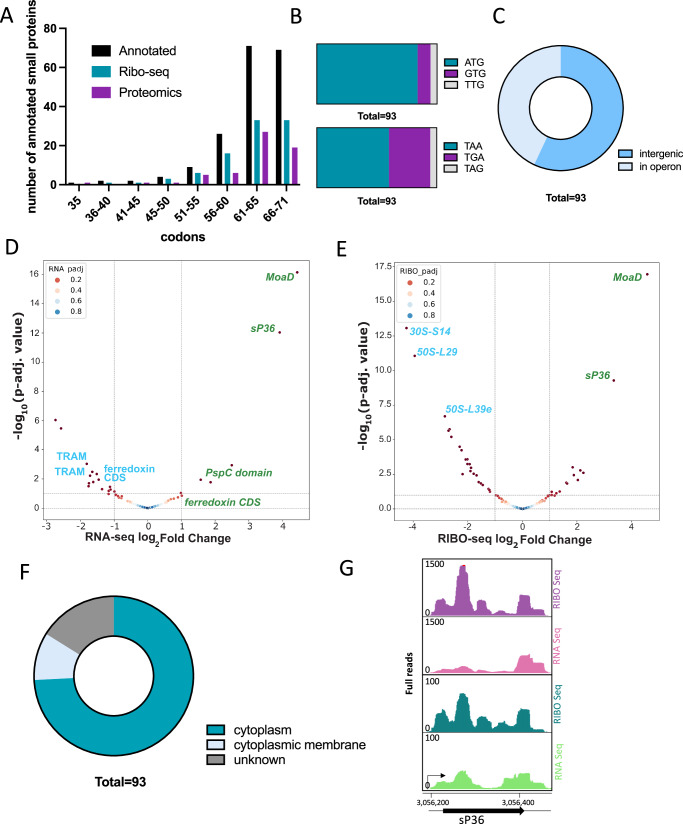
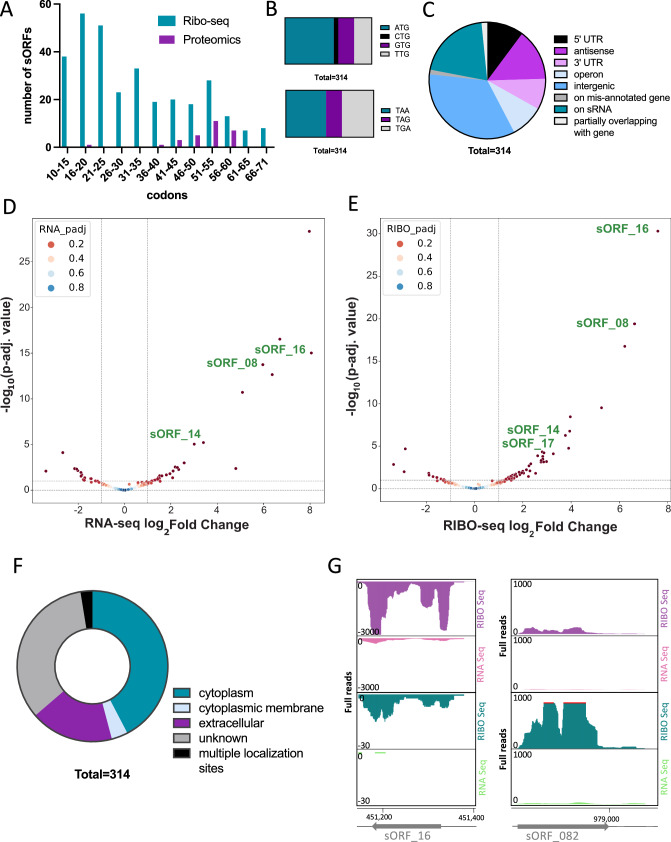
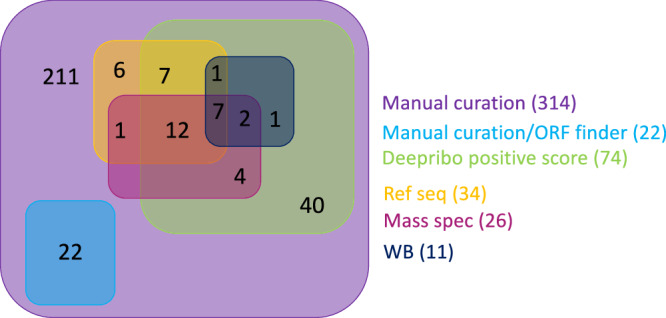
The mesophilic methanogenic archaeal model organism Methanosarcina mazei strain Gö1 is crucial for climate and environmental research due to its ability to produce methane. Here, we establish a Ribo-seq protocol for M. mazei strain Gö1 under two growth conditions (nitrogen sufficiency and limitation). The translation of 93 previously annotated and 314 unannotated small ORFs, coding for proteins ≤ 70 amino acids, is predicted with high confidence based on Ribo-seq data. LC-MS analysis validates the translation for 62 annotated small ORFs and 26 unannotated small ORFs. Epitope tagging followed by immunoblotting analysis confirms the translation of 13 out of 16 selected unannotated small ORFs. A comprehensive differential transcription and translation analysis reveals that 29 of 314 unannotated small ORFs are differentially regulated in response to nitrogen availability at the transcriptional and 49 at the translational level. A high number of reported small RNAs are emerging as dual-function RNAs, including sRNA154, the central regulatory small RNA of nitrogen metabolism. Several unannotated small ORFs are conserved in Methanosarcina species and overproducing several (small ORF encoded) small proteins suggests key physiological functions. Overall, the comprehensive analysis opens an avenue to elucidate the function(s) of multitudinous small proteins and dual-function RNAs in M. mazei.


Conflict of interest statement

The authors declare no competing interests.

Figures

Fig. 1
Fig. 1. Implementation of ribosome profiling (Ribo-seq) in M. mazei.
A Illustrative diagram of Ribo-seq process used to map the translatome of M. mazei in two growth conditions: Translating ribosomes were initially detected on the mRNAs through the polysome fraction. MNase digestion eliminated unprotected mRNA regions, leading to the transformation of polysomes into monosomes. The translatome in specific experimental conditions was profiled by subjecting 20-34 nucleotide footprints, which were protected and isolated by 70S ribosomes, to cDNA library preparation and deep sequencing. B Fractionation of the cell lysates using sucrose gradients: To avoid the run-off of polysome, cells were harvested during the exponential growth phase using a rapid-chilling method (see Methods). Upon MNase digestion, monosomes were enriched compared to the untreated sample, as indicated by the 70S peak in the green ( + N) and red (-N) profile, contrasting with the Mock black profile. The monosomes are indicated by a shaded box. Absorbance was measured at a wavelength of 260 nm. C JBrowse genome browser screenshots show that our Ribo-seq and RNA-seq datasets distinguish between translated regions (e.g. psmB (MM_0694) encoding archaeal proteasome endopeptidase complex subunit beta) and untranslated regions like the non-coding sRNA162. D The operon of four TRAM domain containing small proteins shows enriched read coverage in the Ribo-seq library along their coding parts but in contrast to the RNA-seq library not in the regions (3’ and 5’ UTRs) un-protected by ribosome. Angled arrows in C and D indicate transcriptional start site (TSS).
Fig. 2
Fig. 2. Lessons from Ribo-seq about protein synthesis in M. mazei.
A N-terminal extension of rpoK gene: Amino acid alignment shows annotated start of translation from different strains. B N-terminal truncation of MM_2572: Amino acid alignment based on blastp search shows N-terminus of homologues from different strains. Ref, reference annotation used in this study. C An unannotated ORF (ORF_01, Supplementary Data 1) encoding an 80 aa protein, was found during the manual curation of the Ribo-seq predictions with no hits in blastp (n.d.).
Fig. 3
Fig. 3. The global translatome.
A ORFs predicted to be translated by DeepRibo, a tool included in the HRIBO pipeline. To detect translation, we used the following parameters on the Ribo-seq data under +N and -N conditions: TE of ≥ 0.5 and RNA-seq and Ribo-seq RPKM of ≥ 10, when prediction by DeepRibo algorithm was needed, a positive DeepRibo score > 0 was chosen for cutoff criteria. B Start (upper panel) and stop codon (lower panel) distribution of annotated ORFs. C Scatter plot showing global translation efficiencies (TE = Ribo-seq/RNA-seq) computed from M. mazei Ribo-seq replicates under standard growth conditions, for all annotated coding sequences (CDS), annotated sORFs encoding proteins of ≤ 70 amino acids (aa), annotated small RNAs (sRNAs), and tRNAs. The black lines indicate the mean TE for each transcript class. Moreover, Mean ± SD TE and count of each transcript class is shown on the right top corner of plot. D Comparison of global RIBO and mRNA log2 FC values for +N and -N. Dashed lines indicate log2 fold change values of +1 or −1. Hundreds of genes exhibited differential expression (absolute log2 FC ≥ 1 and p-adjust ≤ 0.05) at both the transcriptional and translational levels (orange dots) with Pearson’s correlation coefficient (r = 0.87), whereas others were exclusively detected by either RNA-Seq (green dots) or Ribo-Seq (blue dots). Volcano plots illustrating differential (E) mRNA levels of 185 downregulated genes and 152 upregulated genes and (F) RIBO levels 414 downregulated and 247 upregulated genes in M. mazei for all annotated ORF candidates identified in this study (Supplementary Data 2). The global translatome (G) Up- and (H) down-regulated biological processes in M. mazei under -N. Enrichment Analysis was conducted using the enrichGO function in the clusterProfiler package with the ribosome profiling differential expression data sorted by log2 fold change values as input. GO terms were considered as either up- or down-regulated if p-adjust values were ≤ 0.05. The top 15 non-redundant GO terms were sorted in descending order by the clusterProfiler gene ratio. Source data for C and D are provided as a Source Data file.
Fig. 4
Fig. 4. Annotated small proteins in M. mazei.
A The histogram shows the codon length distribution of all annotated sORFs, the translated annotated sORFs and the aa of small proteins detected by mass spectrometry. B Start (upper panel) and stop codon (lower panel) distribution of annotated ORFs. C Genomic context of the translated annotated sORFs. Volcano plot for regulation of the small annotated sORFs at (D) transcription level of 11 downregulated and 5 upregulated genes and (E) translation level of 22 downregulated and 9 upregulated genes. F Subcellular localization of respective small proteins encoded by translated annotated sORFs. G sP36 as example for differential expression. Green color indicates +N condition, pink is -N condition (pay attention to different scales in y-axes).
Fig. 5
Fig. 5. Features of the unannotated small proteome.
A Length distribution of 314 sORFs based on Ribo-seq data and 26 small proteins identified by LC-MS. B Start (upper panel) and stop (lower panel) codon usage. C genomic context (D, E) differential expression (289 matched out of 314 unannotated sORFs). Volcano plot for regulation of the unannotated sORFs at (D) RNA level of 9 downregulated genes and 20 upregulated genes, and (E) RIBO level of 7 downregulated genes and 42 upregulated genes. F Localization in the cell (G) Screenshots of sORF_16 and sORF_082 as examples for N-regulation, pink/purple: -N, green/turquois: +N (pay attention to different scales in y-axes).
Fig. 6
Fig. 6. Detection of small proteins in M. mazei cell extract by western blot analysis.
A Expression of selected small proteins under control of their respective native promoter and ribosome binding site under +N as well as –N conditions. The empty vector was used as a negative control. SDS PAGE followed by western blot analysis was performed with each 30 µg M. mazei cell extract from exponential growing cultures. A monoclonal FLAG-directed antibody was used to detect the SPA-tag at the C-terminus of the small protein under +N with constitutive overproduction. All corresponding growth experiments were performed in three biological replicates and the subsequent western blot was performed with the cell extracts from one biological replicate each. Source data are provided as a Source Data file. B Overview of detection using different methods for selected small proteins. Those which were not confirmed by western blot analysis have been validated by LC-MS.
Fig. 7
Fig. 7. Characterization of two unannotated small proteins encoded by sORF_05 and sORF_06.
A Overexpressed sORF_05 has a negative impact on M. mazei growth rate under N sufficiency, while (B) overexpressed sORF_06 leads to faster transition to stationary phase under N limitation. Growth of M. mazei mutants were monitored by measuring at OD600 over the time. Data are represented as mean values ± standard deviation (SD) (visualized as shadows) is based on three biological replicates. Source data are provided as a Source Data file. C Structure prediction with AlphaFold 2 indicates a hydrophobic α-helical structure of sORF_05 encoded small protein. Colour shows hydrophobicity as indicated. D Membrane association of sORF_05 encoded small protein was validated via western blot of fractionated cell extract; one of two biological replicates is exemplarily shown. Source data are provided as a Source Data file. E Screenshot of the TMA permease transporter operon shows the location of sORF_05 integrated in the operon structure (Turquoise, Ribo Seq; green, RNA Seq. Scale bar shows full reads). F Predicted structure of sORF_06 encoded small protein by AlphaFold shows four clustered cysteins (highlighted in yellow, in black circle). Colour shows confidence (Blue, high; yellow, low). G Screenshot from JBrowse shows the high translation of sORF_06.
Fig. 8
Fig. 8. Overview of detection methods and validation for 314 unannotated sORFs after manual curation.
22 sORFs were predicted with NCBI ORF finder, 74 sORFs had a positive prediction score from Deepribo prediction, 34 sORFs are included in the actual Ref seq annotation (November 2022), 26 sORFs were validated by MS analysis and 13 out of 16 sORFs were confirmed by western blot analysis and two of them are not included in the unannotated sORFs list (internal to the ORFs).

References

    1. Dai, X. & Shen, L. Advances and trends in omics technology development. Front Med (Lausanne)9, 911861 (2022). - PMC - PubMed
    1. Land, M. et al. Insights from 20 years of bacterial genome sequencing. Funct. Integr. Genomics15, 141–161 (2015). - PMC - PubMed
    1. Ahrens, C. H., Wade, J. T., Champion, M. M. & Langer, J. D. A Practical guide to small protein discovery and characterization using mass spectrometry. J. Bacteriol.204, e00353–00321 (2022). - PMC - PubMed
    1. Storz, G., Wolf, Y. I. & Ramamurthi, K. S. Small proteins can no longer be ignored. Annu Rev. Biochem83, 753–777 (2014). - PMC - PubMed
    1. Aoyama, J. J., Raina, M., Zhong, A. & Storz, G. Dual-function Spot 42 RNA encodes a 15-amino acid protein that regulates the CRP transcription factor. Proc. Natl Acad. Sci. USA119, e2119866119 (2022). - PMC - PubMed

Publication types

Associated data