. 2024 Dec;30(6):212.
doi: 10.3892/mmr.2024.13336. Epub 2024 Sep 27.

Causal association between metabolites and upper gastrointestinal tumors: A Mendelian randomization study

Affiliations

Causal association between metabolites and upper gastrointestinal tumors: A Mendelian randomization study

Pengkhun Nov et al. Mol Med Rep. 2024 Dec.

Abstract

Upper gastrointestinal (UGI) tumors, notably gastric cancer (GC) and esophageal cancer (EC), are significant global health concerns due to their high morbidity and mortality rates. However, only a limited number of metabolites have been identified as biomarkers for these cancers. To explore the association between metabolites and UGI tumors, the present study conducted a comprehensive two‑sample Mendelian randomization (MR) analysis using publicly available genetic data. In the present study, the causal relationships were examined between 1,400 metabolites and UGI cancer using methods such as inverse variance weighting and weighted medians, along with sensitivity analyses for heterogeneity and pleiotropy. Functional experiments were conducted to validate the MR results. The analysis identified 57 metabolites associated with EC and 58 with GC. Key metabolites included fructosyllysine [EC: Odds ratio (OR)=1.450, 95% confidence interval (CI)=1.087‑1.934, P=0.011; GC: OR=1.728, 95% CI=1.202‑2.483, P=0.003], 2'‑deoxyuridine to cytidine ratio (EC: OR=1.464, 95% CI=1.111‑1.929, P=0.007; GC: OR=1.464, 95% CI=1.094‑1.957, P=0.010) and carnitine to protonylcarnitine (C3) ratio (EC: OR=0.655, 95% CI=0.499‑0.861, P=0.002; GC: OR=0.664, 95% CI=0.486‑0.906, P=0.010). Notably, fructosyllysine levels and the 2'‑deoxyuridine to cytidine ratio were identified as risk factors for both EC and GC, while the C3 ratio served as a protective factor. Functional experiments demonstrated that fructosyllysine and the 2'‑deoxyuridine to cytidine ratio promoted the proliferation of EC and GC cells, whereas carnitine inhibited their proliferation. In conclusion, the present findings provide insights into the causal factors and biomarkers associated with UGI tumors, which may be instrumental in guiding targeted dietary and pharmacological interventions, thereby contributing to the prevention and treatment of UGI cancer.

Keywords: Mendelian randomization; UK Biobank; esophageal cancer; gastric cancer; metabolites.


Conflict of interest statement

The authors declare that they have no competing interests.

Figures
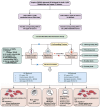
Figure 1.
Figure 1.
Study design flowchart. The first assumption was that the IVs were strongly related to the exposure. The second assumption specified that the IVs are not associated with any confounders. The third assumption established that the IVs influence the outcome solely through exposure. IVs, instrumental variables; GWAS, Genome-Wide Association Study; SNPs, single nucleotide polymorphisms; MR, Mendelian randomization; PRESSO, pleiotropy residual sum and outlier; GI, gastrointestinal; EC, esophageal cancer; GC, gastric cancer.
Figure 2.
Figure 2.
Causal estimation between metabolites and esophageal cancer. Inverse variance weighted was selected as a primary method. P<0.05 was considered to indicate a statistically significant difference. OR>1 indicated a risk factor, while OR<1 signified a protective factor. OR, odds ratio.
Figure 3.
Figure 3.
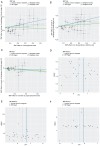
Scatter plot demonstrating the genetic associations of three metabolites with the risk of EC. (A) Fructosyllysine levels in EC. (B) 2′-Deoxyuridine to cytidine ratio in EC. (C) Carnitine to protonylcarnitine ratio in EC. The funnel plot represents instrumental variables for each significant causal relation between metabolites and EC. (D) Fructosyllysine levels, (E) 2′-deoxyuridine to cytidine ratio in EC and (F) carnitine to protonylcarnitine ratio in EC. EC, esophageal cancer; MR, Mendelian randomization; SNPs, single nucleotide polymorphisms.
Figure 4.
Figure 4.
Leave-one-out plot demonstrating the genetic associations of three metabolites with the risk of EC. (A) Fructosyllysine levels, (B) 2′-Deoxyuridine to cytidine ratio and (C) Carnitine to protonylcarnitine ratio in EC. EC, esophageal cancer; MR, Mendelian randomization.
Figure 5.
Figure 5.
Causal estimation between metabolites and gastric cancer. Inverse variance weighted was selected as a primary method. P<0.05 was considered to indicate a statistically significant difference. OR>1 indicated a risk factor, while OR<1 signified a protective factor. OR, odds ratio; MR, Mendelian randomization.
Figure 6.
Figure 6.
Scatter plot demonstrating the genetic associations of three metabolites with the risk of GC. (A) Fructosyllysine levels, (B) 2′-Deoxyuridine to cytidine ratio and (C) Carnitine to protonylcarnitine ratio in GC. Funnel plot representing instrumental variables for each significant causal association between metabolites and GC. (D) Fructosyllysine levels, (E) 2′-Deoxyuridine to cytidine ratio and (F) Carnitine to protonylcarnitine ratio in GC. GC, gastric cancer; EC, esophageal cancer.
Figure 7.
Figure 7.
Leave-one-out plot demonstrating the genetic associations of three metabolites with the risk of GC. (A) Fructosyllysine levels, (B) 2′-Deoxyuridine to cytidine ratio and (C) Carnitine to protonylcarnitine ratio in GC. GC, gastric cancer; MR, Mendelian randomization.
Figure 8.
Figure 8.
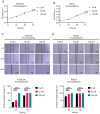
Fructosyllysine promotes the proliferation and migration of both EC (KYSE150) and GC (HGC27) cell lines. (A) CCK-8 assay measured the effect of fructosyllysine on the proliferation of KYSE150 cells. (B) CCK-8 assay measured the effect of fructosyllysine on the proliferation of HGC27 cells. Cells were divided into three groups and treated with various concentrations of fructosyllysine (0, 50 and 100 µM). The absorbance values of cells at different time points (0, 24 and 48 h) were measured by CCK-8 assay and the proliferation of cells was evaluated by graphs. (C) Scratch assay determined the influence of fructosyllysine on the migration of KYSE150 cells. (D) Scratch assay determined the influence of fructosyllysine on the migration of HGC27 cells. scale bars, 200 µM. Magnification, ×40. KYSE150 and HGC27 cells were treated with different concentrations of fructosyllysine for 24 and 48 h and the scratch area at different time points was calculated to evaluate the migration ability of the cells. All experiments were repeated three times and the results were expressed as the mean ± SD. ns, no significant difference vs. control. *P<0.05, **P<0.01, ****P<0.001 vs. control. EC, esophageal cancer; GC, gastric cancer; CCK-8, Cell Counting Kit-8.
Figure 9.
Figure 9.
The 2′-deoxyuridine promotes the proliferation and migration of both EC (KYSE150) and GC (HGC27) cell lines. (A) CCK-8 assay measured the effect of 2′-deoxyuridine on the proliferation of KYSE150 cells. (B) CCK-8 assay measured the effect of 2′-deoxyuridine on the proliferation of HGC27 cells. Cells were divided into three groups and treated with various concentrations of 2′-deoxyuridine (0, 50 and 100 µM). The absorbance values of cells at different time points (0, 24 and 48 h) were measured by CCK-8 assay and the proliferation of cells was evaluated by graphing. (C) Scratch assay determined the influence of 2′-deoxyuridine on the migration of KYSE150 cells. (D) Scratch assay determined the influence of 2′-deoxyuridine on the migration of HGC27 cells. scale bars, 200 µM. Magnification, ×40. KYSE150 and HGC27 cells were treated with different concentrations of 2′-deoxyuridine for 24 and 48 h and the scratch area at different time points was calculated to evaluate the migration ability of the cells. All experiments were repeated three times and the results were expressed as the mean ± SD. ns, no significant difference vs. control. *P<0.05, ***P<0.005, ****P<0.001 vs. control. EC, esophageal cancer; GC, gastric cancer; CCK-8, Cell Counting Kit-8.
Figure 10.
Figure 10.
Cytidine inhibits the proliferation and migration of both EC (KYSE150 cell) and GC (HGC27 cell) cell lines. (A) CCK-8 assay measured the effect of cytidine on the proliferation of KYSE150 cells. (B) CCK-8 assay measured the effect of cytidine on the proliferation of HGC27 cells. Cells were divided into three groups and treated with various concentrations of cytidine (0, 50 and 100 µM). The absorbance values of cells at different time points (0, 24 and 48 h) were measured by CCK-8 assay and the proliferation of cells was evaluated by graphing. (C) Scratch assay determined the influence of cytidine on the migration of KYSE150 cells. (D) Scratch assay determined the influence of cytidine on the migration of HGC27 cells. scale bars, 200 µM. Magnification, ×40. KYSE150 and HGC27 cells were treated with different concentrations of cytidine for 24 and 48 h and the scratch area at different time points was calculated to evaluate the migration ability of the cells. All experiments were repeated 3 times and the results were expressed as the mean ± SD. ns, no significant difference vs. control. *P<0.05, **P<0.01, ***P<0.005 vs. control. EC, esophageal cancer; GC, gastric cancer; CCK-8, Cell Counting Kit-8.
Figure 11.
Figure 11.
Carnitine inhibits the proliferation and migration of both EC (KYSE150) and GC (HGC27) cell lines. (A) CCK-8 assay measured the effect of carnitine on the proliferation of KYSE150 cells. (B) CCK-8 assay measured the effect of carnitine on the proliferation of HGC27 cells. Cells were divided into three groups and treated with various concentrations of carnitine (0, 50 and 100 µM). The absorbance values of cells at different time points (0, 24 and 48 h) were measured by CCK-8 assay and the proliferation of cells was evaluated by graphing. (C) Scratch assay determined the influence of carnitine on the migration of KYSE150 cells. (D) Scratch assay determined the influence of carnitine on the migration of HGC27 cells. scale bars, 200 µM. Magnification, ×40. KYSE150 and HGC27 cells were treated with different concentrations of carnitine for 24 and 48 h and the scratch area at different time points was calculated to evaluate the migration ability of the cells. All experiments were repeated 3 times and the results were expressed as the mean ± SD. ns, no significant difference vs. control. *P<0.05, **P<0.01, ***P<0.005, ****P<0.001 vs. control. EC, esophageal cancer; GC, gastric cancer; CCK-8, Cell Counting Kit-8.

References

    1. Bray F, Laversanne M, Sung H, Ferlay J, Siegel RL, Soerjomataram I, Jemal A. Global cancer statistics 2022: GLOBOCAN estimates of incidence and mortality worldwide for 36 cancers in 185 countries. CA Cancer J Clin. 2024;74:229–263. doi: 10.3322/caac.21834. - DOI - PubMed
    1. Zong L, Abe M, Seto Y, Ji J. The challenge of screening for early gastric cancer in China. Lancet. 2016;388:2606. doi: 10.1016/S0140-6736(16)32226-7. - DOI - PubMed
    1. Sung H, Ferlay J, Siegel RL, Laversanne M, Soerjomataram I, Jemal A, Bray F. Global cancer statistics 2020: GLOBOCAN estimates of incidence and mortality worldwide for 36 cancers in 185 countries. CA Cancer J Clin. 2021;71:209–249. doi: 10.3322/caac.21660. - DOI - PubMed
    1. Huang S, Guo Y, Li Z, Zhang Y, Zhou T, You W, Pan K, Li W. A systematic review of metabolomic profiling of gastric cancer and esophageal cancer. Cancer Biol Med. 2020;17:181–198. doi: 10.20892/j.issn.2095-3941.2019.0348. - DOI - PMC - PubMed
    1. Abbassi-Ghadi N, Kumar S, Huang J, Goldin R, Takats Z, Hanna GB. Metabolomic profiling of oesophago-gastric cancer: A systematic review. Eur J Cancer. 2013;49:3625–3637. doi: 10.1016/j.ejca.2013.07.004. - DOI - PubMed

MeSH terms

Substances