Lack variation of low slow-wave activity over time in the frontal region in NREM sleep may be associated with dyskinesia in Parkinson's disease
- PMID: 39370848
- PMCID: PMC11456717
- DOI: 10.1111/cns.70058
Lack variation of low slow-wave activity over time in the frontal region in NREM sleep may be associated with dyskinesia in Parkinson's disease
Abstract
Objective: Levodopa-induced dyskinesia (DYS) adversely affects the quality of life of Parkinson's disease (PD) patients. However, few studies have focused on the relationship between DYS and sleep and electroencephalography (EEG). Our study aimed to establish the objective physiological indicators assessed by polysomnography (PSG) that are associated with DYS in PD patients.
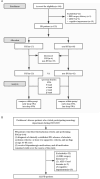
Methods: We enrolled 122 patients with PD, divided into two groups: PD with DYS (n = 27) and PD without DYS group (non-DYS, n = 95). The demographics and clinical characteristics and sleep assessment in the two groups were collected. More importantly, overnight six-channel PSG parameters were compared in the two groups. We also compared different bands and brain regions of average power spectral density within each group.
Results: Compared with the non-DYS group, the DYS group tended to have a significantly higher percentage of nonrapid eye movement sleep (NREM). Gender, levodopa equivalent daily dose (LEDD), rapid eye movement (REM) sleep (min), and the NREM percentage were positively correlated with the occurrence of DYS. After adjusting for gender, disease duration, LEDD, taking amantadine or not, and Montreal Cognitive Assessment (MoCA), NREM%, N3%, and REM (min), the percentage of NREM sleep (p = 0.035), female (p = 0.002), and LEDD (p = 0.005), and REM sleep time (min) (p = 0.012) were still associated with DYS. There was no significant difference in whole-night different bands of average power spectral density between two groups. There was no significant difference in normalized average power spectral density of slow wave activity (SWA) (0.5-2 Hz, 0.5-4 Hz, and 2-4 Hz) of early and late NREM sleep in the DYS group. Dynamic normalized average power spectral density of SWA of low-frequency (0.5-2 Hz) reduction in the frontal region (p = 0.013) was associated with DYS in logistic regression after adjusting for confounding factors.
Conclusion: PD patients with DYS have substantial sleep structure variations. Higher NREM percentage and less REM percentage were observed in PD patients with DYS. Dynamic normalized average power spectral density of low-frequency (0.5-2 Hz) SWA reduction in the frontal area could be a new electrophysiological marker of DYS in PD.
Keywords: EEG spectral density; dyskinesia; parkinson's disease; polysomnography; slow wave activity.
© 2024 The Author(s). CNS Neuroscience & Therapeutics published by John Wiley & Sons Ltd.
Conflict of interest statement
No potential conflicts of interest relevant to this article were reported.
Figures


References
-
- Hirsch EC, Jenner P, Przedborski S. Pathogenesis of Parkinson's disease. Mov Disord. 2013;28(1):24‐30. - PubMed
-
- LeWitt PA. Levodopa therapy for Parkinson's disease: pharmacokinetics and pharmacodynamics. Mov Disord. 2015;30(1):64‐72. - PubMed
-
- Fabbrini G, Brotchie JM, Grandas F, Nomoto M, Goetz CG. Levodopa‐induced dyskinesias. Mov Disord. 2007;22(10):1379‐1389. - PubMed
-
- Huang YX, Luo WF, Li D, et al. CSC counteracts l‐DOPA‐induced overactivity of the corticostriatal synaptic ultrastructure and function in 6‐OHDA‐lesioned rats. Brain Res. 2011;1376:113‐121. - PubMed
-
- Rajan R, Popa T, Quartarone A, Ghilardi MF, Kishore A. Cortical plasticity and levodopa‐induced dyskinesias in Parkinson's disease: connecting the dots in a multicomponent network. Clin Neurophysiol. 2017;128(6):992‐999. - PubMed
Publication types
MeSH terms
Substances
Grants and funding
- 2023XAGG0073/Xiongan New Area Science and Technology Innovation Project
- SZS2023015/Suzhou Key Laboratory of Sleep Disorders Diagnosis and Treatment Technology(SZS2023015)
- Priority Academic Program Development of Jiangsu Higher Education Institutions
- 82071420/National Natural Science Foundation of China
- 82271279/National Natural Science Foundation of China
LinkOut - more resources
Full Text Sources
Medical

