

Exploring the dynamics and interactions of the N-myc transactivation domain through solution nuclear magnetic resonance spectroscopy
- PMID: 39370942
- PMCID: PMC11555651
- DOI: 10.1042/BCJ20240248
Exploring the dynamics and interactions of the N-myc transactivation domain through solution nuclear magnetic resonance spectroscopy
Abstract
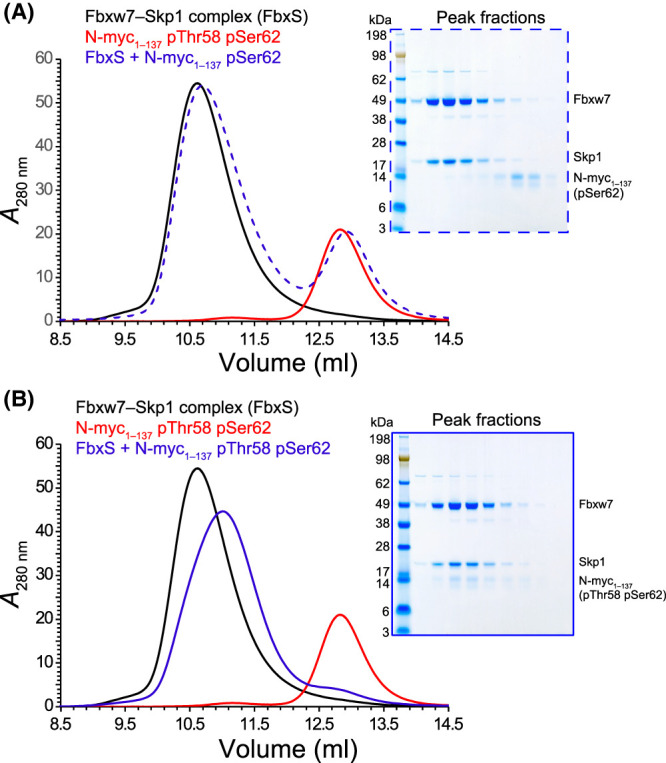
Myc proteins are transcription factors crucial for cell proliferation. They have a C-terminal domain that mediates Max and DNA binding, and an N-terminal disordered region culminating in the transactivation domain (TAD). The TAD participates in many protein-protein interactions, notably with kinases that promote stability (Aurora-A) or degradation (ERK1, GSK3) via the ubiquitin-proteasome system. We probed the structure, dynamics and interactions of N-myc TAD using nuclear magnetic resonance (NMR) spectroscopy following its complete backbone assignment. Chemical shift analysis revealed that N-myc has two regions with clear helical propensity: Trp77-Glu86 and Ala122-Glu132. These regions also have more restricted ps-ns motions than the rest of the TAD, and, along with the phosphodegron, have comparatively high transverse (R2) 15N relaxation rates, indicative of slower timescale dynamics and/or chemical exchange. Collectively these features suggest differential propensities for structure and interaction, either internal or with binding partners, across the TAD. Solution studies on the interaction between N-myc and Aurora-A revealed a previously uncharacterised binding site. The specificity and kinetics of sequential phosphorylation of N-myc by ERK1 and GSK3 were characterised using NMR and resulted in no significant structural changes outside the phosphodegron. When the phosphodegron was doubly phosphorylated, N-myc formed a robust interaction with the Fbxw7-Skp1 complex, but mapping the interaction by NMR suggests a more extensive interface. Our study provides foundational insights into N-myc TAD dynamics and a backbone assignment that will underpin future work on the structure, dynamics, interactions and regulatory post-translational modifications of this key oncoprotein.
Keywords: NMR spectroscopy; intrinsically disordered proteins; myc; neuroblastoma; phosphorylation/dephosphorylation; protein–protein interactions.
© 2024 The Author(s).
Conflict of interest statement
The authors declare that there are no competing interests associated with the manuscript.
Figures


Similar articles
-
Transient structure and dynamics in the disordered c-Myc transactivation domain affect Bin1 binding.Nucleic Acids Res. 2012 Jul;40(13):6353-66. doi: 10.1093/nar/gks263. Epub 2012 Mar 28. Nucleic Acids Res. 2012. PMID: 22457068 Free PMC article.
-
N and C-terminal sub-regions in the c-Myc transactivation region and their joint role in creating versatility in folding and binding.J Mol Biol. 2005 Feb 11;346(1):175-89. doi: 10.1016/j.jmb.2004.11.029. Epub 2004 Dec 10. J Mol Biol. 2005. PMID: 15663936
-
MYC interacts with the human STAGA coactivator complex via multivalent contacts with the GCN5 and TRRAP subunits.Biochim Biophys Acta. 2014 May;1839(5):395-405. doi: 10.1016/j.bbagrm.2014.03.017. Epub 2014 Apr 3. Biochim Biophys Acta. 2014. PMID: 24705139 Free PMC article.
-
A moving target: structure and disorder in pursuit of Myc inhibitors.Biochem Soc Trans. 2017 Jun 15;45(3):709-717. doi: 10.1042/BST20160328. Biochem Soc Trans. 2017. PMID: 28620032 Review.
-
New Myc-interacting proteins: a second Myc network emerges.Oncogene. 1999 May 13;18(19):2942-54. doi: 10.1038/sj.onc.1202725. Oncogene. 1999. PMID: 10378691 Review.
Cited by
-
Aurora A binds to the transactivation domain of c-Myc and recognizes the phosphorylated N-terminal degron motif.Biochem J. 2025 Mar 28;482(8):369-81. doi: 10.1042/BCJ20240726. Online ahead of print. Biochem J. 2025. PMID: 40178520 Free PMC article.
-
BaNDyT: Bayesian Network modeling of molecular Dynamics Trajectories.bioRxiv [Preprint]. 2024 Nov 8:2024.11.06.622318. doi: 10.1101/2024.11.06.622318. bioRxiv. 2024. Update in: J Chem Inf Model. 2025 Feb 10;65(3):1278-1288. doi: 10.1021/acs.jcim.4c01981. PMID: 39574638 Free PMC article. Updated. Preprint.
References
-
- Rickman, D.S., Schulte, J.H. and Eilers, M. (2018) The expanding world of N-MYC–driven tumors. Cancer Discov. 8, 150–163 10.1158/2159-8290.CD-17-0273 - DOI - PubMed
Publication types
MeSH terms
Substances
Grants and funding
LinkOut - more resources
Full Text Sources
Miscellaneous