

This is a preprint.
A pilot study to identify blood-based markers associated with response to treatment with Vedolizumab in patients with Inflammatory Bowel Disease
- PMID: 39371119
- PMCID: PMC11451768
- DOI: 10.1101/2024.09.19.24314034
A pilot study to identify blood-based markers associated with response to treatment with Vedolizumab in patients with Inflammatory Bowel Disease
Update in
-
Serum proteomic and metabolomic analyses from patients with IBD identify biological pathways associated with treatment success with anti-integrin therapy.Immunol Cell Biol. 2025 Aug;103(7):648-663. doi: 10.1111/imcb.70039. Epub 2025 Jun 12. Immunol Cell Biol. 2025. PMID: 40509637 Free PMC article.
Abstract
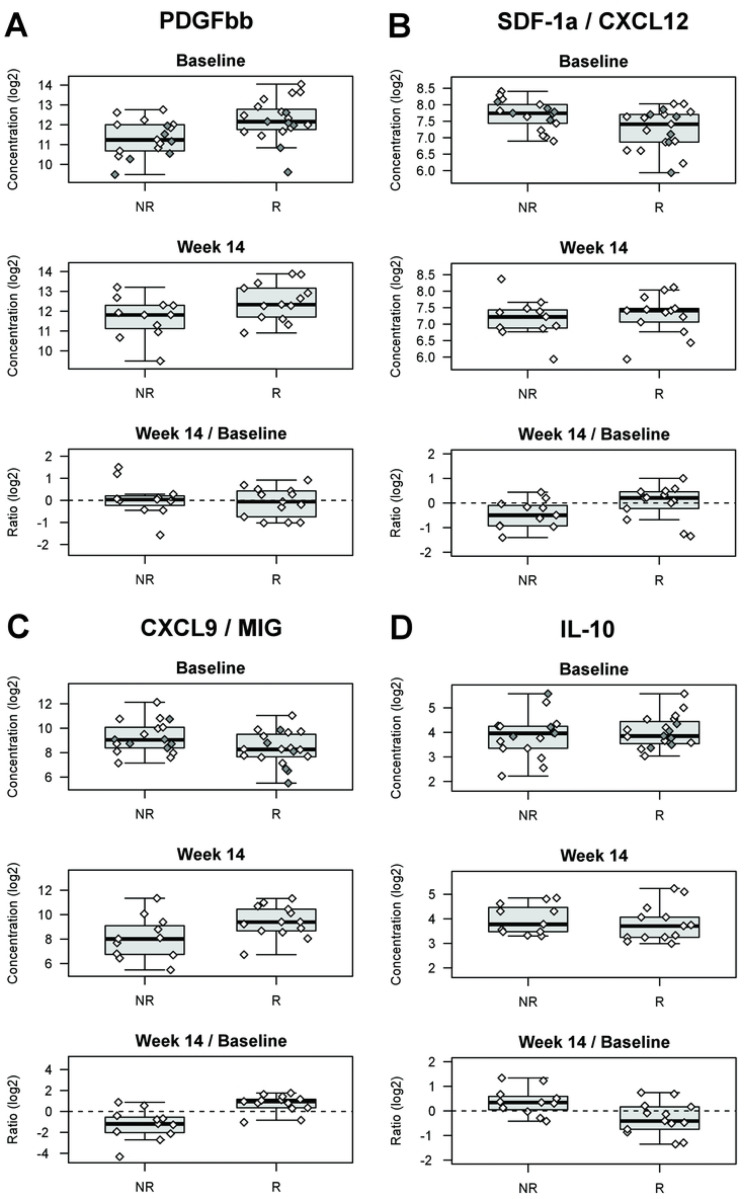
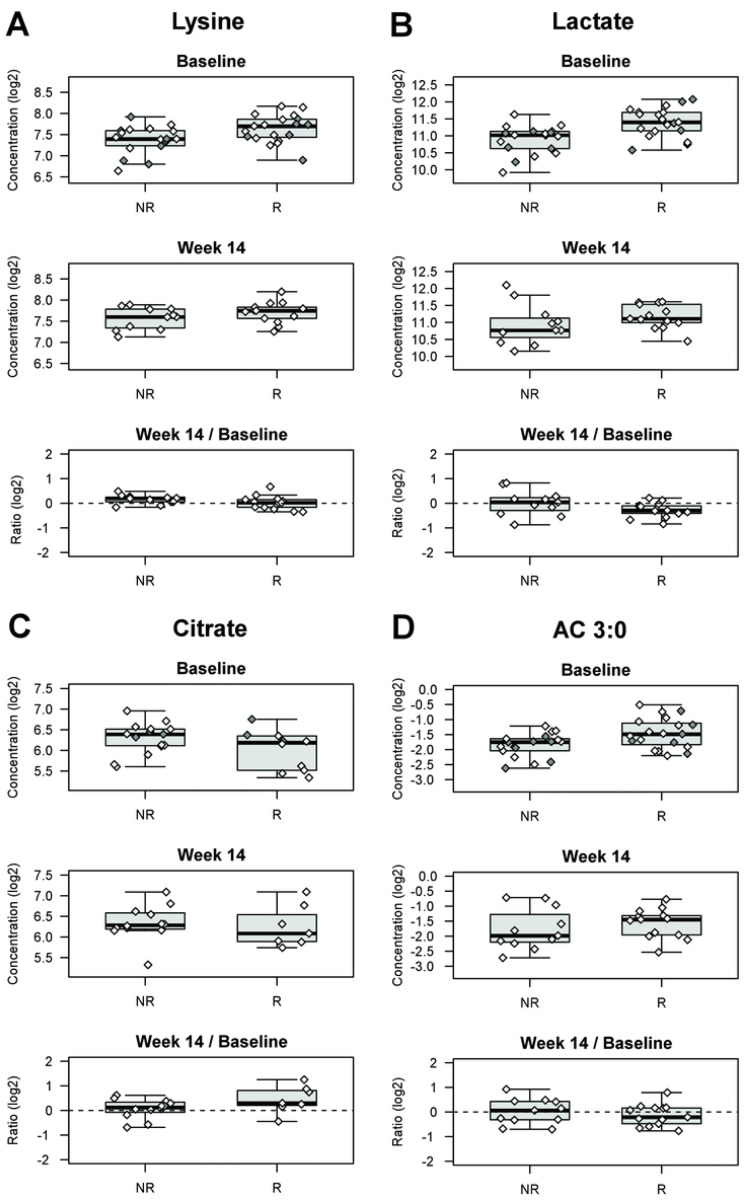
The inflammatory bowel diseases (IBD) known as Crohn's disease (CD) and ulcerative colitis (UC) are chronic inflammatory diseases of the gastrointestinal tract believed to arise because of an imbalance between the epithelial, immune and microbial systems. It has been shown that biological differences (genetic, epigenetic, microbial, environmental, etc.) exist between patients with IBD, with multiple risk factors been associated with disease susceptibility and IBD-related phenotypes (e.g. disease location). It is also known that there is heterogeneity in terms of response to therapy in patients with IBD, including to biological therapies that target very specific biological pathways (e.g. TNF-alpha signaling, IL-23R signaling, immune cell trafficking, etc.). It is hypothesized that the better the match between the biology targeted by these advanced therapies and the predominant disease-associated pathways at play in each patient will favor a beneficial response. The aim of this pilot study was to identify potential biological differences associated with differential treatment response to the anti α4β7 integrin therapy known as Vedolizumab. Our approach was to measure a broad range of analytes in the serum of patients prior to initiation of therapy and at the first clinical assessment visit, to identify potential markers of biological differences between patients at baseline and to see which biomarkers are most affected by treatment in responders. Our focus on early clinical response was to study the most proximal effects of therapy and to minimize confounders such as loss of response that occurs further distal to treatment initiation. Specifically, we performed targeted analyses of >150 proteins and metabolites, and untargeted analyses of >1100 lipid entities, in serum samples from 92 IBD patients (42 CD, 50 UC) immediately prior to initiation of therapy with vedolizumab (baseline samples) and at their first clinical assessment (14-week samples). We found lower levels of SDF-1a, but higher levels of PDGF-ββ, lactate, lysine, phenylalanine, branched chain amino acids, alanine, short/medium chain acylcarnitines, and triglycerides containing myristic acid in baseline serum samples of responders as compared to non-responders. We also observed an increase in serum levels of CXCL9 and citrate, as well as a decrease in IL-10, between baseline and week 14 samples. In addition, we observed that a group of metabolites and protein analytes was strongly associated with both treatment response and BMI status, although BMI status was not associated with treatment response.
Keywords: biomarkers; crohn’s disease; treatment response; ulcerative colitis; vedolizumab.
Conflict of interest statement
COMPETING INTERESTS STATEMENT Authors have no potential conflicts (financial, professional, or personal) or competing interests relevant to the manuscript.
Figures

References
-
- Lichtenstein GR, Loftus EV, Isaacs KL, Regueiro MD, Gerson LB, Sands BE. ACG Clinical Guideline: Management of Crohn’s Disease in Adults. Am J Gastroenterol. 2018;113(4):481–517. - PubMed
-
- Rubin DT, Ananthakrishnan AN, Siegel CA, Sauer BG, Long MD. ACG Clinical Guideline: Ulcerative Colitis in Adults. Am J Gastroenterol. 2019;114(3):384–413. - PubMed
-
- Oliver J, Plant D, Webster AP, Barton A. Genetic and genomic markers of anti-TNF treatment response in rheumatoid arthritis. Biomark Med. 2015;9(6):499–512. - PubMed
Publication types
Grants and funding
LinkOut - more resources
Full Text Sources
Research Materials