

This is a preprint.
Fine-mapping a genome-wide meta-analysis of 98,374 migraine cases identifies 181 sets of candidate causal variants
- PMID: 39371129
- PMCID: PMC11451805
- DOI: 10.1101/2024.05.20.24307608
Fine-mapping a genome-wide meta-analysis of 98,374 migraine cases identifies 181 sets of candidate causal variants
Abstract
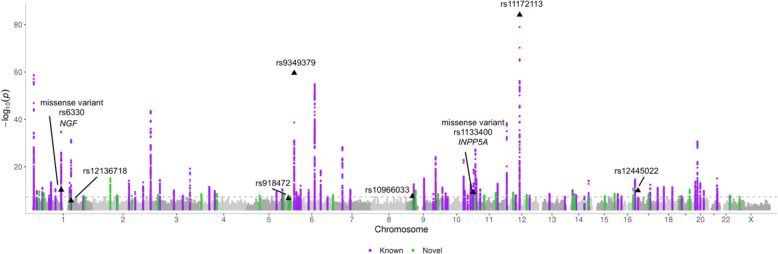
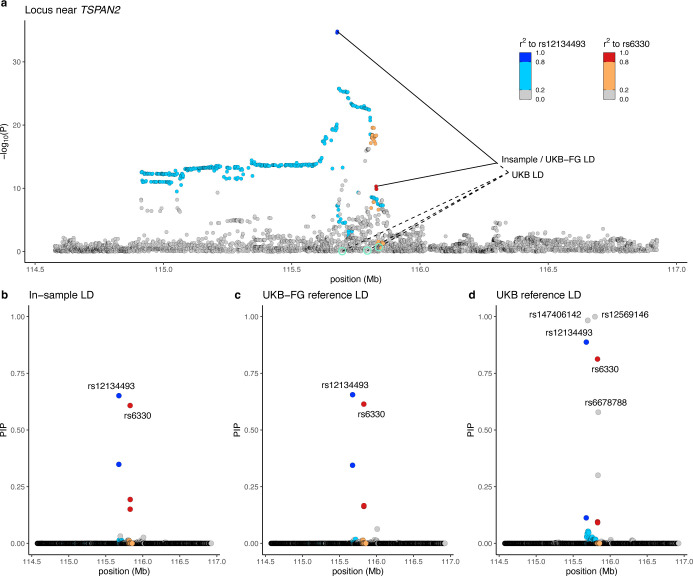
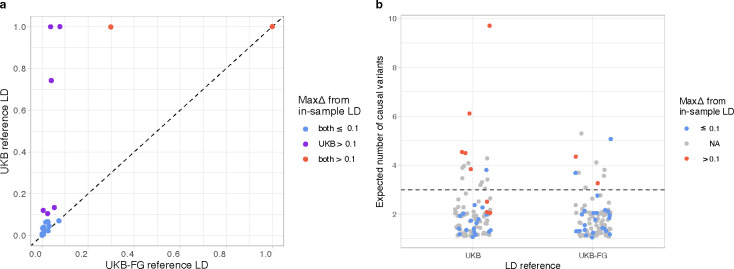
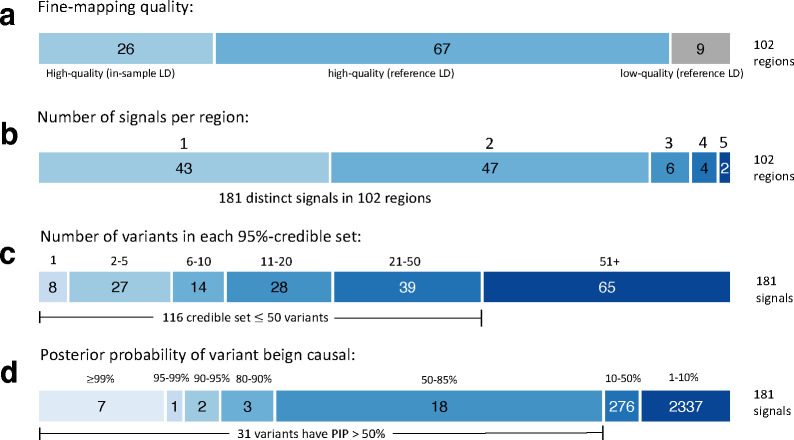
Migraine is a highly prevalent neurovascular disorder for which genome-wide association studies (GWAS) have identified over one hundred risk loci, yet the causal variants and genes remain mostly unknown. Here, we meta-analyzed three migraine GWAS including 98,374 cases and 869,160 controls and identified 122 independent risk loci of which 35 were new. Fine-mapping of a meta-analysis is challenging because some variants may be missing from some participating studies and accurate linkage disequilibrium (LD) information of the variants is often not available. Here, using the exact in-sample LD, we first investigated which statistics could reliably capture the quality of fine-mapping when only reference LD was available. We observed that the posterior expected number of causal variants best distinguished between the high- and low-quality results. Next, we performed fine-mapping for 102 autosomal risk regions using FINEMAP. We produced high-quality fine-mapping for 93 regions and defined 181 distinct credible sets. Among the high-quality credible sets were 7 variants with very high posterior inclusion probability (PIP > 0.9) and 2 missense variants with PIP > 0.5 (rs6330 in NGF and rs1133400 in INPP5A). For 35 association signals, we managed to narrow down the set of potential risk variants to at most 5 variants.
Conflict of interest statement
Competing interests A.P. is the Scientific Director of the public-private partnership project FinnGen that has 12 industry partners that provide funding for the FinnGen project. Other authors report no conflicts of interests.
Figures
Similar articles
-
Improving the coverage of credible sets in Bayesian genetic fine-mapping.PLoS Comput Biol. 2020 Apr 13;16(4):e1007829. doi: 10.1371/journal.pcbi.1007829. eCollection 2020 Apr. PLoS Comput Biol. 2020. PMID: 32282791 Free PMC article.
-
Fine-Mapping the Results From Genome-Wide Association Studies of Primary Biliary Cholangitis Using SuSiE and h2-D2.Genet Epidemiol. 2025 Jan;49(1):e22592. doi: 10.1002/gepi.22592. Epub 2024 Oct 6. Genet Epidemiol. 2025. PMID: 39370608 Free PMC article.
-
Fine-mapping across diverse ancestries drives the discovery of putative causal variants underlying human complex traits and diseases.medRxiv [Preprint]. 2023 Jul 9:2023.01.07.23284293. doi: 10.1101/2023.01.07.23284293. medRxiv. 2023. Update in: Nat Genet. 2024 Sep;56(9):1841-1850. doi: 10.1038/s41588-024-01870-z. PMID: 36711496 Free PMC article. Updated. Preprint.
-
Integration of expression QTLs with fine mapping via SuSiE.PLoS Genet. 2024 Jan 25;20(1):e1010929. doi: 10.1371/journal.pgen.1010929. eCollection 2024 Jan. PLoS Genet. 2024. PMID: 38271473 Free PMC article.
-
From genome-wide associations to candidate causal variants by statistical fine-mapping.Nat Rev Genet. 2018 Aug;19(8):491-504. doi: 10.1038/s41576-018-0016-z. Nat Rev Genet. 2018. PMID: 29844615 Free PMC article. Review.
References
-
- IHS H.C.C.o.t.I.H.S. Headache Classification Committee of the International Headache Society (IHS) The International Classification of Headache Disorders, 3rd edition. Cephalalgia 38, 1–211 (2018). - PubMed
-
- Gervil M., Ulrich V., Kaprio J., Olesen J. & Russell M.B. The relative role of genetic and environmental factors in migraine without aura. Neurology 53, 995–999 (1999). - PubMed
Publication types
LinkOut - more resources
Full Text Sources
Research Materials