[Preprint]. 2024 Sep 18:2024.09.17.24313718.
doi: 10.1101/2024.09.17.24313718.

Exome wide association study for blood lipids in 1,158,017 individuals from diverse populations

Affiliations

Exome wide association study for blood lipids in 1,158,017 individuals from diverse populations

Satoshi Koyama et al. medRxiv. .

Abstract

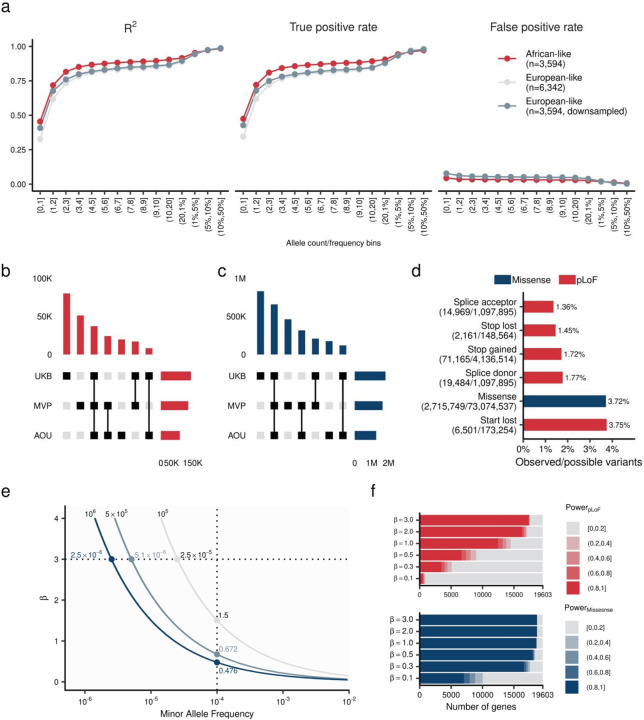
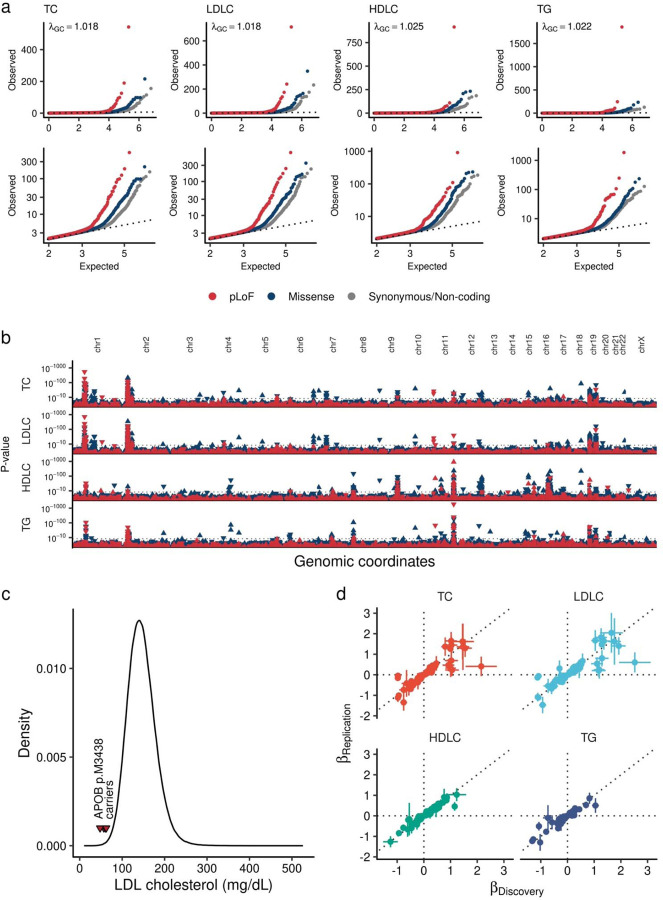
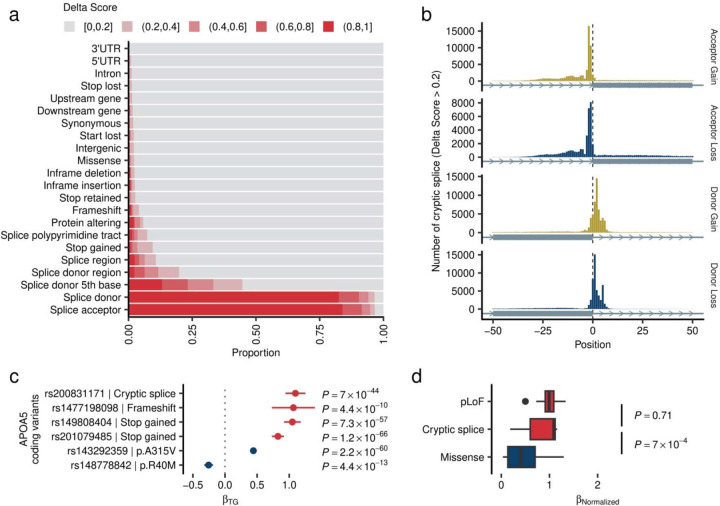
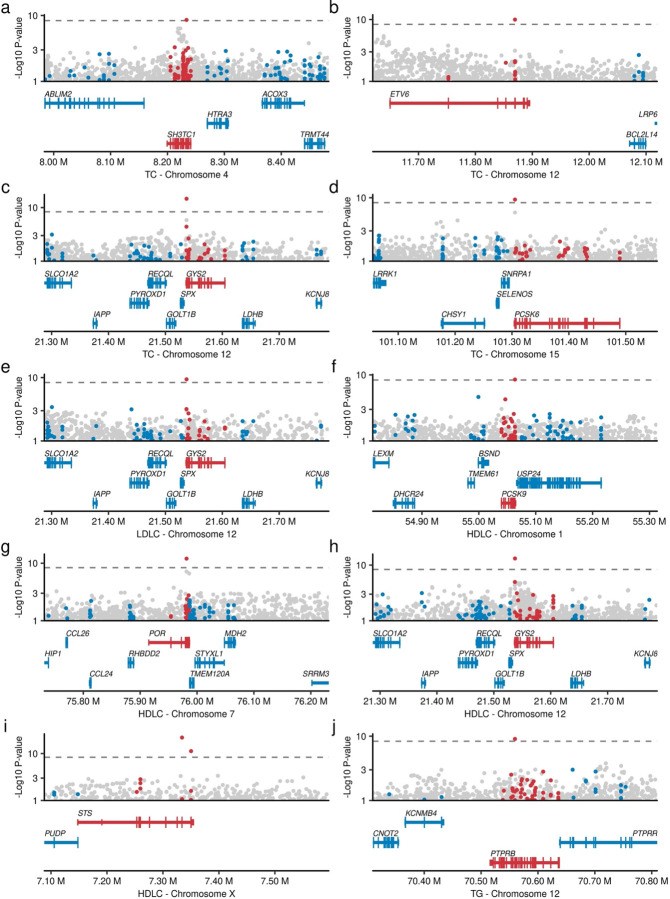
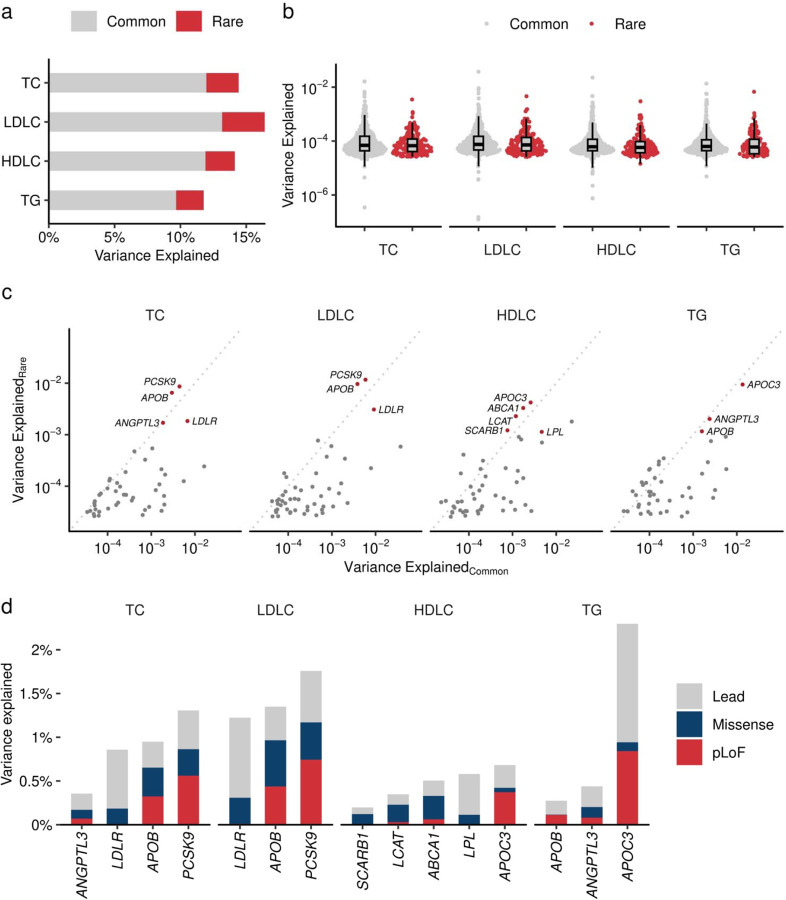
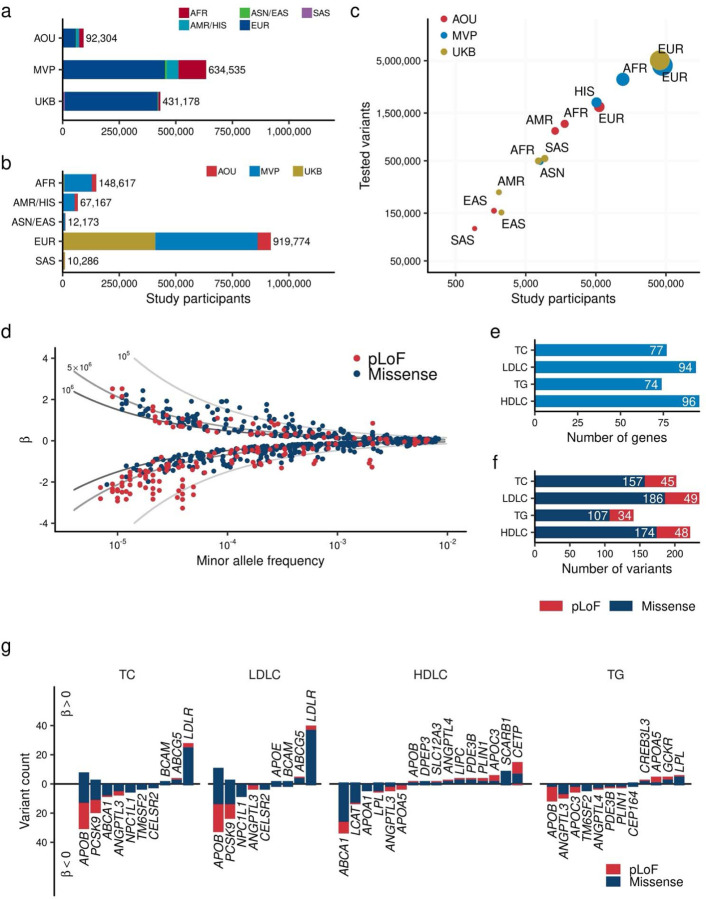
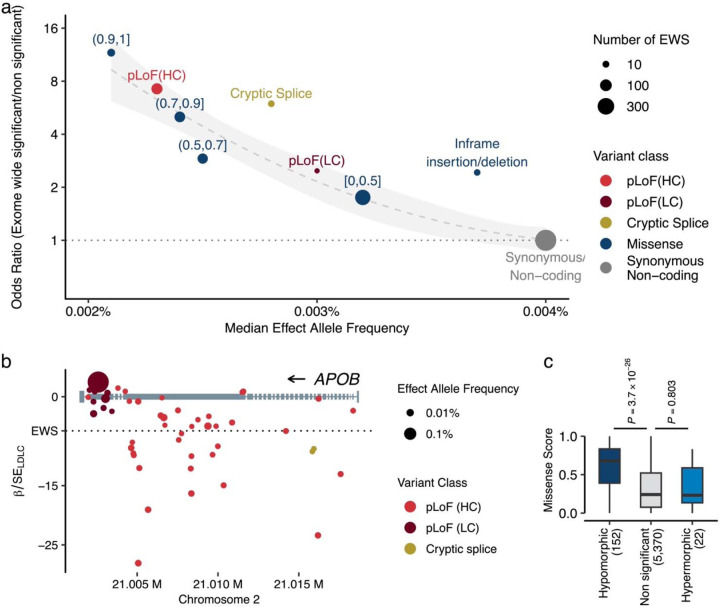
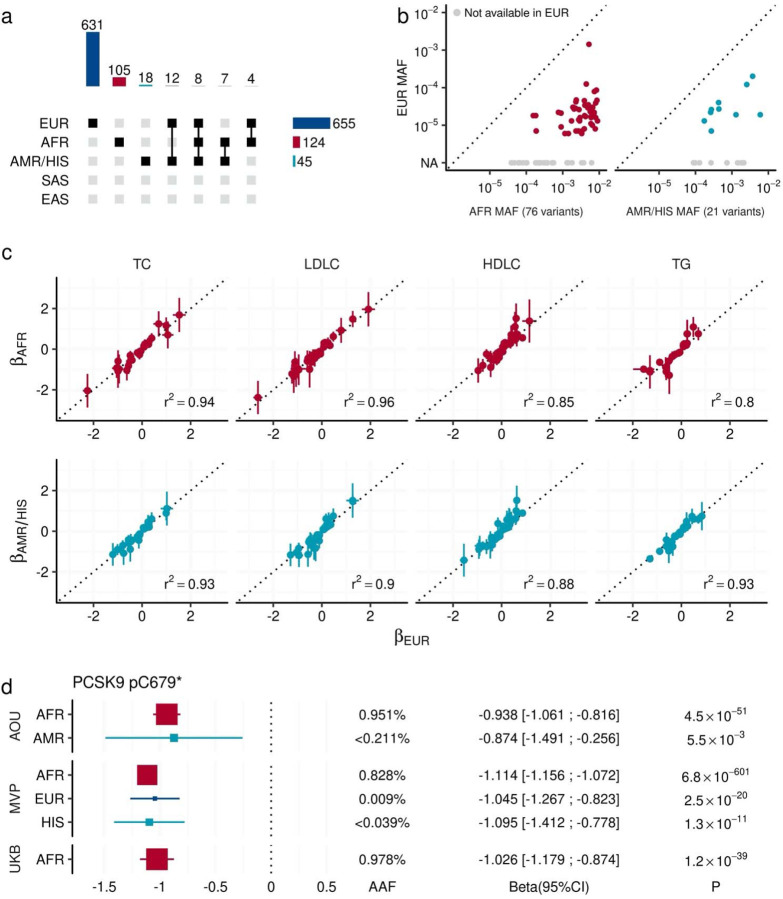
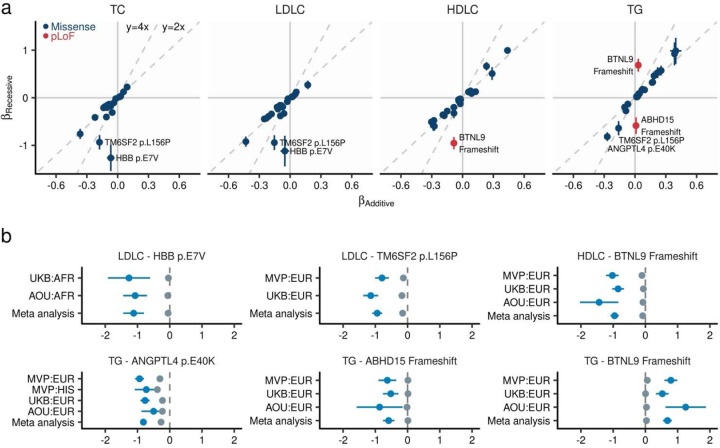
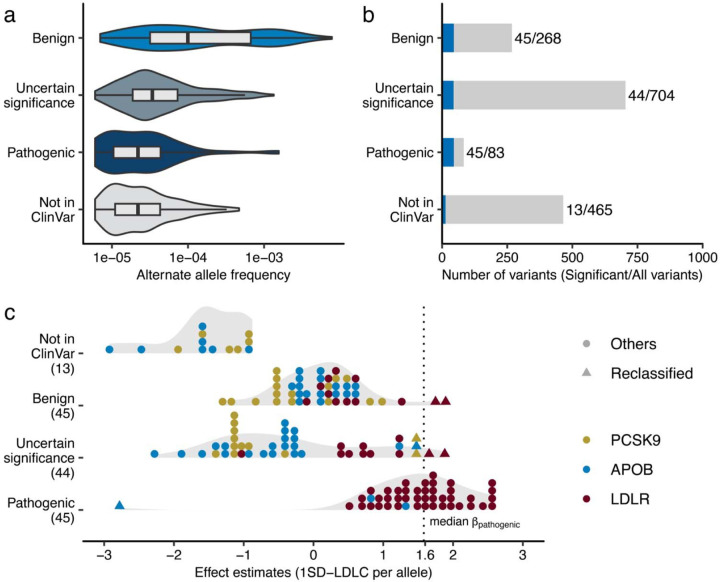
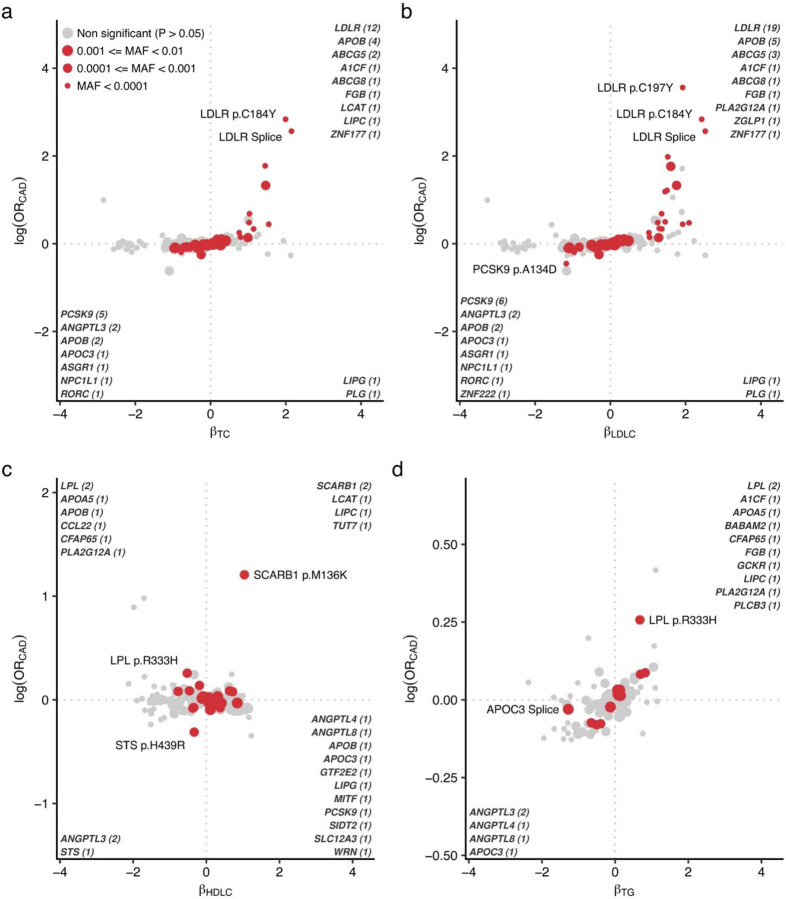
Rare coding alleles play crucial roles in the molecular diagnosis of genetic diseases. However, the systemic identification of these alleles has been challenging due to their scarcity in the general population. Here, we discovered and characterized rare coding alleles contributing to genetic dyslipidemia, a principal risk for coronary artery disease, among over a million individuals combining three large contemporary genetic datasets (the Million Veteran Program, n = 634,535, UK Biobank, n = 431,178, and the All of Us Research Program, n = 92,304) totaling 1,158,017 multi-ancestral individuals. Unlike previous rare variant studies in lipids, this study included 238,243 individuals (20.6%) from non-European-like populations. Testing 2,997,401 rare coding variants from diverse backgrounds, we identified 800 exome-wide significant associations across 209 genes including 176 predicted loss of function and 624 missense variants. Among these exome-wide associations, 130 associations were driven by non-European-like populations. Associated alleles are highly enriched in functional variant classes, showed significant additive and recessive associations, exhibited similar effects across populations, and resolved pathogenicity for variants enriched in African or South-Asian populations. Furthermore, we identified 5 lipid-related genes associated with coronary artery disease (RORC, CFAP65, GTF2E2, PLCB3, and ZNF117). Among them, RORC is a potentially novel therapeutic target through the down regulation of LDLC by its silencing. This study provides resources and insights for understanding causal mechanisms, quantifying the expressivity of rare coding alleles, and identifying novel drug targets across diverse populations.


Conflict of interest statement

Competing interest declaration D.K. is a scientific advisor and reports consulting fees from Bitterroot Bio, Inc unrelated to the present work. P.N. reports research grants from Allelica, Amgen, Apple, Boston Scientific, Genentech / Roche, and Novartis, personal fees from Allelica, Apple, AstraZeneca, Blackstone Life Sciences, Creative Education Concepts, CRISPR Therapeutics, Eli Lilly & Co, Foresite Labs, Genentech / Roche, GV, HeartFlow, Magnet Biomedicine, Merck, and Novartis, scientific advisory board membership of Esperion Therapeutics, Preciseli, and TenSixteen Bio, scientific co-founder of TenSixteen Bio, equity in MyOme, Preciseli, and TenSixteen Bio, and spousal employment at Vertex Pharmaceuticals, all unrelated to the present work.

Figures

Extended Data Figure 1 |
Extended Data Figure 1 |. The imputation quality, allelic diversity, coverage, and power in the study
a. Imputation accuracy in MVP whole genome imputation date by TOPMed imputation reference panel. Each dot indicates mean R2 (Squared Pearson’s correlation coefficient), TPR, and FPR by population and MAC/MAF bins. TPR and FPR were computed by comparing dichotomized hard-called dosage (imputed data) and dichotomized sequenced genotype (WGS data, Supplementary Notes I). b and c. Shared and unique variants across MVP, UKB, and AOU for pLoF (b) and missense (c) variants. The central matrices define the variant sharing status between MVP, UKB, and AOU. The top panel quantifies the variants within the groups defined in the central matrices. The right panel summarizes the count of variants in each study. d. Variant coverage. The relative proportions of SNVs identified in this study is shown as a fraction of all possible SNVs within the target transcripts. f. Simulated power curves for different sample sizes. The horizontal axis indicates minor allele frequency, and the vertical axis indicates effect size. The dark blue line indicates 80% power curve at 1 million sample size, the intermediate curve indicates 500K sample size, and the gray curve indicates 100K sample size, respectively. e. Power curve for tested genes in this study. The curves indicate most powered pLoF/missense variants in each gene estimated by simulated effect size (β) and observed allele frequency. The color intensity corresponds with β. f. Gene based power estimation. The color of the bar charts indicates the highest power of the coding variant in the gene. The top panel shows pLoF variants and the bottom panel shows missense variants. β indicate simulated effect size. TPR, True Positive Rate; FPR, False Positive Rate; MAC, Minor Allele Count; MAF, Minor Allele Frequency; WGS, Whole Genome Sequence; MVP, Million Veteran Program; UKB, UK Biobank; TOPMed, Trans-Omics for Precision Medicine; AFR, African-like population; AMR, Admixed-American-like population; ASN, Asian-like population; EAS, East-Asian-like population; EUR, European-like population; HIS, Hispanic-like population; SAS, South-Asian-like population. pLoF, predicted Loss of Function.
Extended Data Figure 2 |
Extended Data Figure 2 |. Exome wide association analysis over a million individuals
a. Quantile-quantile plot. Upper panels are quantile-quantile plots for four tested lipid traits. Each dot indicates a tested variant. Colors indicate variant annotation. Dotted lines show expected distribution. Lower panel focused variants with expected P-value < 0.01. b. 184 exome wide significant loci. The horizontal axis shows genomic coordinates, and the vertical axis shows P-values. The red triangles indicate pLoF variant and blue indicate missense variant. The upward triangles indicate trait increasing associations, and downward triangles indicate trait decreasing associations. The P-values were calculated by linear mixed model with two-sided test. The P-values were not adjusted for multiple testing correction. c. Penetrant association of APOB p.M3438X. The curve indicates LDLC distribution of the European-like population in the UKB (N = 409,046). The red triangles indicate LDLC level of the carriers of APOB p.M3438X. d. Replication evidence in the independent study for associated variants. Each point represents rare-coding genetic variants that are significantly associated with blood lipids in this study. The horizontal axes display the effect sizes from this study (Discovery, NMAX = 1,057,837), while the vertical axes present the effect sizes from the previous exome-array study (Replication, NMAX = 358,251, Lu et al., Nat Genet 2017). The error bars represent the 95% confidence intervals in each study. TC, Total Cholesterol; LDLC, Low Density Lipoprotein Cholesterol; HDLC, High density lipoprotein cholesterol; TG, Triglycerides; GC; Genomic Control; pLoF, predicted Loss of Function; Chr, Chromosome.
Extended Data Figure 3 |
Extended Data Figure 3 |. Cryptic splice variants affect human blood lipids
a. Distribution of cryptic splice variants across canonical variant classes. The bar graphs illustrate the proportion of cryptic splice variants within the canonical annotations, with the colors of the bars indicating the Delta Score (DS). b. Distribution of cryptic splice variants around exon-intron boundary. The histogram shows the positions of cryptic splicing variants (DS > 0.8) in relation to the exon-intron boundary. Exons are represented by blue rectangles. c. Strong expressivity of APOA5 cryptic splice variant. Each dot indicates effect size of variant calculated by linear mixed model. The unit of effect size is a standard error of blood triglycerides. The error bar indicates 95% confidence interval of effect size. Red dots indicate pLoF variants and blue dots indicate missense variants. The P-values were calculated by linear mixed model with two-sided test. The P-values were not adjusted for multiple testing correction. d. Strong expressivity of Cryptic splice variants. The horizontal axis shows the normalized effect sizes for pLoF, pLoF (cryptic splice) and missense variants. The analysis was restricted to the genes both harboring pLoF, cryptic splice, and missense variants. Boxplot shows the median value as the centerline; box boundaries show the first and third quartiles and whiskers extending 1.5 times the interquartile range. The P-values were calculated by the Wilcoxon rank-sum test. The P-values were not adjusted for multiple testing correction. UTR, Untranslated Region; pLoF, predicted Loss of Function; TG, Triglycerides.
Extended Data Figure 4 |
Extended Data Figure 4 |. Novel loci driven by rare coding variants
The horizontal axes represent genomic coordinates, while the vertical axes denote the negative log10 P-values. Red dots illustrate the association of rare coding variants in genes with significant variants. In contrast, blue dots show the association of rare coding variants in genes without significant variants. Gray dots represent common variant associations from a previous study (Graham et al., Nature 2021). The dashed line in the upper panel indicates the exome-wide significance threshold (P < 4.4 × 10⁻⁹). The lower panel illustrates the coding genes within the locus; genes harboring significant variants are highlighted in red, and others are in blue. The P-values were calculated by linear mixed model with two-sided test. The P-values were not adjusted for multiple testing correction. TC, Total Cholesterol; LDLC, Low Density lipoprotein cholesterol; HDLC, High Density Lipoprotein Cholesterol; TG, Triglycerides.
Extended Data Figure 5 |
Extended Data Figure 5 |. Implicated causal genes in the established lipid associated loci
The horizontal axes represent genomic coordinates, while the vertical axes denote the negative log10 P-values for PDZK1 (a), SREBF1 (b), AR (c), and CREB3L1 (d). Red dots illustrate the association of rare coding variants in genes with significant variants. In contrast, blue dots show the association of rare coding variants in genes without significant variants. Gray dots represent common variant associations from a previous study (Graham et al., Nature 2021). The dashed line in the upper panel indicates the exome-wide significance threshold (P < 4.4 × 10⁻⁹). The lower panel illustrates the coding genes within the locus; genes harboring significant variants are highlighted in red, and others are in blue. The P-values were calculated by linear mixed model with two-sided test. The P-values were not adjusted for multiple testing correction. The LDLC, low-density lipoprotein cholesterol; HDLC, high-density lipoprotein cholesterol; MVP, Million Veteran Program; UKB, UK Biobank; AFR, African-like population; EUR, European-like population; HIS, Hispanic-like population.
Extended Data Figure 6 |
Extended Data Figure 6 |. Independence of common genetic signals and rare genetic signals
a. Each dot indicates common genetic variant (MAF ≥ 1%) associated with blood lipids within the loci identified by rare genetic associations in this study. We compare non-conditioned and conditioned statistics in this figure to assess the independence of common genetic signals and rare genetic signals. In conditioned analysis, we introduced all the associated rare variant genotypes as covariates in the linear regression model (Methods and Supplementary Notes V). The horizontal axes show -log10 P-values without conditioning and the vertical axes show them with conditioning by rare variant genotypes with EWS. The P-values were calculated by linear regression model with two-sided test. The P-values were not adjusted for multiple testing correction. b. The number of common genetic signals affected by rare genetic signals were summarized in the bar chart. The bar chart indicates number of common genetic signals, and the color classifies the signals based on the P-values of common genetic signals after conditioning by rare genetic signals. MVP, Million Veteran Program; UKB, UK Biobank; AFR, African-like population; AMR, Admixed-American-like population; ASN, Asian-like population; EAS, East-Asian-like population; EUR, European-like population; HIS, Hispanic-like population; SAS, South-Asian-like population; TC, Total Cholesterol; LDLC, Low Density Lipoprotein Cholesterol; HDLC, High Density Lipoprotein Cholesterol; TG, Triglycerides.
Extended Data Figure 7 |
Extended Data Figure 7 |. Enhanced enrichment of associated genes in the causal pathway
a. Pathway enrichment by common and rare genetic signals. Venn diagram showing significantly enriched pathways for gene sets based on common and rare variant associations. The gene set for common variants was defined by the nearest genes to the lead common variant (Graham et al., Nature 2021), while the gene set for rare variants was defined by the genes harboring exome-wide significant (EWS) associations in this study. b. Pairwise comparison of odds ratios for gene sets (n = 96) associated with both common and rare variants. The vertical axis shows the relative odds ratio (ORCommon/ORRare). The P-value was computed by paired Wilcoxson’s rank-sum test. Boxplot shows the median value as the centerline; box boundaries show the first and third quartiles and whiskers extending 1.5 times the interquartile range. c. Pathway enrichment analysis was performed on genes harboring rare coding variants associated with lipids and on genes closest to common variant associations with blood lipids. The top five enriched pathways for each trait are displayed. The horizontal axis denotes the odds ratio, with red bars indicating the odds ratios for the gene set with rare variants and blue bars for the gene set with common variants. GO, Gene Ontology; TC, Total Cholesterol; HDLC, High Density Lipoprotein Cholesterol; LDLC, Low Density Lipoprotein Cholesterol; TG, Triglycerides.
Extended Data Figure 8 |
Extended Data Figure 8 |. Limited discovery in non-European lipid associated alleles
This figure shows the proportion of the individuals with lipid associated alleles identified in this study. The colors of bar charts indicate allele counts of lipid associated alleles possessed by individuals. The percentages in the bars are showing the proportion of the individuals without lipid associated alleles in the population. MVP, Million Veteran Program; UKB, UK-Biobank; AFR, African-like population, AMR, Admixed-American-like population, HIS, Hispanic-like population, ASN, Asian-like population; EAS, East-Asian-like population; EUR, European-like population; SAS, South-Asian-like population.
Extended Data Figure 9 |
Extended Data Figure 9 |. Contribution of rare coding variants to trait variance
a. Phenotypic variance explained (PVE) by common and rare variants. The height of the bar chart indicates the PVE by GWAS lead variant (yellow) and the sum of rare coding variants in the locus (dark blue). PVE is computed by the formula 2f(1-f)β2, where f is the allele frequency and β is the effect size. b. PVE by individual variants. Grey dots indicate common (Grahan et al. Nature 2021) and red dots indicate rare (current study) variants. Boxplot shows the median value as the centerline; box boundaries show the first and third quartiles and whiskers extending 1.5 times the interquartile range. c. Trait variance by rare coding variant and common genetic signals. The horizontal axis indicates PVE by lead variant in the GWAS loci. The vertical axis indicates the sum of PVEs by rare coding variants in the locus. d. The cumulative contribution of lead and rare coding variants for trait variance. PVE by each rare variant in representative genes. Lead variant in the locus in gray, the sum of PVEs by pLoF in red and missense in dark blue. PVE, Phenotypic Variance Explained; GWAS, Genome Wide Association Study. TC, Total Cholesterol; High Density Lipoprotein Cholesterol; LDLC, Low Density Lipoprotein Cholesterol; TG, Triglycerides; pLoF, predicted Loss of Function.
Fig. 1 |
Fig. 1 |. Exome wide association study for blood lipids over one million individuals
a. and b. Overview of the study. The number of individuals included in the analysis by study (a) and by population (b). c. Correlation between the number of individuals and identified variants in the target region. The horizontal axis shows the number of individuals in each population by study. The vertical axis shows the number of variants identified in the corresponding population. The size of point is proportional to the number of individuals. d. Distribution of effect sizes for exome-wide significant associations is shown. Each dot represents a variant-trait pair with significant association in this study (Methods). All four blood lipids are plotted. The horizontal axis indicates the minor allele frequency, while the vertical axis displays the effect size for each allele from the regression model (β), with the unit of effect size normalized to the standard deviations of blood lipids. The lines represent the statistical power of 80% at sample sizes of one million (dark gray), 500,000 (medium gray), and 100,000 (light gray) individuals. c. Minor allele frequency of associated variants by variant impact. The rectangles illustrate the interquartile range of the minor allele frequencies, with the bottom and top edges representing the first and third quartiles, respectively. The line inside the rectangle denotes the median and the whiskers extend from the quartiles to the smallest and largest observed values, within a distance no greater than 1.5 times the interquartile range. d. Direction of the effects for associated variants. Variants positively associated with the blood lipids are displayed on the positive side of the vertical axis. The height of each bar represents the number of variants in that category. Bar colors indicate variant classes, with blue for missense variants and red for pLoF variants. AFR, African-like population; AMR, Admixed-American-like population; ASN, Asian-like population; EAS, East-Asian-like population; EUR, European-like population; HIS, Hispanic-like population; SAS, South-Asian-like population; TC, Total Cholesterol; LDLC, Low Density Lipoprotein Cholesterol; HDLC, High Density Lipoprotein Cholesterol; TG, Triglycerides; pLoF, predicted Loss of Function; EWS, Exome Wide Significance.
Fig. 2 |
Fig. 2 |. Different expressivity of rare coding variants by variant classes
a. Variant deleteriousness, constraints, and statistical associations. The panel represents variant classes as pLoF (red), Missense (blue), and Synonymous/Non-coding (gray, used as reference). The ranges associated with the blue points depict the Missense Score for missense variants. We computed the Missense Score for missense single nucleotide variants by using 29 in-silico deleteriousness prediction algorithms. The score was calculated as the number of deleterious predictions divided by the number of available algorithms for each variant, with values ranging from 0 to 1 (Methods). Based on the Missense Scores, missense variants were grouped into bins. pLoF variants were grouped by LOFTEE predictions. The horizontal axis indicates the median minor allele frequency for each variant class, while the vertical axis shows the odds ratios of EWS to non-EWS variants in reference to Synonymous/Non-coding variants. Odds ratios were estimated by Fisher’s Exact test. Circle size corresponds to the number of variants achieving EWS in each variant class. The dashed curve is the estimated line, and the shaded area is its 95% confidence interval. b. Penetrance of pLoF variants in the APOB. Gray rectangles represent the APOB gene model. Circles correspond to genetic variants examined in this study, with circle size denoting effect allele frequency, and color signifying variant class. The horizontal axis outlines genomic coordinates (hg38), whereas the vertical axis indicates Z-values (Beta/Standard Error) for LDLC association calculated by liner mixed model (Methods). c. Different distributions of Missense Scores (See above) observed in hypermorphic and hypomorphic variants. The box plot displays the distribution of Missense Scores for Missense variants within genes that have at least one EWS association by pLoF. A hypomorphic variant is defined as having the same directional association with EWS pLoF association. The P-values were calculated by two-sided Wilcoxon’s rank-sum test. The P-values were not adjusted for multiple testing correction. Conversely, a hypermorphic variant is defined as having an opposite directional association to EWS. pLoF, predicted Loss of Function; HC, High Confidence; LC, Low Confidence; EWS, Exome Wide Significance; LDLC, Low Density Lipoprotein Cholesterol.
Fig. 3 |
Fig. 3 |. Shared allelic effects across diverse populations
a. The upset plot describes the combinations of populations that observed EWS signals through intra-population meta-analysis. The bar chart at the top quantifies the number of EWS associations across various combinations of populations. Each bar represents the total number of associations observed for specific combinations of populations, as indicated by the connected points in the central matrix. The central matrix shows the population combinations involved in each set of associations, where filled squares indicate the populations included in a particular combination. In the right panel, the horizontal bar chart shows the number of associations observed within each population individually. b. Allele frequency comparison for non-EUR specific signals. Each point represents an EWS association that is significant only in non-EUR groups (AFR in the left panel and AMR in the right panel). The vertical axes show the minor allele frequency in EUR, while the horizontal axes show the minor allele frequency in AFR or AMR. Gray points indicate variants that were not tested in the EUR group due to low allele frequencies. c. Observed effect sizes across studies and populations. Each point indicates variant-trait pair with EWS. The horizontal axis shows the effect sizes in the EUR population. The vertical axes show the effect sizes in AFR and AMR/HIS populations. The error bars represent the 95% confidence interval. R2 indicates the squared Pearson’s correlation coefficients of effect sizes. d. Consistent effect size of PCSK9 p.C679* (stop gain) variant across multiple populations. The rectangles indicate effect sizes of PCSK9 p.C679* on blood LDLC level in the studied population. The error bars show its 95% confidence interval. The size of rectangles is proportional to AAF. The P-values were calculated by linear mixed model with two-sided test. The P-values were not adjusted for multiple testing correction. AAF, Alternate Allele Frequency; EWS, Exome Wide Significance; AFR, African-like population; ASN, Asian-like population; AMR, Admixed-American-like population; EAS, East-Asian-like population; EUR, European-like population; HIS, Hispanic-like population; SAS, South-Asian-like population; TC, Total Cholesterol; HDLC, High density lipoprotein cholesterol; LDLC, Low Density Lipoprotein Cholesterol; TG, Triglycerides. MVP, Million Veteran Program; UKB, UK Biobank; AOU, All of Us Research Program.
Fig. 4 |
Fig. 4 |. Recessive alleles associated with blood lipids
a. Comparison of effect sizes between additive and recessive models. The horizontal axis displays the effect size as estimated by linear mixed model under additive assumption, while the vertical axis shows the effect size estimated under recessive assumption (Methods). Each dot indicates a genetic variant, with the error bar representing the 95% confidence interval. Dashed lines represent the predictions of recessive effect sizes based on the additive model estimates (y = 2x) and estimates that are twice as large (y = 4x) as those from the additive model. b. Effect size from population-wise or meta-analysis estimates for variants with the largest deviations in recessive estimates from the predicted effect sizes based on additive model estimates. Gray dots represent additive effect sizes, while dark blue dots correspond to recessive effect sizes calculated by linear mixed model. Error bars indicate 95% confidence intervals. TC, Total Cholesterol; LDLC, Low Density Lipoprotein Cholesterol; HDLC, High Density Lipoprotein Cholesterol; TG, Triglycerides; MVP, Million Veteran Program; UKB, UK Biobank; AFR, African-like population; AMR, Admixed-American-like population; ASN, Asian-like population; EAS, East-Asian-like population; EUR, European-like population; HIS, Hispanic-like population; SAS, South-Asian-like population.
Fig. 5 |
Fig. 5 |. Re-evaluation of clinically curated pathogenic variants for FH
a. Variant allele frequencies of FH-related ClinVar variants observed in the study. The rectangles illustrate the interquartile range of the minor allele frequencies, with the bottom and top edges representing the first and third quartiles, respectively. The line inside the rectangle denotes the median and the whiskers extend from the quartiles to the smallest and largest observed values, within a distance no greater than 1.5 times the interquartile range. b. Phenotype associations of FH-related ClinVar variants. The height of the bar indicates total number of variants in the category, and the blue color indicates the proportion of the variants significantly associated with clinical LDLC levels in this study. Statistical significance determined using Bonferroni adjustment. c. Distribution of the effect sizes for ClinVar FH associated variants determined in this study. Each dot represents a variant in PCSK9, APOB, or LDLR. The color of each dot indicates the associated gene. The dashed, vertical line indicates median effect size for established pathogenic variants. Triangles indicate variants of uncertain significance with large effect sizes, as well as pathogenic variants with a negative effect size on clinical LDLC levels. SD, Standard Deviation; LDLC, Low Density Lipoprotein Cholesterol. FH, Familial Hypercholesterolemia.
Fig. 6 |
Fig. 6 |. CAD risks in blood lipid associated alleles
Scatter plots indicate effect size in lipids on the horizontal axes and log odds ratio for CAD on the vertical axes. Nominally associated (P < 0.05) variants with CAD were highlighted in red and the sizes of the points indicating minor allele frequency. The associated gene names are highlighted in the corner of quadrant and the number of associations were indicated. CAD, coronary artery disease; OR, odds ratio; MAF, minor allele frequency; TC, total cholesterol; LDLC, low density lipoprotein cholesterol; HDLC, high density lipoprotein cholesterol; TG, triglycerides.

References

    1. Wiegman A., et al. Familial hypercholesterolaemia in children and adolescents: gaining decades of life by optimizing detection and treatment. European Heart Journal 36, 2425–2437 (2015). - PMC - PubMed
    1. Gidding S.S., et al. The Agenda for Familial Hypercholesterolemia: A Scientific Statement From the American Heart Association. Circulation 132, 2167–2192 (2015). - PubMed
    1. Versmissen J., et al. Efficacy of statins in familial hypercholesterolaemia: a long term cohort study. BMJ 337, a2423 (2008). - PMC - PubMed
    1. Neil A., et al. Reductions in all-cause, cancer, and coronary mortality in statin-treated patients with heterozygous familial hypercholesterolaemia: a prospective registry study. European Heart Journal 29, 2625–2633 (2008). - PMC - PubMed
    1. Pijlman A.H., et al. Evaluation of cholesterol lowering treatment of patients with familial hypercholesterolemia: a large cross-sectional study in The Netherlands. Atherosclerosis 209, 189–194 (2010). - PubMed

Publication types

LinkOut - more resources