. 2024 Sep 19:15:1451024.
doi: 10.3389/fgene.2024.1451024. eCollection 2024.

A proteogenomic atlas of the human neural retina

Affiliations

A proteogenomic atlas of the human neural retina

Tabea V Riepe et al. Front Genet. .

Abstract

The human neural retina is a complex tissue with abundant alternative splicing and more than 10% of genetic variants linked to inherited retinal diseases (IRDs) alter splicing. Traditional short-read RNA-sequencing methods have been used for understanding retina-specific splicing but have limitations in detailing transcript isoforms. To address this, we generated a proteogenomic atlas that combines PacBio long-read RNA-sequencing data with mass spectrometry and whole genome sequencing data of three healthy human neural retina samples. We identified nearly 60,000 transcript isoforms, of which approximately one-third are novel. Additionally, ten novel peptides confirmed novel transcript isoforms. For instance, we identified a novel IMPDH1 isoform with a novel combination of known exons that is supported by peptide evidence. Our research underscores the potential of in-depth tissue-specific transcriptomic analysis to enhance our grasp of tissue-specific alternative splicing. The data underlying the proteogenomic atlas are available via EGA with identifier EGAD50000000101, via ProteomeXchange with identifier PXD045187, and accessible through the UCSC genome browser.

Keywords: alternative splicing; inherited retinal disease (IRD); isoform; long-read sequencing; mass spectrometry; multi-omics; neural retina; proteogenomics.


Conflict of interest statement

The authors declare that the research was conducted in the absence of any commercial or financial relationships that could be construed as a potential conflict of interest.

Figures
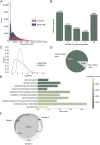
FIGURE 1
FIGURE 1
Discovering the transcript landscape in the human neural retina with long-read sequencing. (A) Transcript length distribution of protein coding PacBio IsoQuant (red) and GENCODE reference (blue) isoforms. (B) Number of isoforms detected per gene across the three samples. The number of isoforms for RetNet genes can be found in Supplementary Figure S1D. (C) Transcript per million (TPM) count for known GENCODE transcripts (blue) and novel IsoQuant transcripts (red). (D) Number of isoforms from protein coding genes (green) and non-coding genes (grey). (E) Visualization of the ten most significant hits of the gene ontology (GO) term enrichment analysis of the 300 most expressed genes. The bars are colored by the p-value and the gene ratio shows the percentage of genes associated with the GO-term among the 300 genes. (F) Overlap of transcripts identified in the three individual samples.
FIGURE 2
FIGURE 2
Iso-Seq reveals novel neural retinal transcripts. (A) IsoQuant classification schematic that compares retina transcripts with GENCODE transcripts. Full Splice Matches (FSMs) match the reference completely. Novel transcripts either match the reference splice junctions and are then called Novel In Catalog (NIC), or they contain novel splice junctions and are called Novel Not In Catalog (NNIC). (B) Number of reads and transcripts from the three retina samples associated with each transcript class. The classification of RetNet transcripts is shown in Supplementary Figure S1D. (C) Distance of transcription start sites (TSS) of known and novel transcripts to annotated refTSS CAGE peaks. (D) Most common novel elements of NIC and NNIC transcripts as classified by IsoQuant. The x-axis represents the fraction of transcripts with that specific event.
FIGURE 3
FIGURE 3
Most novel ORFs in the IsoQuant-GENCODE hybrid database contain novel protein sequence elements. (A) Number of known GENCODE open reading frames (ORFs) (blue) and novel ORFs in the hybrid database (red). (B) In-silico digestion of the ORFs in the hybrid database with trypsin, chymotrypsin, or AspN and LysC shows the number of multi-mapping peptides (purple) and uniquely mapping peptides. GENCODE peptides are shown in blue and novel peptides in red. (C) The SQANTI Protein classification scheme compares the long-read ORFs to the reference ORFs. ORFs are classified using the N-terminus, C-terminus, and the splice junctions. A protein full splice match (pFSM) isoform matches a reference isoform. In a protein novel in catalog (pNIC) isoform the N-terminus, the C-terminus, and the splice junctions are known but the combination is new. A protein novel not in catalog (pNNIC) isoform contains at least one novel protein element. (D) Comparison of the transcript (two different bars) and protein (subdivision in the bars) classification of novel ORFs.
FIGURE 4
FIGURE 4
Novel peptides confirm novel IsoQuant isoforms. On the left side, the canonical transcript of each gene is shown with the yellow highlighted region shown in more detail. GENCODE transcripts are shown in blue, novel IsoQuant transcripts in orange, novel Oxford Nanopore Technology (ONT) sequencing transcripts in green, and novel peptides in yellow. Transcripts were filtered for transcripts with at least one exon in the displayed region. On the right, the spectrum of the novel peptide is shown with b-ions in blue and y-ions in red. (A) Five novel peptides confirm an intron retention event in AMPH that is also supported by the ONT data. The spectrum of one novel peptide is shown, the other four spectra can be found in Supplementary Data Sheet 4 (B) The novel splice peptide in TPM3 maps to two novel transcripts that contain a novel combination of known splice junctions. (C) A novel splice junction peptide supports TRANSCRIPT22463. CHR6. NNIC derived from the EPB41L2 gene.
FIGURE 5
FIGURE 5
RetNet genes demonstrating the highest expression of a novel isoform. On the left, PacBio transcripts are shown in orange, Oxford Nanopore Technology (ONT) sequencing transcripts in green, and reference GENCODE v39 transcripts in blue. We only show PacBio and ONT transcripts that result in a novel open reading frame. For all transcripts, the 5′-end is shown on the left and the 3′-end on the right. On the right, the Transcripts Per Million (TPM) count in the three individual samples is shown. (A) SAMD11 transcripts and their corresponding TPM. (B) SLC24A1 transcripts and their corresponding TPM (C) IMPDH1 transcripts and their corresponding TPM. The highlighted yellow part is shown in (D) with peptides that map to the elongated last exon. The spectra of the peptides are shown in Supplementary Figure S3.

References

    1. Abugessaisa I., Noguchi S., Hasegawa A., Kondo A., Kawaji H., Carninci P., et al. (2019). refTSS: a reference data set for human and mouse transcription start sites. J. Mol. Biol. 431, 2407–2422. 10.1016/J.JMB.2019.04.045 - DOI - PubMed
    1. Aísa-Marín I., García-Arroyo R., Mirra S., Marfany G. (2021). The alter retina: alternative splicing of retinal genes in health and disease. Int. J. Mol. Sci. 22, 1855. 10.3390/ijms22041855 - DOI - PMC - PubMed
    1. Albert S., Garanto A., Sangermano R., Khan M., Bax N. M., Hoyng C. B., et al. (2018). Identification and rescue of splice defects caused by two neighboring deep-intronic ABCA4 mutations underlying stargardt disease. Am. J. Hum. Genet. 102, 517–527. 10.1016/j.ajhg.2018.02.008 - DOI - PMC - PubMed
    1. Bacchi N., Casarosa S., Denti M. A. (2014). Splicing-correcting therapeutic approaches for retinal dystrophies: where endogenous gene regulation and specificity matter. Invest Ophthalmol. Vis. Sci. 55, 3285–3294. 10.1167/IOVS.14-14544 - DOI - PubMed
    1. Ben-Yosef T. (2022). Inherited retinal diseases. Int. J. Mol. Sci. 23, 13467. 10.3390/IJMS232113467 - DOI - PMC - PubMed