. 2024 Sep 19:13:98.
doi: 10.12688/f1000research.143642.5. eCollection 2024.

Metabolomic characterization of human glioblastomas and patient plasma: a pilot study

Affiliations

Metabolomic characterization of human glioblastomas and patient plasma: a pilot study

Yin Allison Liu et al. F1000Res. .

Abstract

Background: Glioblastoma (GBM) is a clinically challenging primary brain tumor with poor survival outcome despite surgical resection and intensive chemoradiation. The metabolic heterogeneity of GBM can become biomarkers for treatment response, resistance, and outcome prediction. The aim of the study is to investigate metabolic distinctions between primary and recurrent GBM tissue and patient plasma to establish feasibility for metabolic profiling.

Methods: A single-center cohort study analyzed tissue and blood samples from 15 patients with GBM using untargeted metabolomic/lipidomic assays. Metabolomic, lipidomic, and biogenic amine analyses were conducted on GBM tissue and patient plasma at diagnosis and recurrence using untargeted mass spectrometry. The study utilized a small but longitudinally collected cohort to evaluate alteration in metabolites, lipids, and biogenic amines between specimens at diagnosis and recurrence.

Results: Exploratory analysis revealed significant alteration in metabolites, lipids, and biogenic amines between diagnostic and recurrent states in both tumor and plasma specimens. Notable metabolites differed at recurrence, including N-alpha-methylhistamine, glycerol-3-phosphate, phosphocholine, and succinic acid in tissue, and indole-3-acetate, and urea in plasma. Principal component analysis revealed distinct metabolomic profiles between tumor tissue and patient plasma. Distinct metabolic profiles were observed in GBM tissue and patient plasma at recurrence, demonstrating the feasibility of using metabolomic methodologies for longitudinal studies. One patient exhibited a unique tumor resistance signature at diagnosis, possibly indicating a high-risk metabolomic phenotype.

Conclusions: In this small cohort, the findings suggest the potential of metabolomic signatures of GBM tissue and patient plasma for risk stratification, outcome prediction, and the development of novel adjuvant metabolic-targeting therapies. The findings suggest metabolic discrepancies at diagnosis and recurrence in tissue and plasma, highlighting potential implications for evaluation of clinical response. The identification of significant changes in metabolite abundance emphasizes the need for larger studies using targeted metabolomics to validate and further explore these profiles.

Keywords: biomarker; feasibility; glioblastoma; pilot; untargeted metabolomics.


Conflict of interest statement

No competing interests were disclosed.

Figures

Figure 1.
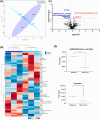
Figure 1.. Comparison of metabolomic profiles of nine glioblastoma tumor tissue specimens at diagnosis and three tissue specimens at recurrence.
(A) Principal component analysis (PCA) plot showing different trends of metabolomic characteristics between tissues at diagnosis (purple) and tissue at recurrence (light blue). (B) Heatmap of the top 50 altered metabolites at diagnosis and at recurrence. Blue indicates decreased peak value and maroon indicates increased peak value of each compound listed. (C) Volcano plot of up regulated metabolites in red and down regulated metabolites in blue in glioblastoma tumor tissue specimens at recurrence comparing to at diagnosis using p-value of <0.05 and fold change cutoffs of 1.5. (D) Plots of individual values for each metabolite demonstrating peak value changes at diagnosis and at recurrence in brain tumor tissue. Values were determined as peak heights from LC/MS analysis. Single asterisk indicates a p value of <0.05. Double asterisks indicate a p value of <0.01.
Figure 2.
Figure 2.. Comparison of metabolomic profiles of three paired fresh frozen brain tumor tissue specimens at diagnosis and at recurrence.
(A) Principal component analysis (PCA) plot showing different trends of metabolomic characteristics between tissues at diagnosis (purple) at tissue at recurrence (light blue). (B) Heatmap of the top 50 altered metabolites. Blue indicates decreased peak value and red indicates increased peak value of each compound listed. (C) Volcano plot of upregulated metabolites in red and downregulated metabolites in blue in glioblastoma tumor tissue specimens at recurrence comparing to at diagnosis using p-value of <0.05 and fold change cutoffs of 1.5. (D) Plots of individual values for each metabolite demonstrating peak value changes at diagnosis and at recurrence in brain tumor tissue. Values were determined as peak heights from LC/MS analysis. Single asterisk indicates a p value of <0.05. Double asterisks indicate a p value of <0.01.
Figure 3.
Figure 3.. Comparison of metabolomic profiles in plasma of glioblastoma patients at diagnosis and at recurrence.
(A) Principal component analysis (PCA) plot showing different trends of metabolomic characteristics between tissues at diagnosis (purple) at tissue at recurrence (light blue). (B) Heatmap of the top 50 altered metabolites. Blue indicates decreased peak value and red indicates increased peak value of each compound listed. (C) Volcano plot of up regulated metabolites in red and down regulated metabolites in blue in glioblastoma tumor tissue specimens at recurrence comparing to at diagnosis using p-value of <0.05 and fold change cutoffs of 1.5. Single asterisk indicates a p value of <0.05. Double asterisks indicate a p value of <0.01. (D) Progression free survival of six patients whose plasma samples were analyzed. (E) Significantly altered metabolite clusters by ChemRich, a statistical enrichment approach based on chemical similarity. The size of the dots is in proportion with the level of alteration in each cluster of metabolites. Red indicates increased peak value and blue indicates decreased peak value. (F) Box plots demonstrating metabolite peak value changes at diagnosis and at recurrence in brain tumor tissues. Values were determined as peak height from LC/MC analysis. Single asterisk indicates a p value of <0.05. Double asterisks indicate a p value of <0.01.
Figure 4.
Figure 4.. Comparison of metabolomic profiles in glioblastoma tumor tissue and patient plasma.
(A, C, E) Principal component analysis plots comparing tissue vs. plasma specimens at diagnosis, tissue vs. plasma at recurrence, and all four specimen groups. (B, D, F) Heatmaps of the top 50 significantly altered metabolites in the comparisons correlating with A, C, and E, respectively.

Update of

References

    1. Ostrom QT, Cioffi G, Waite K, et al. : CBTRUS Statistical Report: Primary Brain and Other Central Nervous System Tumors Diagnosed in the United States in 2014-2018. Neuro-Oncology. Oct 5 2021;23(12 Suppl 2):iii1–iii105. 10.1093/neuonc/noab200 - DOI - PMC - PubMed
    1. Stupp R, Mason WP, Bent MJ, et al. : Radiotherapy plus concomitant and adjuvant temozolomide for glioblastoma. N. Engl. J. Med. Mar 10 2005;352(10):987–996. 10.1056/NEJMoa043330 - DOI - PubMed
    1. Perry JR, Laperriere N, Mason WP: Radiation plus Temozolomide in Patients with Glioblastoma. N. Engl. J. Med. Jun 1 2017;376(22):2195–2197. 10.1056/NEJMc1704726 - DOI - PubMed
    1. Oronsky B, Reid TR, Oronsky A, et al. : A Review of Newly Diagnosed Glioblastoma. Front. Oncol. 2020;10:574012. 10.3389/fonc.2020.574012 - DOI - PMC - PubMed
    1. Hanahan D: Hallmarks of Cancer: New Dimensions. Cancer Discov. Jan 2022;12(1):31–46. 10.1158/2159-8290.CD-21-1059 - DOI - PubMed