. 2024 Sep 20;9(39):40592-40607.
doi: 10.1021/acsomega.4c04276. eCollection 2024 Oct 1.

Advancing Albumin Isolation from Human Serum with Graphene Oxide and Derivatives: A Novel Approach for Clinical Applications

Affiliations

Advancing Albumin Isolation from Human Serum with Graphene Oxide and Derivatives: A Novel Approach for Clinical Applications

Chayachon Apiwat et al. ACS Omega. .

Abstract

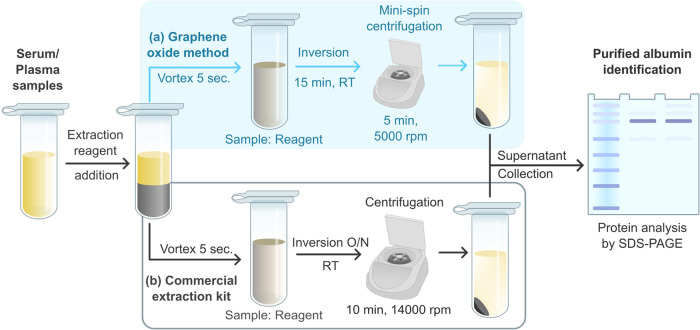
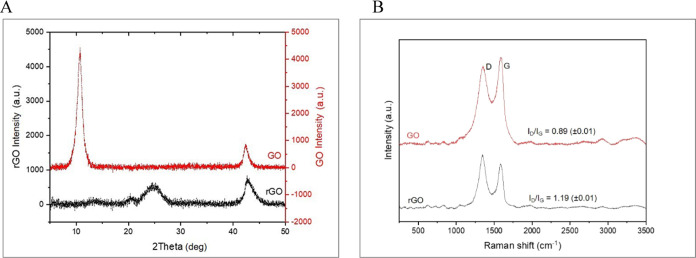
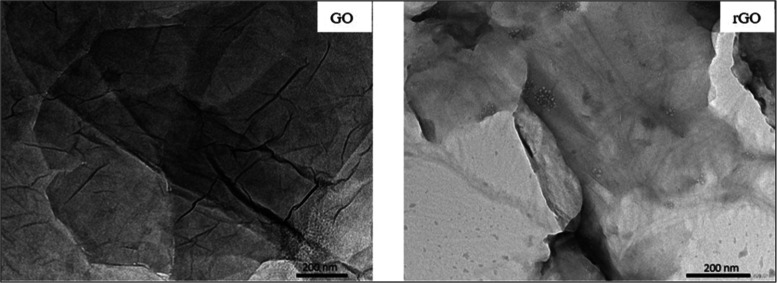
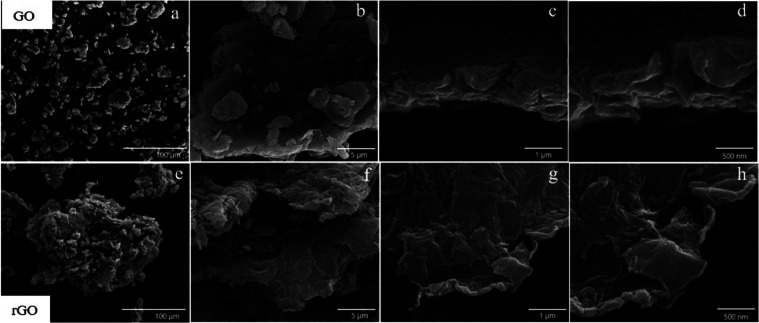
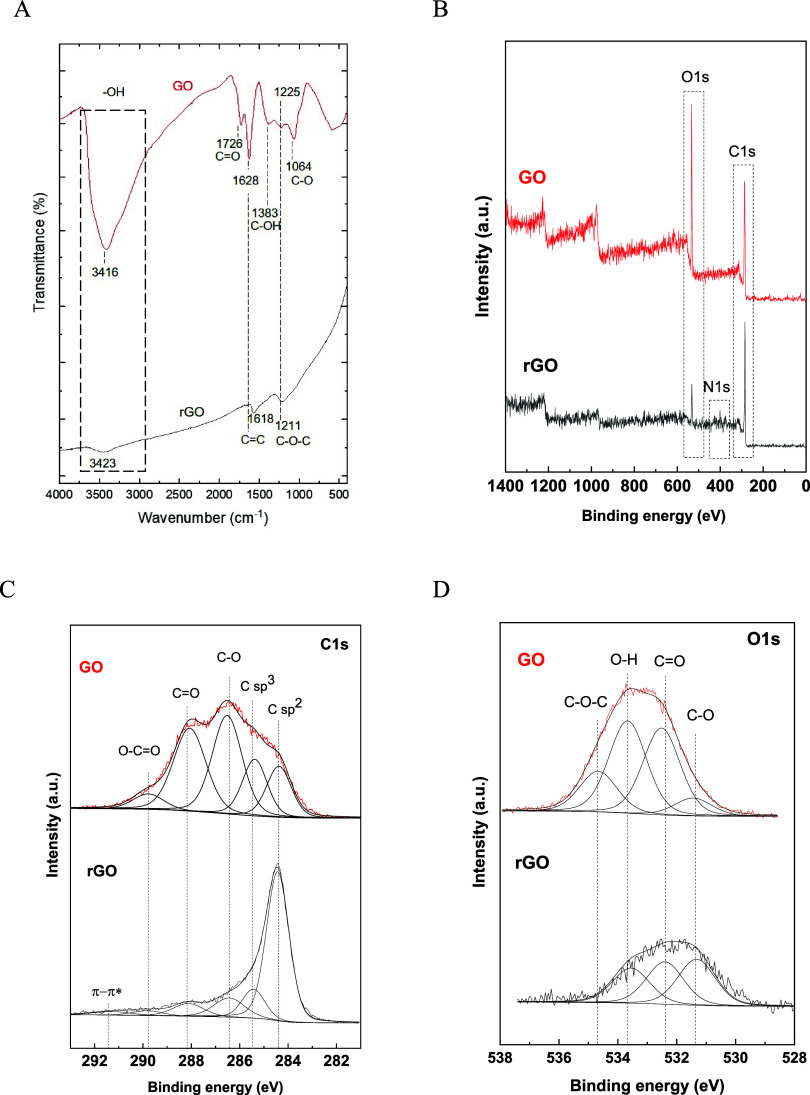
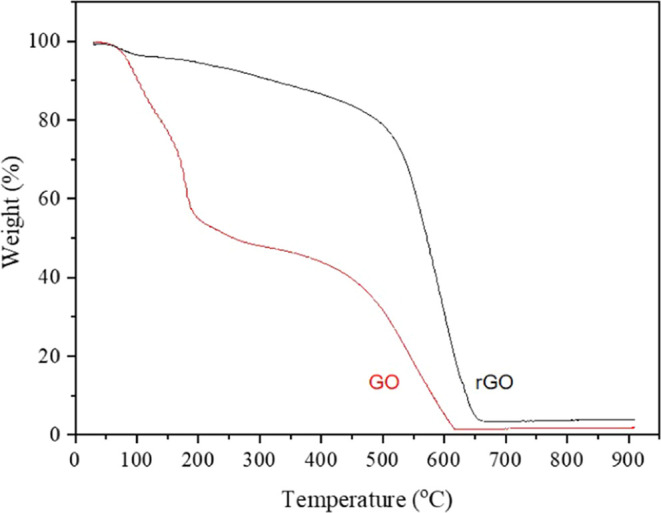
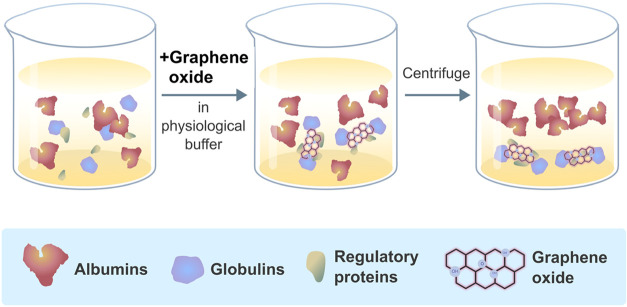
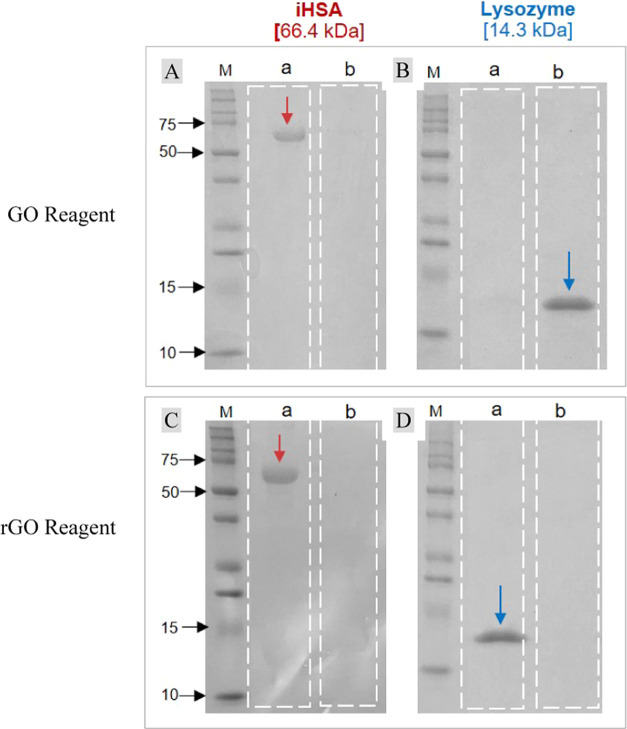
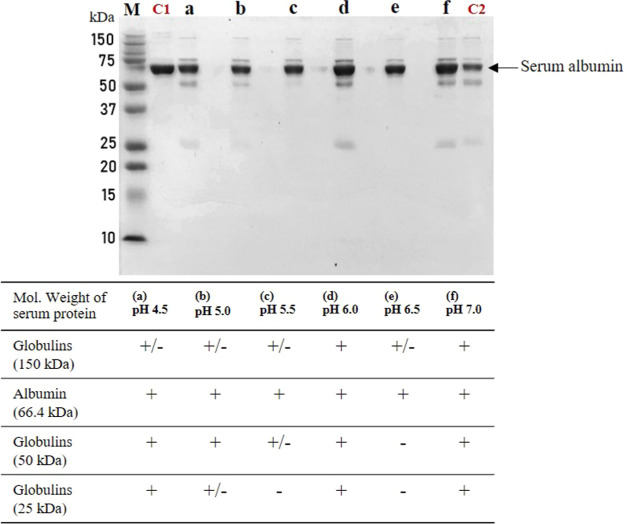
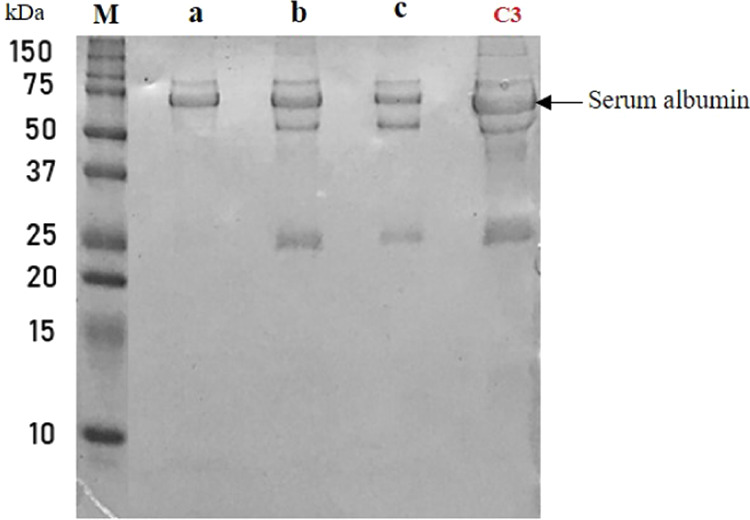
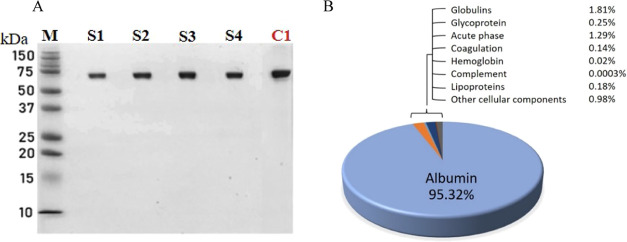
This study introduces a novel, environmentally friendly albumin isolation method using graphene oxide (GO). GO selectively extracts albumin from serum samples, leveraging the unique interactions between GO's oxygen-containing functional groups and serum proteins. This method achieves high purification efficiency without the need for hazardous chemicals. Comprehensive characterization of GO and reduced graphene oxide (rGO) through techniques such as X-ray diffraction (XRD) analysis, Raman spectroscopy, scanning electron microscopy (SEM), and Fourier transform infrared spectroscopy (FTIR) confirmed the structural and functional group transformations crucial for protein binding. Sodium dodecyl sulfate-polyacrylamide gel electrophoresis (SDS-PAGE) and mass spectrometry analyses demonstrated over 95% purity of isolated albumin, with minimal contamination from other serum proteins. The developed method, optimized for pH and incubation conditions, showcases a green, cost-effective, and simple alternative for albumin purification, promising broad applicability in biomedical research and clinical applications.


Conflict of interest statement

The authors declare no competing financial interest.

Figures

Figure 1
Figure 1
Comparative schematic of albumin isolation protocols. (a) Developed GO-based method entails the addition of GO extraction reagent to serum/plasma, followed by a 5 s vortex, a 15 min room temperature incubation, and a 5 min centrifugation at 5000 rpm. The supernatant is then analyzed for albumin purity via SDS-PAGE. (b) The commercial kit method begins similarly with reagent addition and vortexing, followed by 10 min centrifugation at 14000 rpm, with the final albumin purity also assessed by SDS-PAGE.
Figure 2
Figure 2
Comparative analysis of GO and rGO. (A) shows the XRD patterns of as-prepared GO (red line) and rGO (black line), illustrating distinct peak shifts that indicate differences in their crystal structures. (B) presents the Raman spectra for GO (red line) and rGO (black line), highlighting the characteristic D and G bands. The ID/IG ratios, indicative of disorder within the graphitic structure, are annotated for both materials.
Figure 3
Figure 3
TEM images showcase the morphological differences between GO on the left, characterized by its transparent and wrinkled surface, and rGO on the right, which displays a more opaque and densely folded texture. The contrast highlights the impact of reduction on GO’s structural properties.
Figure 4
Figure 4
Comparative SEM analysis of GO and rGO. Panels (a–d) showcase GO at varying magnifications, highlighting its layered and wrinkled surface structure. Panels (e–h) display rGO, revealing surface texture and morphology changes due to reduction, including increased folding and amorphization.
Figure 5
Figure 5
Comparative analysis of GO and rGO functional groups. (A) FTIR spectra highlight characteristic functional groups, with notable differences in −OH, C=O, and C–O stretching vibrations between GO and rGO. (B) Wide scan XPS spectra provide an overview of elemental composition, showing distinct peaks for C 1s and O 1s. (C) Deconvoluted C 1s XPS spectra of GO and rGO detail the presence and reduction of carbon-associated functional groups. (D) Deconvoluted O 1s XPS spectra reveal changes in oxygen-containing groups, indicating an effective reduction in rGO.
Figure 6
Figure 6
TGA Thermograms of GO and rGO. The graph shows the thermal degradation profiles of GO (red line) and rGO (black line) in an oxygen atmosphere. It illustrates distinct mass loss stages for each material at various temperature ranges, highlighting differences in thermal stability and decomposition behavior between GO and rGO.
Figure 7
Figure 7
Schematic representation of the albumin isolation process using GO. The illustration demonstrates the sequential steps where GO selectively binds globulins and regulatory proteins in a physiological buffer, allowing for the isolation of purified albumin postcentrifugation.
Figure 8
Figure 8
SDS-PAGE analysis for isolation of proteins using GO and rGO reagents. This figure illustrates the separation of a negatively charged protein, iHSA (66.4 kDa), and a positively charged protein, lysozyme (14.3 kDa), through SDS-PAGE. Each lane was loaded with 2 μg of total protein. The assay was performed at pH 7.0, where lysozyme is positively charged, and albumin is negatively charged in the context of the binding assay. However, during SDS-PAGE, both proteins are negatively charged due to SDS binding.
Figure 9
Figure 9
SDS-PAGE analysis of protein isolation across pH conditions. This figure demonstrates the effect of varying pH levels (4.5, 5.0, 5.5, 6.0, 6.5, and 7.0) on the separation of proteins using the GO isolation method. Each lane was loaded with 2 μg of total protein. The lanes marked (a–f) correspond to supernatant fractions obtained with GO reagents at the specified pH values. Lane (M) serves as the protein marker, (C1) is a positive control using iHSA (2 μg), and (C2) features a commercial albumin extraction reagent for comparison. The presence of serum albumin is highlighted across different pH conditions.
Figure 10
Figure 10
SDS-PAGE Analysis of Albumin Purification Efficacy. This figure compares albumin purification from serum using different methods: (a) GO-based technique, (b) rGO-based technique, (c) commercial reagent kit. Lane M denotes the protein marker, and lane C3 is the control serum sample.
Figure 11
Figure 11
SDS-PAGE and proteomic analysis of serum samples using the GO method. (A) SDS-PAGE of supernatant fractions obtained through the GO method, with lanes labeled (M) for the protein marker and (S1–S4) representing albumin extracted from various serum samples using the GO reagent. Lane (C1) serves as the isolated-state human serum albumin (iHSA) positive control at 2 μg. (B) Pie chart detailing the protein composition of the purified supernatant fractions from four serum samples, as determined by mass spectrometry, categorized by protein function. The chart highlights the significant dominance of albumin in the purified fractions.

Similar articles

References

    1. Li C.; Zhang D.; Pan Y.; Chen B. Human Serum Albumin Based Nanodrug Delivery Systems: Recent Advances and Future Perspective. Polymers 2023, 15 (16), 3354.10.3390/polym15163354. - DOI - PMC - PubMed
    1. Spada A.; Emami J.; Tuszynski J. A.; Lavasanifar A. The Uniqueness of Albumin as a Carrier in Nanodrug Delivery. Mol. Pharmaceutics 2021, 18 (5), 1862–1894. 10.1021/acs.molpharmaceut.1c00046. - DOI - PubMed
    1. Shi Z.; L M.; Huang Q.; Ding C.; Wang W.; Wu Y.; Luo J.; Lin C.; Chen T.; Zeng X.; Mei L.; Zhao Y.; Chen H. NIR-dye bridged human serum albumin reassemblies for effective photothermal therapy of tumor. Nat. Commun. 2023, 14 (1), 656710.1038/s41467-023-42399-9. - DOI - PMC - PubMed
    1. de Richter E. A.; Kiens B.; Galbo H.; Saltin B.. Skeletal Muscle Metabolism in Exercise and Diabetes (Advances in Experimental Medicine and Biology), 1st ed.; Springer, 1998; p 441.
    1. Raoufinia R.; Mota A.; Keyhanvar N.; Safari F.; Shamekhi S.; Abdolalizadeh J. Overview of albumin and its purification methods. Adv. Pharm. Bull. 2016, 6 (4), 495–507. 10.15171/apb.2016.063. - DOI - PMC - PubMed

LinkOut - more resources