. 2024 Aug 27;6(10):424-441.
doi: 10.1096/fba.2024-00074. eCollection 2024 Oct.

Intracellular TAS2Rs act as a gatekeeper for the excretion of harmful substances via ABCB1 in keratinocytes

Affiliations

Intracellular TAS2Rs act as a gatekeeper for the excretion of harmful substances via ABCB1 in keratinocytes

Sazanami Mori et al. FASEB Bioadv. .

Abstract

Bitter taste receptors (TAS2Rs) are not only expressed in the oral cavity but also in skin. Extraoral TAS2Rs are thought to be involved in non-taste perception and tissue-specific functions. Keratinocytes that express TAS2Rs in the skin provide a first-line defense against external threats. However, the functional roles of these receptors in host defense remain unclear. Here, we demonstrated the sensory role of intracellularly located TAS2Rs against toxic substances in keratinocytes. Although many G protein-coupled receptors elicit signals from the surface, TAS2Rs were found to localize intracellularly, possibly to the ER, in human keratinocytes and HaCaT cells. TAS2R38, one of the TAS2R members, activated the Gα12/13/RhoA/ROCK/p38 MAP kinase/NF-κB pathway upon stimulation by phenylthiocarbamide (PTC), an agonist for this receptor, leading to the production of ABC transporters, such as ABCB1, in these cells. Notably, treatment with bitter compounds, such as PTC and saccharin, induced the upregulation of ABCB1 in HaCaT cells. Mechanistically, intracellular TAS2R38 and its downstream signaling Gα12/13/RhoA/ROCK/p38 MAP kinase/NF-κB pathway were identified to be responsible for the above effect. Pretreatment with PTC prevented the accumulation of rhodamine 123 because of its excretion via ABCB1. Furthermore, pretreatment with PTC or saccharin counteracted the effect of the toxic compound, diphenhydramine, and pretreated HaCaT cells were found to proliferate faster than untreated cells. This anti-toxic effect was suppressed by treatment with verapamil, an ABCB1 inhibitor, indicating that enhanced ABCB1 helps clear toxic substances. Altogether, harmless activators of TAS2Rs may be promising drugs that enhance the excretion of toxic substances from the human skin.

Keywords: ABCB1; bitter taste receptors; host defense; intracellular location; keratinocytes: GPCR.


Figures

FIGURE 1
FIGURE 1
TAS2Rs in human keratinocytes. (A) Expression of human TAS2Rs in NHK cells. NHK cells were differentiated via culture with 1 mM CaCl2 for 3 days. (B) Increased expression of TAS2R14 and TAS2R38 during NHK cell differentiation n = 5. (C) Increased expression of TAS2R14 and TAS2R38 following stimulation of differentiated NHK cells with 1 mM PTC and 1 mM denatonium n = 4. (D) Representative images of immunohistochemical staining for TAS2R14 and TAS2R38 in lesioned skin from healthy donor. Scale bar, 100 μm. (E) Increased expression of TAS2R14 and TAS2R38 during HaCaT cell differentiation n = 4. (F) Increased expression of TAS2R14 and TAS2R38 in differentiated HaCaT cells following stimulation with 1 mM PTC or 1 mM denatonium in differentiated HaCaT cells n = 4. Data are expressed as mean ± SEM. *p < 0.05, **p < 0.01 using two‐way ANOVA followed by Tukey's post hoc test (B, C, F) and **p < 0.01 using Student's t‐test (E).
FIGURE 2
FIGURE 2
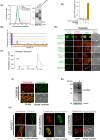
Intracellular localization of TAS2R14 and TAS2R38 in keratinocytes. (A) Expression of HA‐sst‐tagged TAS2R14 and HA‐sst‐tagged TAS2R38 in HEK293T cells. The HEK293T cells were transfected with the indicated receptors. Cells were stained with a primary HA antibody, followed by a PE‐conjugated secondary antibody, and HA‐positive cells were detected using flow cytometry (left). In this experiment, HA‐BLT1 located on the plasma membrane was used as a control. The production of receptor proteins was confirmed using SDS‐PAGE followed by immunoblotting (right). (B) Expression of 25 human TAS2Rs in HEK293T cells. HEK293T cells were transfected with the HA‐sst‐tagged receptors. Cells were stained with a primary HA antibody, followed by a PE‐conjugated secondary antibody, and HA‐positive cells were detected using flow cytometry. HA‐BLT1 and empty vector (pcDNA3) were used as positive and negative controls, respectively. The fluorescence intensity of transfected cells was measured. (C) Intracellular [Ca2+] responses in HEK293T cells expressing HA‐sst‐TAS2R38 elicited by 1 mM PTC and 1 mM PROP. The response to 1 μM ATP was included as a positive control. (D) TGFα shedding assay demonstrating cell surface receptor activity. HEK293T cells were transfected with AP‐TGFα, HA‐sst‐TAS2R38, or the dopamine D2 receptor and Gα mixture, Gαq, Gαq/i1, Gαq/i3, Gαq/12, Gαq/13, and Gαq/s. After stimulation of HA‐sst‐TAS2R38 expressing cells with 1 mM PTC, the release of AP‐TGFα into the culture medium was determined. The dopamine D2 receptor was stimulated with 10 nM dopamine hydrochloride and 3,4‐dihydroxyphenethylamine hydrochloride. (E) Immunofluorescence confocal microscopic analysis of TAS2R38 with various organelle marker proteins. The HaCaT cells were subjected to immunocytochemical analysis. Organelle marker proteins (green) were detected using anti‐calnexin (ER marker), anti‐golgin‐97 (Golgi body marker), anti‐transferrin receptor (recycling endosome marker), anti‐EEA1 (early endosome marker), anti‐LAMP‐1 (lysosomal marker), and anti‐COX IV (mitochondrial marker). Endogenous TAS2R38 expression was detected using anti‐TAS2R38 (red). Scale bar, 10 μm. (F) Immunofluorescence confocal microscopic analysis of endogenous TAS2R38 in NHK cells. TAS2R38 expression was detected using anti‐TAS2R38 (red). Calnexin was detected as an ER marker using an anti‐calnexin antibody (green). Scale bar, 10 μm. (G) Immunofluorescence confocal microscopic analysis of HA‐sst‐tagged TAS2R14 and HA‐sst‐tagged TAS2R38 in HaCaT cells. HaCaT cells were transfected with HA‐sst‐TAS2R14, HA‐sst‐TAS2R38, or HA‐BLT1, and subjected to immunocytochemical analysis. HA‐BLT1 (left), HA‐TAS2R14 (middle), and HA‐TAS2R38 (right) were detected using anti‐HA (green). HA‐BLT1 was used as the control receptor on the cell surface. Calreticulin was detected using anti‐calreticulin (red). Scale bar, 10 μm. (H) Western blot showing HA‐sst‐TAS2R38 in membrane fractions from HEK293T cells expressing HA‐sst‐TAS2R38 treated with or without 20 μM MG132. β‐Actin was employed as an experimental and loading control.
FIGURE 3
FIGURE 3
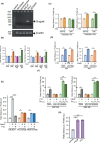
Coupling of intracellular TAS2R38 with Gα12/13. (A) Expression analysis of Gαgust in human fibroblasts, keratinocytes, HaCaT, HeLa, and HEK293T cells. Total RNA was extracted from these cells and RT‐PCR of Gαgust was performed using these cDNAs as templates. (B) Activation of SRE and SRF‐RE via TAS2R38 by stimulation with 1 mM PTC (left) and 1 mM PROP (right). In TAS2R38 expressing HEK293T cells, NanoLuc luciferase activity driven by SRF‐RE, NFAT‐RE, CRE, or SRE was quantified as the ratio of NanoLuc/Firefly luciferase activity n = 4. (C) Activation of SRE and SRF‐RE by TAS2R38/PAV (right) but not TAS2R38/AVI (left) following stimulation with 1 mM PTC in HEK293T cells n = 4. (D) Effect of Gαi deficiency on the activation of SRE stimulated with 1 mM PTC and 1 mM PROP in HEK293A cells n = 4. (E) Effect of PTX on the activation of SRE stimulated with 1 mM PTC and 1 mM PROP in HEK293A cells. Reduced activity induced by PTX via the leukotriene B4/BLT1/Gαi axis was used as the control n = 4. (F) Effect of Gα12/13 deficiency on activation of SRF‐REs stimulated with 1 mM PTC and 1 mM PROP in HEK293A cells n = 4. (G) Activation of SRF‐RE by stimulating HaCaT cells with 1 mM PTC and 1 mM PROP in HaCaT cells. HaCaT cells were transfected with SRF‐RE‐fused NanoLuc luciferase, and luciferase activity driven by SRF‐RE was quantified as the ratio of NanoLuc/firefly luciferase activity n = 4. Data are expressed as mean ± SEM. *p < 0.05, **p < 0.01, ***p < 0.001 using two‐way ANOVA followed by Tukey's post hoc test (B–G).
FIGURE 4
FIGURE 4
Activation of the p38 MAPK/NF‐κB axis. (A) Western blot of p38 MAPK, phosphorylated p38 MAPK (p‐p38 MAPK), ERK1/2, phosphorylated ERK1/2 (p‐ERK1/2), JNK, and phosphorylated JNK (p‐JNK) in lysates from HEK293T cells expressing HA‐sst‐TAS2R38 at the indicated time points after stimulation with 1 mM PTC. (B) Western blot of p38 MAPK and p‐p38 MAPK in lysates from HEK293A and Gα12/13‐null (ΔGα12/13) HEK293A cells expressing HA‐sst‐TAS2R38 at the indicated time points after stimulation with 1 mM PTC. (C) Western blot of p38 MAPK and p‐p38 MAPK in lysates from HEK293A and ΔGα12/13 HEK293A cells expressing HA‐sst‐TAS2R38 with Gα12 or Gα13 at 15 h after 1 mM PTC stimulation. (D) Western blot of p38 MAPK and p‐p38 MAPK in lysates from HEK293A cells expressing HA‐sst‐TAS2R38 treated with or without 10 μM Y27632 after 1 mM PTC stimulation for 15 h. (E) Western blot of p38 MAPK and p‐p38 MAPK in HaCaT cell lysates after stimulation with 1 mM denatonium, 1 mM saccharin, or 1 mM salicin for 15 h. (F) Western blot of the p65 subunit of NF‐κB and phosphorylated p65 (phos‐p65) in cytoplasmic and nuclear extracts from HEK293T cells expressing HA‐sst‐TAS2R38 after stimulation with 1 mM PTC or 1 mM PROP for 15 h. (G) Western blot of p65 and phos‐p65 in the cytoplasmic and nuclear extracts from HEK293T cells expressing HA‐sst‐TAS2R38 treated with or without SB203580 at the indicated concentrations prior to stimulation with 1 mM PTC for 15 h. (H) Western blot of p65 and phos‐p65 in the cytoplasmic and nuclear extracts from differentiated HaCaT cells stimulated with 1 mM denatonium, 1 mM saccharin, or 1 mM salicin for 15 h. β‐Actin was employed as an experimental and loading control.
FIGURE 5
FIGURE 5
Expression of proinflammatory cytokines, chemokines, and ABC transporters in HaCaT cells stimulated with PTC. (A) Expression of IL‐1β, TNF‐α, and IL‐6 in PTC‐treated HaCaT cells. HaCaT cells were treated with 1 mM PTC for 15 h in the presence or absence of a ROCK blocker (Y‐27632) or p38 MAPK‐inhibitor (SB203580), and total RNAs was extracted. Real‐time PCR of the cytokines was performed using cDNAs as templates n = 4. (B) Expression of IL‐8, CXCL1, and CXCL9 in PTC‐treated HaCaT cells. HaCaT cells were treated with 1 mM PTC for 15 h in the presence or absence of a ROCK‐blocker or p38 MAPK‐inhibitor, and total RNA was extracted. Real‐time PCR analysis of the chemokines was performed using the cDNAs as templates n = 4. (C) Expression of ABCB1, ABCC1, and ABCG2 in differentiated HaCaT cells. HaCaT cells were differentiated using 1 mM CaCl2 for 3 days. On Days 0 and 3, total RNAs were extracted. Real‐time PCR analysis of ABCB1, ABCC1, and ABCG2 was performed using the cDNAs as templates n = 4. (D) Expression of ABCB1, ABCC1, and ABCG2 in differentiated HaCaT cells stimulated with or without 1 mM PTC for 15 h. Real‐time PCR analysis of ABCB1, ABCC1, and ABCG2 was performed using the cDNAs as templates n = 4. (E) Expression of ABCB1, ABCC1, and ABCG2 in differentiated HaCaT cells treated with or without 1 mM PROP for 15 h. Real‐time PCR analysis of ABCB1, ABCC1, and ABCG2 was performed using the cDNAs as templates n = 4. (F) Western blotting of ABCB1 in the membrane fractions from differentiated HaCaT cells stimulated with 1 mM PTC or 1 mM PROP for 15 h. β‐Actin was employed as an experimental and loading control. (G) Expression of ABCB1 in PTC‐treated HaCaT cells. HaCaT cells were treated with 1 mM PTC for 15 h in the presence or absence of a ROCK‐blocker or a p38 MAPK‐inhibitor, and total RNAs were extracted. Real‐time PCR analysis of ABCB1 was performed using cDNAs as templates n = 4. (H) Involvement of p38 MAPK in the induction of ABCB1 production in HaCaT cells following stimulation with 1 mM PTC or 1 mM PROP. β‐Actin was employed as an experimental and loading control. (I) Expression of ABCB1, ABCC1, and ABCG2 in differentiated NHK cells. NHK cells were differentiated using 1 mM CaCl2 for 3 days. On Day 3, the cells were stimulated with 1 mM PTC or 1 mM PROP for 15 h and total RNA was extracted. Real‐time PCR analysis of ABCB1, ABCC1, and ABCG2 was performed using the cDNAs as templates n = 4. Data are expressed as mean ± SEM. *p < 0.05, **p < 0.01 using two‐way ANOVA followed by Tukey's post hoc test (A, B, G, I). *p < 0.05, **p < 0.01 using Student's t‐test (C–E). (J) Schematic model of the signaling pathway via TAS2Rs. After stimulation of TAS2Rs by bitter compounds, the Gα12/13/RhoA/ROCK/p38 MAPK/NF‐κB pathway is activated, and the expression levels of several ABC transporters, including ABCB1, are increased.
FIGURE 6
FIGURE 6
Enhanced activation of ABCB1 in bitter compound‐exposed HaCaT cells. (A) Increased expression of TAS2R14 and TAS2R38 in HaCaT cells cultured in the presence of 1 mM PTC for 0.5 or 30 days n = 4. (B) Increased ABCB1 expression in HaCaT cells cultivated in the presence of 1 mM PTC for 0.5 or 30 days n = 4. (C) Accumulation of rhodamine 123 in HaCaT and HaCaT/PTC cells. The cells (2 × 105 cells) were seeded into collagen‐coated glass‐bottomed 35 mm dishes. Intracellular retention was evaluated by incubating 10 μM rhodamine 123 for 1 h in the dark at 37°C in the presence or absence of 20 μM verapamil. After the cells were washed, images were acquired using fluorescence microscopy at 488 nm excitation and 535 nm emission wavelength. Scale bar, 100 μm. (D) Accumulation of rhodamine 123 in HaCaT/PTC cells by treatment with verapamil. Fluorescence intensities were determined using the ImageJ software n = 5. (E) Toxicity of DPH in HaCaT cells was determined using a Zombie Red Fixable Viability Kit. After the cells were washed, their fluorescence intensities were determined using flow cytometry n = 4. (F) Western blot of ABCB1 in the membrane fractions from HaCaT, HaCaT/PTC, and HaCaT/saccharin cells. β‐actin was employed as an experimental and loading control. (G) Effects of DPH on cell growth. HaCaT, HaCaT/PTC, and HaCaT/saccharin cells (2 × 104 cells/mL) were cultured in the presence or absence of 50 μM DPH for 6 days n = 6. (H) Inhibition of HaCaT/PTC and HaCaT/saccharin cell growth by verapamil. HaCaT, HaCaT/PTC, and HaCaT/saccharin cells (2 × 104 cells/mL) were cultured in the presence or absence of 50 μM DPH and 20 μM verapamil, for 6 days n = 6. Data are expressed as mean ± SEM. *p < 0.05, **p < 0.01, ***p < 0.001 using two‐way ANOVA followed by Tukey's post hoc test (A, B, D, G, H).
FIGURE 7
FIGURE 7
Schematic model of the excretion of harmful substances by the activation of the intracellular TAS2Rs. Activation of intracellular TAS2Rs enhances ABCB1 expression, leading to the prevention of cellular damage. For example, harmless activators of TAS2Rs may be used as protective agents against harmful substances to protect the human skin.

References

    1. Adler E, Hoon MA, Mueller KL, Chandrashekar J, Ryba NJ, Zuker CS. A novel family of mammalian taste receptors. Cell. 2000;100:693‐702. - PubMed
    1. Mueller KL, Hoon MA, Erlenbach I, Chandrashekar J, Zuker CS, Ryba NJ. The receptors and coding logic for bitter taste. Nature. 2005;434:225‐229. - PubMed
    1. Bachmanov AA, Beauchamp GK. Taste receptor genes. Annu Rev Nutr. 2007;27:389‐414. - PMC - PubMed
    1. Shaw L, Mansfield C, Colquitt L, et al. Personalized expression of bitter ‘taste’ receptors in human skin. PLoS One. 2018;13:e0205322. - PMC - PubMed
    1. Meyerhof W, Batram C, Kuhn C, et al. The molecular receptive ranges of human TAS2R bitter taste receptors. Chem Senses. 2010;35:157‐170. - PubMed

LinkOut - more resources