. 2024 Oct 15:498:155633.
doi: 10.1016/j.cej.2024.155633. Epub 2024 Sep 12.

Peptide-coated DNA nanostructures as a platform for control of lysosomal function in cells

Affiliations

Peptide-coated DNA nanostructures as a platform for control of lysosomal function in cells

Petra Elblová et al. Chem Eng J. .

Abstract

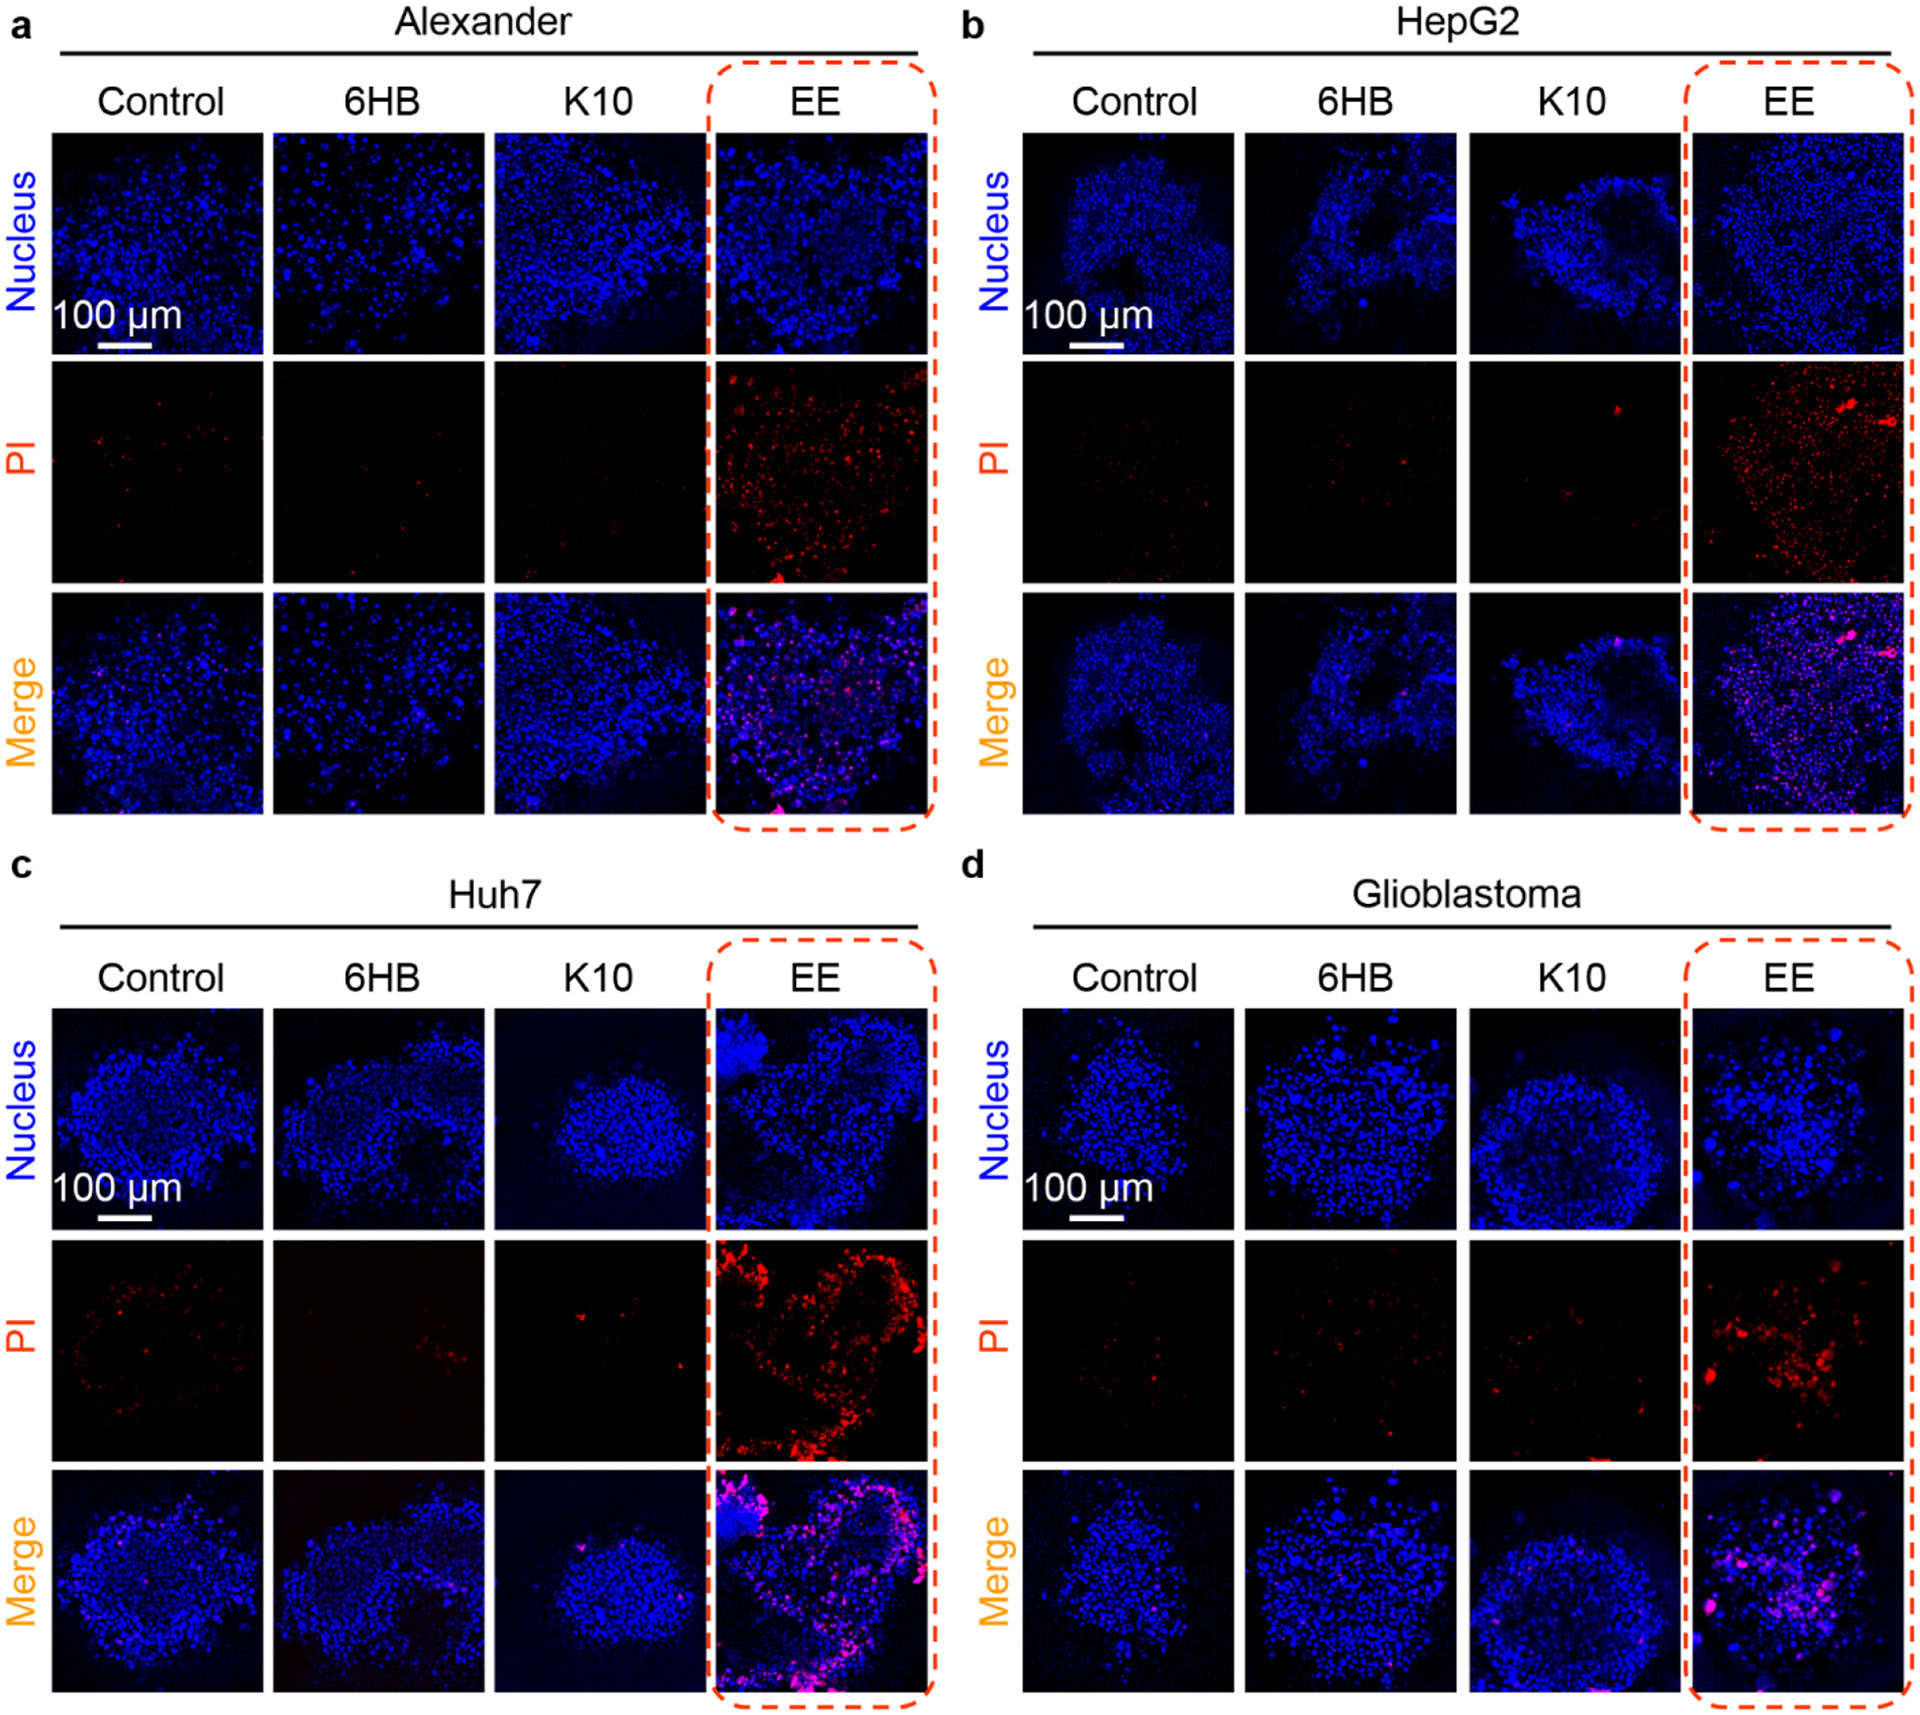
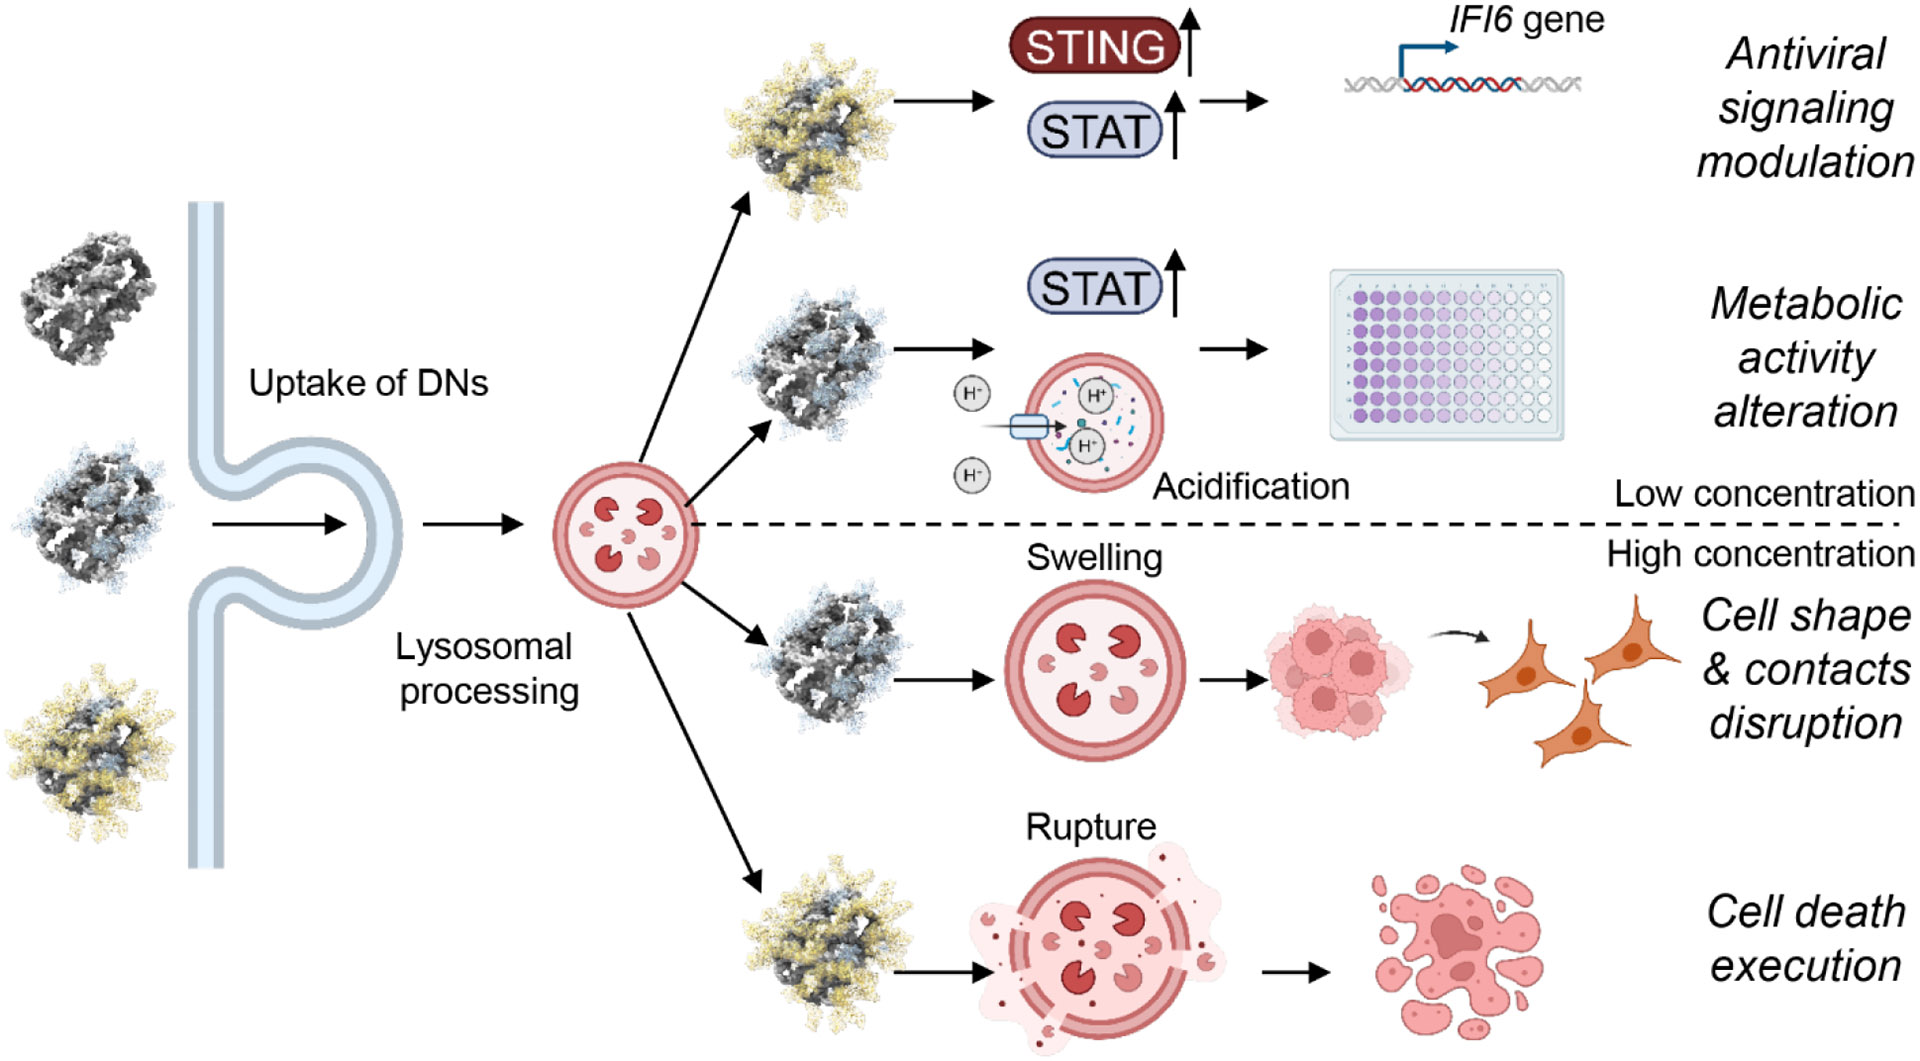
DNA nanotechnology is a rapidly growing field that provides exciting tools for biomedical applications. Targeting lysosomal functions with nanomaterials, such as DNA nanostructures (DNs), represents a rational and systematic way to control cell functionality. Here we present a versatile DNA nanostructure-based platform that can modulate a number of cellular functions depending on the concentration and surface decoration of the nanostructure. Utilizing different peptides for surface functionalization of DNs, we were able to rationally modulate lysosomal activity, which in turn translated into the control of cellular function, ranging from changes in cell morphology to modulation of immune signaling and cell death. Low concentrations of decalysine peptide-coated DNs induced lysosomal acidification, altering the metabolic activity of susceptible cells. In contrast, DNs coated with an aurein-bearing peptide promoted lysosomal alkalization, triggering STING activation. High concentrations of decalysine peptide-coated DNs caused lysosomal swelling, loss of cell-cell contacts, and morphological changes without inducing cell death. Conversely, high concentrations of aurein-coated DNs led to lysosomal rupture and mitochondrial damage, resulting in significant cytotoxicity. Our study holds promise for the rational design of a new generation of versatile DNA-based nanoplatforms that can be used in various biomedical applications, like the development of combinatorial anti-cancer platforms, efficient systems for endolysosomal escape, and nanoplatforms modulating lysosomal pH.

Keywords: DNA nanotechnology; Interferon; Lysosomal rupture; Nanotechnology; bio/nano interactions; lysosome interference.


Figures

Fig. 1.
Fig. 1.
Design of functionalized DNA nanostructures for control over lysosomal activity in cells. (a) Scheme of DN synthesis and peptide coating. (b) Schematic representation of DN-driven impact on lysosomal function. Created with BioRender.com.
Fig. 2.
Fig. 2.
Characterization of functionalized DNA nanostructures. (a) Agarose gel electrophoresis (1.5% agarose) used to determine the synthesis efficacy of the 6 helix bundle (6HB). (b) Agarose gel electrophoresis (1.5% agarose) used to determine the coating of 6HB with K10 and EE peptides. (c) Characterization of the particles dissolved in PBS measured with a Zetasizer Nano (Malvern Instruments). Full data on size distribution is presented in Fig. S2 of Supplemental Materials. (d) AFM characterization of the DNs. Scale bar is 200 nm.
Fig. 3.
Fig. 3.
Functionalized DNA nanostructures affect the total metabolic activity of cells. The total metabolic activity of Alexander (a), HepG2 (b) and Huh7 (c) cells was checked with an alamarBlue assay. Cells were treated with different DNs (10, 100 and 500 nM) for 24, 48 and 72 h. The data were normalized to control values (no DN particle exposure), which were set as 100% of the total metabolic activity of cells. Control cells were untreated. As a positive control, cells were treated with 20% ethanol for 30 min. Data are expressed as means ± SEM (n = 3). (*) P < 0.05, (**) P < 0.01 and (***) P < 0.001 denote statistically significant differences.
Fig. 4.
Fig. 4.
Functionalized DNA nanostructures affect the viability of cells. The viability of Alexander (a), HepG2 (b) and Huh7 (c) cells was checked using propidium iodide. Cells were treated with different DNs (10, 100 and 500 nM) for 24, 48 and 72 h. After the treatment, cells were stained with propidium iodide (PI) and nuclei were counterstained with Hoechst 33342. Labeled cells were then imaged by confocal microscopy, and the numbers of dead (PI-positive) cells and total number (Hoechst-stained) of cells were counted using the ImageJ software (NIH). The viability was expressed as the ratio of PI-negative cells to total cells. As a positive control, cells were treated with 20% ethanol for 60 min. Data are expressed as means ± SEM (n = 3). (***) P < 0.001 denotes statistically significant differences.
Fig. 5.
Fig. 5.
Lysosomal degradation of DNA nanostructures. (a) Schematic presentation of principle of FRET microscopy analysis of DNA nanostructures degradation. Intact nanostructures labeled with FRET reporter dyes (6-carboxyfluorescein donor and TAMRA acceptor) show a high FRET index, whereas degradation of nanostructures leads to the increase in distance between donor and acceptor dyes, lowering the FRET index. (b) Quantification of FRET index images in mean gray values. Confocal images were taken and analyzed for FRET using the “FRET and colocalization analyzer” ImageJ plug-in [50]. “Colocalized FRET index” images present the calculated amount of FRET for each pixel in the FRET channel. Mean gray values of resultant “colocalized FRET index” images were measured using the ImageJ software (NIH). Representative images are shown in Supplementary Figures S6, S7, and S8. (c) Pearson coefficient statistics for analyzing the colocalization of DNs with lysosomes. Cells (Alexander, HepG2 or Huh7) were treated with different types of DNs (at 50 nM concentration) for either 24 or 48 h. After incubation, cells were labeled with lysosomal marker LysoTracker Blue DND-22 (Thermo Fisher Scientific). Stained cells were imaged using spinning disk confocal microscopy IXplore SpinSR (Olympus, Tokyo, Japan). The Pearson correlation coefficient for fluorophore pairs DNA–Lysosomes was calculated using the Coloc 2 tool available in ImageJ software (NIH) and is presented as means of n = 30-70 cells. (***) P < 0.001 denotes significant differences. Representative images are shown in supplementary Figures S10, S11, and S12. Violin plots were created using open-source software (http://www.bioinformatics.com.cn/login_en/). (d) Colocalization analysis of different DNs after 48 h of treatment. Cells were treated and processed as described in (c).
Fig. 6.
Fig. 6.
Lysosome interference caused by DNA nanostructures. (a) Quantification of fluorescence intensity of LysoSensor from images in Supplementary Figure S9. Cells (Alexander, HepG2 or Huh7) were treated with different types of DNs (at 50 nM concentration) for either 24 or 48 h. After incubation, cells were labeled with lysosomal pH marker LysoSensor Blue DND-167 (Thermo Fisher Scientific). Stained cells were imaged using spinning disk confocal microscopy IXplore SpinSR (Olympus, Tokyo, Japan). The fluorescence intensity of LysoSensor was quantified using the ImageJ software (NIH). Data collected from n = 50 cells out of three independent experiments. (*) P < 0.05, (**) P < 0.01 and (***) P < 0.001 denote statistically significant differences. (b) Lysosomal integrity as measured by acridine orange (AO) red fluorescence decrease. Cells (Alexander, HepG2 or Huh7) were treated with different types of DNs (at 50 nM concentration) for either 24 or 48 h, stained with 5 μg/ml acridine orange (AO). After staining the fluorescence intensity was measured using a fluorescent microplate reader. Data are expressed as means ± SEM (n = 4). (**) P < 0.01 and (***) P < 0.001 denote statistically significant differences.
Fig. 7.
Fig. 7.
Effects of functionalized DNA nanostructures on lysosomal size. (a) Representative super-resolution images of lysosomes in living Alexander, HepG2 and Huh7 cells. Cells (Alexander, HepG2 or Huh7) were treated with different types of DNs (at 50 nM concentration) for either 24 or 48 h. To visualize lysosomes, cells transduced with CellLight® LAMP1-RFP. The original overview images are shown in Supplementary Figure S14. (b) Quantification of lysosomal size and circularity. Cells (Alexander, HepG2 or Huh7) were treated with different types of DNs (at 50 nM concentration) for either 24 or 48 h. To visualize lysosomes, cells were transduced with CellLight® LAMP1-RFP. Nuclei were counterstained with Hoechst 33342. Labeled cells were then imaged by confocal microscopy. Representative images are shown in Supplementary Figure S15. Lysosomal size and circularity were measured using the ImageJ software (NIH), n = 50 cells. (**) P < 0.01 and (***) P < 0.001 denote statistically significant differences.
Fig. 8.
Fig. 8.
Immunostimulatory effects of functionalized DNA nanostructures. (a) Relative expression of IFI6 determined in Alexander, HepG2 and Huh7 cells 48 h after treatment with different DNs at 10 and 50 nM concentrations. GAPDH was used as internal control. Results are presented as mean ± SEM (n = 3). Differences were considered significant at (**) P < 0.01 and (***) P < 0.001. Transfection with IFNL4 was used as positive control. (b) The activation of JAK-STAT signaling was determined by immunoblot analysis of Alexander, HepG2 and Huh7 cells 48 h after treatment with different DNs at 50 nM concentration; β-actin served as the loading control. (c) The graphs show the densitometric quantification of p-STAT1/STAT1 ratio of immunoblots. Results are presented as mean ± SEM (n = 3). Differences were considered significant at (*) P < 0.05, (**) P < 0.01 and (***) P < 0.001.
Fig. 9.
Fig. 9.
Functionalized DNA nanostructures upregulate STING expression in hepatic cells. (a) The expression of STING was determined by immunoblot analysis of Alexander, HepG2 and Huh7 cells 48 h after treatment with different DNs at 50 nM concentration; β-actin served as the loading control. (b) The graphs show the densitometric quantification of STING immunoblots. Results are presented as mean ± SEM (n = 3). Differences were considered significant at (*) P < 0.05. (c) Schematics of the immunostimulatory effects of functionalized DNA nanostructures. Created with BioRender.com.
Fig. 10.
Fig. 10.
Functionalized DNA nanostructures induce cell death in liver cancer cells. (a) Cells (Alexander, HepG2 or Huh7) were treated with different types of DNs (at 500 nM concentration) for 48 h. After treatment, cells were stained with propidium iodide (PI) and nuclei were counterstained with Hoechst 33342. Labeled cells were then imaged by confocal microscopy. The blue dashed rectangle highlights cell scattering, and the red dashed rectangle indicates cellular toxicity. The original overview images are shown in Supplementary Figures S18, S19 and S20. (b) Cells (Alexander, HepG2 or Huh7) were treated with different types of DNs (at 500 nM concentration) for 48 h. After the treatment, cells were stained with CellMask Orange (red) and the nuclei were counterstained with Hoechst 33342 (blue). Labeled cells were then imaged by confocal microscopy. The white dashed rectangle shows zoomed region, the blue dashed rectangle highlights cells losing cell-cell contacts, and the red dashed rectangle indicates cells with compromised membrane integrity. The original overview images are shown in Supplementary Figure S21.
Fig. 11.
Fig. 11.
Functionalized DNA nanostructures affect the integrity of the lysosomal membrane in liver cancer cells. (a) Schematic of the lysosomal damage induced by aurein-coated DNA nanostructures. Created with BioRender.com. (b) Lysosomal integrity as measured by acridine orange (AO) red fluorescence decrease. Cells (Alexander, HepG2 or Huh7) were treated with different types of DNs (at 500 nM concentration) for 48 h, stained with 5 μg/ml acridine orange (AO). After staining, the fluorescence intensity was measured using a fluorescent microplate reader. As a positive control, cells were treated with 20% ethanol for 60 min. Data are expressed as means ± SEM (n = 3). (***) P < 0.001 denotes statistically significant differences. (c) Lysosomal integrity as measured by assessment of morphodynamical changes in LysoTracker Red. Cells (Alexander, HepG2 or Huh7) were treated with different types of DNs (at 500 nM concentration) for 48 h, stained with LysoTracker Red and nuclei were counterstained with Hoechst 33342 (blue). Labeled cells were then imaged by confocal microscopy. As a positive control, cells were treated with 20% ethanol for 60 min.
Fig. 12.
Fig. 12.
Effects of peptides on functionality of liver cancer cells. (a) The total metabolic activity of Alexander, HepG2 and Huh7 cells was checked with an alamarBlue assay. Cells were treated with either K10 or EE peptides (500 nM and 15 μM) for 24, 48 and 72 h. The data were normalized to control values (no peptide exposure), which were set as 100% of the total metabolic activity of cells. Control cells were untreated. As a positive control, cells were treated with 20% ethanol for 30 min. Data are expressed as means ± SEM (n = 3). (***) P < 0.001 denote statistically significant differences. (b) Comparison of cytotoxic effect elicited by EE DNs and EE peptide. The viability of Alexander, HepG2 and Huh7 cells was checked using propidium iodide. Cells were treated with either EE DNs (500 nM) or EE peptide (500 nM and 15 μM) for 48 h. After the treatment, cells were stained with propidium iodide (PI) and nuclei were counterstained with Hoechst 33342. Labeled cells were then imaged by confocal microscopy, and the numbers of dead (Pi-positive) cells and total number (Hoechst-stained) of cells were counted using the ImageJ software (NIH). The viability was expressed as the ratio of Pi-negative cells to total cells. As a positive control, cells were treated with 20% ethanol for 60 min. Data are expressed as means ± SEM (n = 3). (***) P < 0.001 denotes statistically significant differences. (c) Lysosomal integrity as measured by acridine orange (AO) red fluorescence decrease. Cells (Alexander, HepG2 or Huh7) were treated with either EE DNs (500 nM) or EE peptide (500 nM and 15 μM) for 48 h, stained with 5 μg/ml acridine orange (AO). After staining, the fluorescence intensity was measured using a fluorescent microplate reader. As a positive control, cells were treated with 20% ethanol for 60 min. Data are expressed as means ± SEM (n = 3). Differences were considered significant at (*) P < 0.05, (**) P < 0.01 and (***) P < 0.001.
Fig. 13.
Fig. 13.
Functionalized DNA nanostructures affect mitochondria in liver cancer cells. Cells, Alexander (a), HepG2 (b) or Huh7 (c), were treated with different types of DNs (at 50 and 500 nM concentrations) for 48 h, stained with 5 μM MitoSOX for 10 min and analyzed by flow cytometry. Positive control 1 mM H2O2 for 60 min was used. The red dashed rectangle indicates cells with elevated mitochondrial ROS.
Fig. 14.
Fig. 14.
Aurein-coated DNA nanostructures induce profound cell death in different cancer multicellular aggregates. Multicellular aggregates of Alexander (a), HepG2 (b), Huh7 (c) and glioblastoma (d) cell lines were treated with different types of DNs (at 500 nM concentration) for 48 h. After the treatment multicellular aggregates were stained with propidium iodide (PI) and nuclei were counterstained with Hoechst 33342. Labeled cells were then imaged by confocal microscopy. Representative images out of four independent replicates.
Fig. 15.
Fig. 15.
Scheme of the controlled modulation of lysosomal functions by functionalized DNA nanostructures. Created with BioRender.com.

References

    1. Youden B, Jiang RQ, Carrier AJ, Servos MR, Zhang X, A nanomedicine structure-activity framework for research, development, and regulation of future cancer therapies, ACS Nano 16 (11) (2022) 17497–17551, 10.1021/acsnano.2c06337. - DOI - PubMed
    1. Bhatia SN, Chen XY, Dobrovolskaia MA, Lammers T, Cancer nanomedicine, Nat. Rev. Cancer 22 (10) (2022) 550–556, 10.1038/s41568-022-00496-9. - DOI - PMC - PubMed
    1. Mitchell MJ, Billingsley MM, Haley RM, Wechsler ME, Peppas NA, Langer R, Engineering precision nanoparticles for drug delivery, Nat. Rev. Drug Discov 20 (2) (2021) 101–124, 10.1038/s41573-020-0090-8. - DOI - PMC - PubMed
    1. Sigismund S, Lanzetti L, Scita G, Di Fiore PP, Endocytosis in the context-dependent regulation of individual and collective cell properties, Nat. Rev. Mol. Cell Biol 22 (9) (2021) 625–643, 10.1038/s41580-021-00375-5. - DOI - PubMed
    1. Saftig P, Klumperman J, Lysosome biogenesis and lysosomal membrane proteins: trafficking meets function, Nat. Rev. Mol. Cell Biol 10 (9) (2009) 623–635, 10.1038/nrm2745. - DOI - PubMed

LinkOut - more resources