. 2024 Sep 20:15:1448629.
doi: 10.3389/fmicb.2024.1448629. eCollection 2024.

Unveiling genetic links between gut microbiota and asthma: a Mendelian randomization

Affiliations

Unveiling genetic links between gut microbiota and asthma: a Mendelian randomization

XuWen Zheng et al. Front Microbiol. .

Abstract

Background: Multiple studies suggest a potential connection between the gut microbiome and asthma. Our objective is to use advanced genetic and metagenomic techniques to elucidate the causal relationships and underlying mechanisms between gut microbiota and asthma.

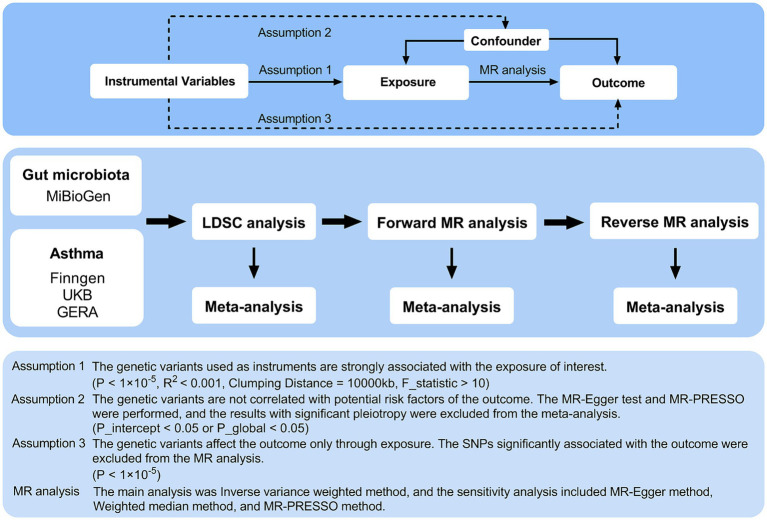
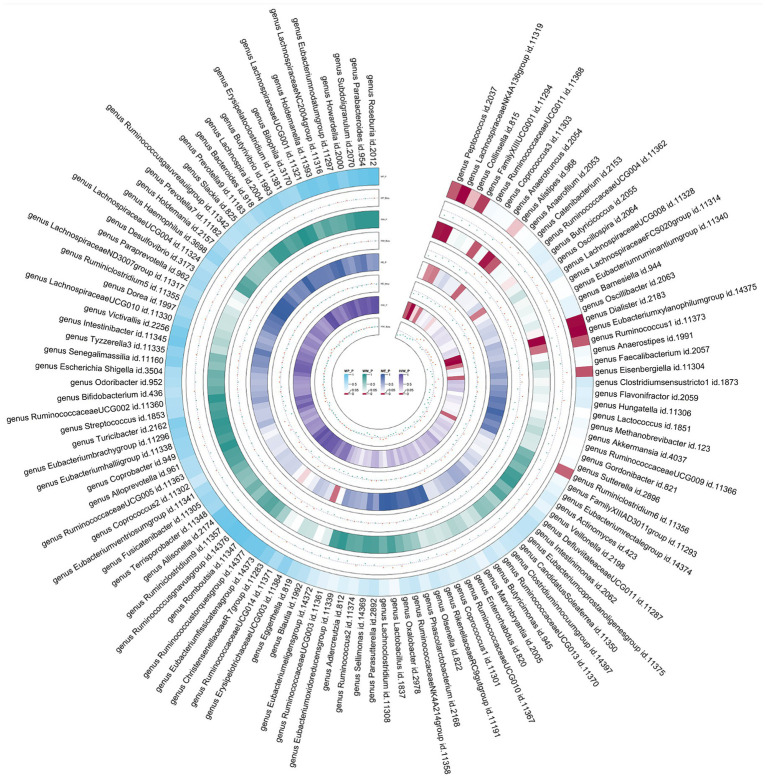
Methods: The study utilized comprehensive Linkage Disequilibrium Score Regression (LDSC) and Mendelian randomization (MR) analyses to examine the relationship between 119 gut microbiota genera and asthma, using publicly accessible genome-wide association studies (GWAS). The meta-analysis synthesized summary effect estimates obtained from LDSC, forward MR, and reverse MR. The MiBioGen collaboration, involving 18,340 individuals, identified genetic variations associated with gut bacteria. Asthma data were collected from the UK Biobank, FinnGen, and GERA, encompassing a total of 82,060 cases and 641,049 controls.

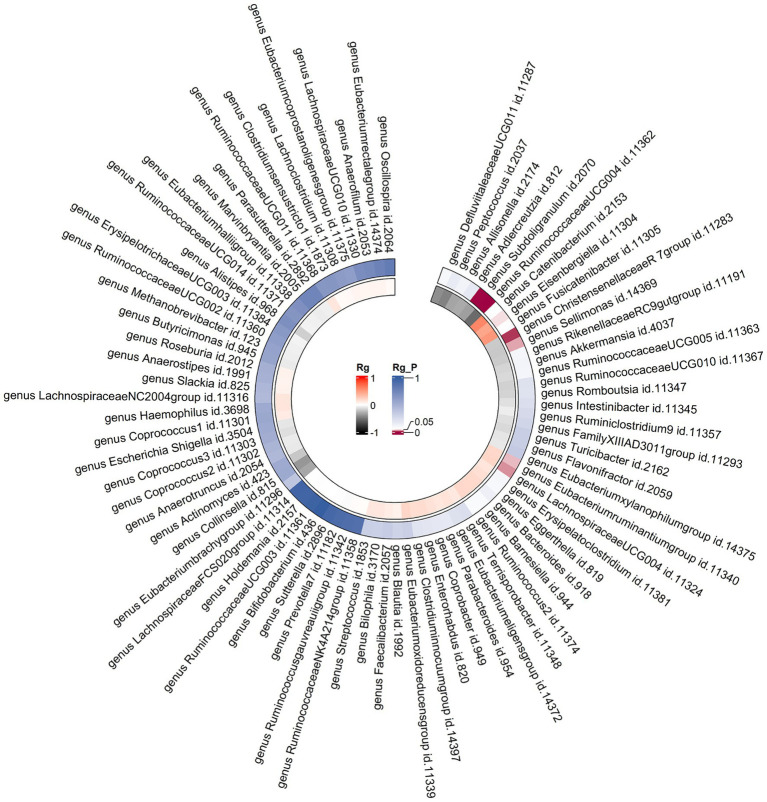
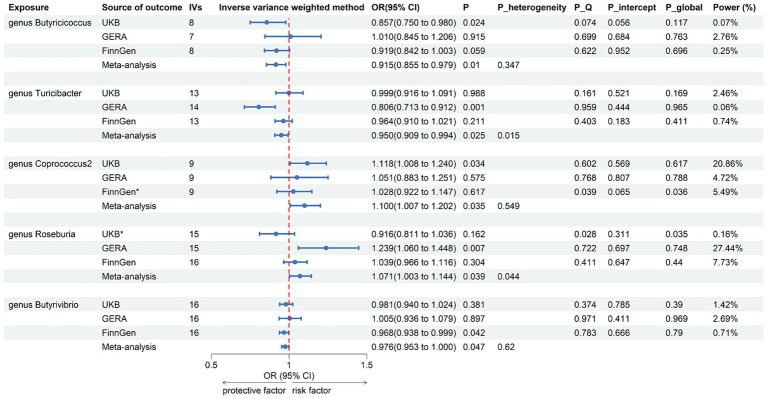
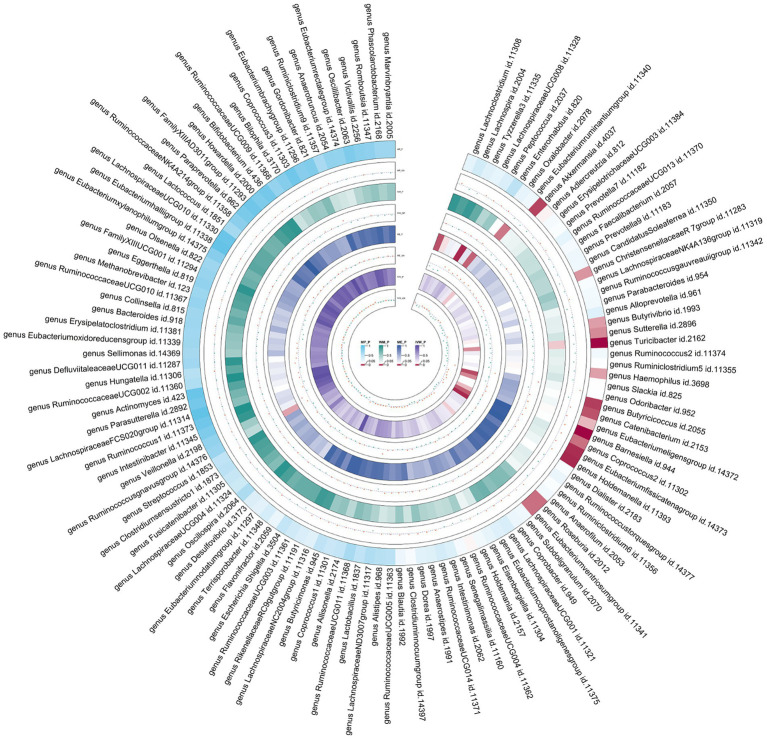
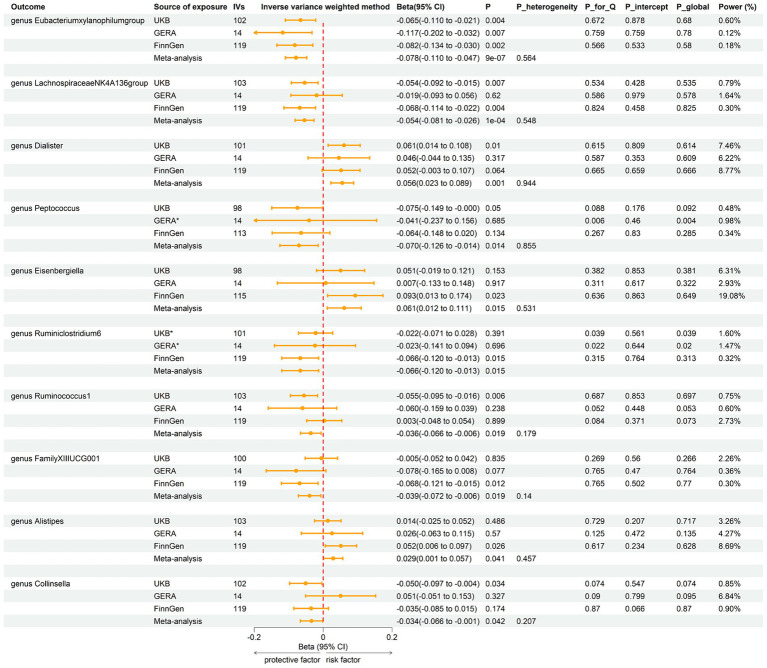
Results: LDSC analysis revealed significant negative genetic correlations between asthma and RuminococcaceaeUCG004 (Rg = -0.55, p = 7.66 × 10⁻⁵) and Subdoligranulum (Rg = -0.35, p = 3.61 × 10⁻⁴). Forward MR analysis suggested associations between Butyricicoccus (OR = 0.92, p = 0.01), Turicibacter (OR = 0.95, p = 0.025), Butyrivibrio (OR = 0.98, p = 0.047), and reduced asthma risk. Conversely, Coprococcus2 (OR = 1.10, p = 0.035) and Roseburia (OR = 1.07, p = 0.039) were associated with increased risk. Reverse MR analysis indicated significant associations between genetically predicted asthma and Eubacteriumxylanophilumgroup (Beta = -0.08, p = 9.25 × 10⁻⁷), LachnospiraceaeNK4A136group (Beta = -0.05, p = 1.26 × 10⁻⁴), and Eisenbergiella (Beta = 0.06, p = 0.015, Rg_P = 0.043).

Conclusion: The findings underscore significant genetic correlations and causal relationships between specific gut microbiota and asthma. These insights highlight the potential of gut microbiota as both markers and modulators of asthma risk, offering new avenues for targeted therapeutic strategies.

Keywords: Linkage Disequilibrium Score Regression; Mendelian randomization; asthma; gut microbiota; meta-analysis.


Conflict of interest statement

The authors declare that the research was conducted in the absence of any commercial or financial relationships that could be construed as a potential conflict of interest.

Figures

Figure 1
Figure 1
Three assumptions of MR analysis and overview of the study design. MR, Mendelian randomization; GERA, Genetic Epidemiology Research on Aging; LDSC, Linkage Disequilibrium Score Regression; MR-PRESSO, MR pleiotropy residual sum and outlier; SNPs, single nucleotide polymorphisms.
Figure 2
Figure 2
Circular heat map of meta-analysis of genetic correlation between gut microbiota and asthma. Rg, estimate of genetic correlation; Rg_P, p-value for Rg.
Figure 3
Figure 3
Forest plot of associations in forward MR analysis. IVs, instrumental variables; CI, confident interval; P_heterogeneity, p-value of heterogeneity for meta-analysis; P_Q, p-value for Cochran Q test; P_intercept, p-value for MR-Egger intercept test; P_global, p-value for Global test; *, excluded from the meta-analysis due to SNPs less than 4 or significant pleiotropy.
Figure 4
Figure 4
Circular heat map of meta-analysis of forward MR analysis between gut microbiota and asthma. IVW, Inverse-Variance Weighted; ME, MR-Egger; WM, Weighted median; MP, MR-PRESSO. The color variations represented the size of the p-value. The scatter plots reflect OR, with OR > 1 labeled red and OR < 1 labeled green.
Figure 5
Figure 5
Forest plot of associations in reverse MR analysis. IVs, instrumental variables; CI, confident interval; P_heterogeneity, p-value of heterogeneity for meta-analysis; P_Q, p-value for Cochran Q test; P_intercept, p-value for MR-Egger intercept test; P_global, p-value for Global test; *, excluded from the meta-analysis due to SNPs less than 4 or significant pleiotropy.
Figure 6
Figure 6
Circular heat map of meta-analysis of reverse MR analysis between gut microbiota and asthma. IVW, Inverse-Variance Weighted; ME, MR-Egger; WM, Weighted median; MP, MR-PRESSO. The color variations represented the size of the p-value. The scatter plots reflect Beta, with Beta > 0 labeled red and Beta < 0 labeled green.

Similar articles

Cited by

References

    1. Balmes J. R. (1993). The role of ozone exposure in the epidemiology of asthma. Environ. Health Perspect. 101, 219–224. doi: 10.1289/ehp.93101s4219, PMID: - DOI - PMC - PubMed
    1. Barcik W., Boutin R. C. T., Sokolowska M., Finlay B. B. (2020). The role of lung and gut microbiota in the pathology of asthma. Immunity 52, 241–255. doi: 10.1016/j.immuni.2020.01.007, PMID: - DOI - PMC - PubMed
    1. Bisgaard H., Chawes B., Stokholm J., Mikkelsen M., Schoos A.-M. M., Bønnelykke K. (2023). 25 years of translational research in the Copenhagen prospective studies on asthma in childhood (COPSAC). J. Allergy Clin. Immunol. 151, 619–633. doi: 10.1016/j.jaci.2022.11.022 - DOI - PubMed
    1. Boulet L.-P., Reddel H. K., Bateman E., Pedersen S., FitzGerald J. M., O’Byrne P. M. (2019). The global initiative for asthma (GINA): 25 years later. Eur. Respir. J. 54:1900598. doi: 10.1183/13993003.00598-2019 - DOI - PubMed
    1. Bowden J., Davey Smith G., Haycock P. C., Burgess S. (2016). Consistent estimation in Mendelian randomization with some invalid instruments using a weighted median estimator. Genet. Epidemiol. 40, 304–314. doi: 10.1002/gepi.21965, PMID: - DOI - PMC - PubMed

LinkOut - more resources