. 2024 Jul 30;11(10):uhae208.
doi: 10.1093/hr/uhae208. eCollection 2024 Oct.

Nitrogen reduces calcium availability by promoting oxalate biosynthesis in apple leaves

Affiliations

Nitrogen reduces calcium availability by promoting oxalate biosynthesis in apple leaves

Yue Xing et al. Hortic Res. .

Abstract

N and Ca are essential nutrients for apple growth and development. Studies have found that Ca content was not low under high N conditions but was poorly available. However, the underlying physiological mechanism through which N regulates Ca availability remains unclear. In this study, apple plants were supplied with N and Ca to analyse the content, in situ distribution, and forms of Ca using noninvasive micro-test technique, electron probe microanalysis, Fourier transform infrared spectroscopy, and transcriptome analysis. A potential interaction was observed between N and Ca in apple leaves. The application of high N and Ca concentration led to a CaOx content of 12.51 g/kg, representing 93.54% of the total Ca in the apple leaves. Electron probe microanalysis revealed that Ca deposited in the phloem primarily existed as CaOx rhombus-shaped crystals. Additionally, high N positively regulated oxalate accumulation in the leaves, increasing it by 40.79 times compared with low N concentration. Specifically, N induced oxalate synthesis in apple leaves by upregulating the MdICL, MdOXAC, and MdMDH genes, while simultaneously inhibiting degradation through downregulation of the MdAAE3 gene. Transcriptome and correlation analyses further confirmed oxaloacetate as the precursor for the synthesis of CaOx crystals in the apple leaves, which were produced via the 'photosynthesis/glycolysis -oxaloacetate -oxalate -CaOx' pathway. WGCNA identified potential regulators of the CaOx biosynthesis pathway triggered by N. Overall, the results provide insights into the regulation of Ca availability by N in apple leaves and support the development of Ca efficient cultivation technique.


Conflict of interest statement

The authors declare no conflict of interest.

Figures

Figure 1
Figure 1
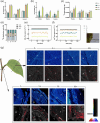
Effects of N and Ca supply on phenotype and antioxidant metabolism in apple leaves. L−: low N without Ca (0.5 mM NO3 + 0 mM Ca), L+: low N with Ca (0.5 mM NO3 + 5 mM Ca), H−: high N without Ca (10 mM NO3 + 0 mM Ca), and H+: high N with Ca (10 mM NO3 + 5 mM Ca). (a) Leaf phenotype; (b) leaf area and chlorophyll content; (c) leaf staining with Nitro-blue tetrazolium (NBT) and 3, 3′-Diaminobenzidine (DAB); (d) hydrogen ion secretion in root; (e) rhizosphere pH value; (f) catalase (CAT) activity; (g) maleic dialdehyde (MDA) activity; (h) superoxide dismutase (SOD) activity; (i) H2O2 activity; (j) peroxidase (POD) activity; (k) relative conductivity; (l) O2 productivity.
Figure 2
Figure 2
Contents and localization of N and Ca. (a) N content in plants; (b) Ca content in plants; (c) 15 N uptake; (d)  15N allocation rate; (e) NO3 flow rate in leaf mesophyll cells; (f) Ca2+ flow rate and real-time electrode images of leaf mesophyll cells; (g) schematic showing sampling sites. In situ localization of N and Ca in leaves and cross section of the stem node. The secondary electron image is combined with the image of the localization of the X-ray Ca spectrum signal. The densities of N and Ca are represented by the color card and red dots, respectively. C, cortex; M, mesophyll cell; P, phloem; Pi, pith; V, vascular bundle; X, xylem. Scale =100 μm.
Figure 3
Figure 3
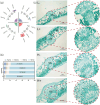
Qualitative and quantitative data related to Ca forms and the morphology and distribution of CaOx crystals in the apple leaves. (a) The content of Ca forms in apple leaves; (b) proportions of Ca forms present in apple leaves; (c) microscopy images of a leaf tissue section. Low magnification is shown on the left (scale = 100 μm), double magnification is shown on the right, and black arrow indicates CaOx crystals. M, leaf mesophyll; V, vascular bundle.
Figure 4
Figure 4
(a) FTIR spectroscopy of the apple leaves under the (i) L−, (ii) L+, (iii) H−, (iv) H+ treatments; (b) HPLC chromatograms and absorption peak areas; (c) plant oxalate content; (d) the curves shown in the plot represent power functions of N and oxalate contents.
Figure 5
Figure 5
RNA-Seq identification and functional enrichment analysis of the Gene Ontology (GO) and Kyoto Encyclopedia of Genes and Genomes (KEGG) of DEGs in apple leaves under N and Ca conditions. (a) Venn diagram of DEGs; (b) number of DEGs between different comparison groups; (c) the RNA-Seq and qRT-PCR results were subjected to correlation analysis based on 10 selected genes; (d) cluster analysis of 11 608 DEGs based on the K-means method; (e) KEGG analysis of DEGs in leaves under N and Ca conditions; (f) KEGG pathway (solid line) and associated pathway (dashed line); (g) GO enrichment analysis. The enrichment circle is divided into four circles from the outside to the inside. The first circle indicates the classification of enrichment, and the outside circle represents the coordinate scale of gene number. The color code in the second circle defines the P-value size, the number is the classification in the background gene; the third circle is a bar chart of the proportions of upregulated and downregulated genes; the fourth circle indicates the enrichment factor values.
Figure 6
Figure 6
(a) Contents of glyoxylate, oxaloacetate, and ascorbate as biosynthetic precursors of oxalate. (b) Pearson correlation between oxalate and its biosynthetic precursors, and schematic model of CaOx biosynthesis and degradation in plants (the pathway of CaOx biosynthesis under N stress is outlined in red, while the black line in bold denotes the degradation pathway). (c) Gene expression in the transcriptome during oxalate synthesis, degradation, and transport. The red and blue colors in the heat map indicate upregulation and downregulation, respectively.
Figure 7
Figure 7
(a) Photosynthetic indices (Pn, Tr, and Gs) and Fv/Fm parameters in apple leaves; C accumulation and 13C allocation in plants. (b) Expression of DEGs involved in photosynthesis. (c) Sucrose, fructose, citrate, and malate contents in leaves. (d) Expression patterns of DEGs involved in glycolysis and the TCA cycle. ALDOA, fructose-diphosphate aldolase; FH, fumarate hydrogenase; GAPDH, glyceraldehyde-3-phosphate dehydrogenase; MDH, malate dehydrogenase; PDH, pyruvate dehydrogenase; PFK, 6-phosphofructokinase; PK, pyruvate kinase; SCS, succinyl-CoA synthetase.
Figure 8
Figure 8
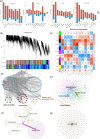
Differential expression of transcription factors and identification of oxalate-related gene co-expression modules based on WGCNA. (a) Number of DEGs associated with transcription factors in the comparison of the following treatments: H+ vs. L+, H− vs. L−, L+ vs. L−, and H+ vs. H−. The positive and negative values on the Y-axis indicate the number of upregulated and downregulated transcription factors, respectively. (b) hierarchical clustering tree showing the co-expression modules identified via WGCNA. Each leaf on the tree represents a gene, and 11 main modules labeled with different colors are visible. (c) Character-module association. Each row corresponds to a module, which is marked with a color. (d) Regulatory network of genes related to carboxylic acid metabolism in the blue module. The text represents the GO terms involved in the genes. (e) The top 10 most connected central genes in the blue module. (f) Transcriptional regulatory network of genes related to carboxylic acid metabolism in the black module. (g) Regulatory networks of the 10 most connected central genes in the turquoise module. Each circle represents a gene, the circle size indicates the level of the connectivity, and the core genes are labeled with text.

Similar articles

References

    1. Sun C, Zhang WW, Qu HY. et al. Comparative physiological and transcriptomic analysis reveal MdWRKY75 associated with sucrose accumulation in postharvest ‘Honeycrisp’ apples with bitter pit. BMC Plant Biol. 2022;22:71. - PMC - PubMed
    1. Wang WL, Cao ZM, Hou FR. et al. Quality maintenance mechanism of oxalic acid treatment in fresh-cut apple fruit during storage based on nontarget metabolomics analysis. Food Chem. 2024;436:137685. - PubMed
    1. Qiu L, Wang Y, Qu H. Loading calcium fluorescent probes into protoplasts to detect calcium in the flesh tissue cells of Malus domestica. Hortic Res. 2020;7:91. - PMC - PubMed
    1. Zhu ZL, Jia ZH, Peng L. et al. Life cycle assessment of conventional and organic apple production systems in China. J Clean Prod. 2018;201:156–68
    1. Freitas STD, Mitcham EJ. Mechanisms regulating apple cultivar susceptibility to bitter pit. Sci Hortic. 2015;186:54–60

LinkOut - more resources