. 2024 Sep 20:15:1467774.
doi: 10.3389/fimmu.2024.1467774. eCollection 2024.

Eed-dependent histone modification orchestrates the iNKT cell developmental program alleviating liver injury

Affiliations

Eed-dependent histone modification orchestrates the iNKT cell developmental program alleviating liver injury

Yun Guo et al. Front Immunol. .

Abstract

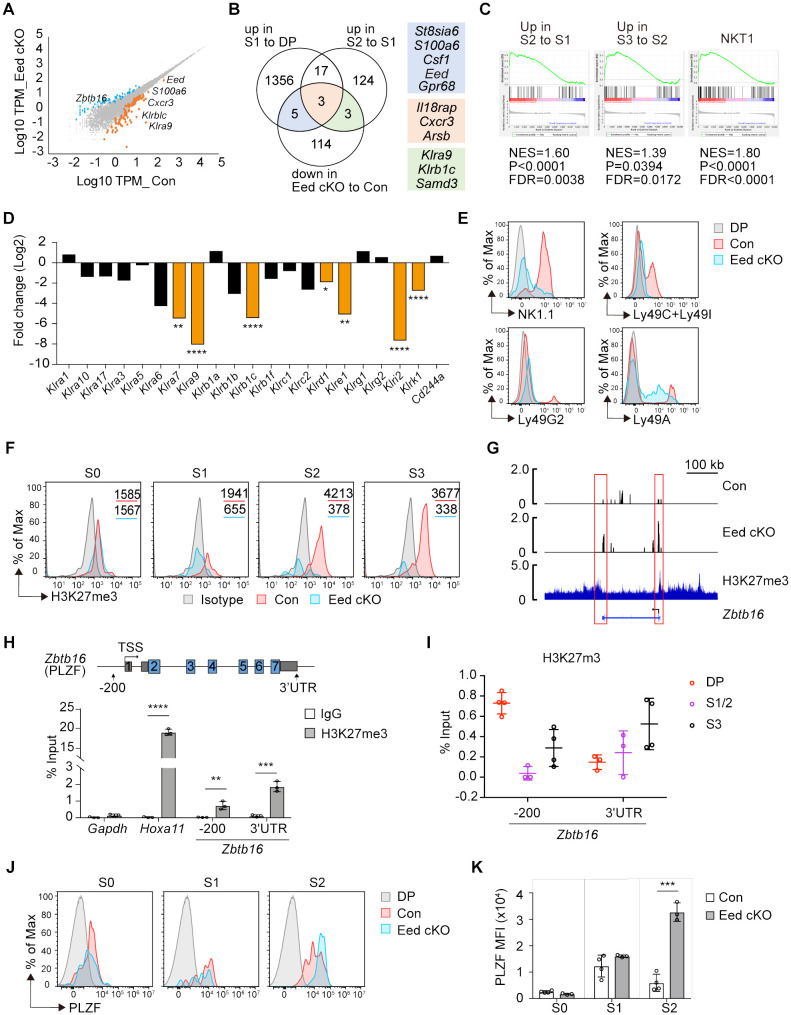
Polycomb repressive complex 2 (PRC2) is an evolutionarily conserved epigenetic modifier responsible for tri-methylation of lysine 27 on histone H3 (H3K27me3). Previous studies have linked PRC2 to invariant natural killer T (iNKT) cell development, but its physiological and precise role remained unclear. To address this, we conditionally deleted Eed, a core subunit of PRC2, in mouse T cells. The results showed that Eed-deficient mice exhibited a severe reduction in iNKT cell numbers, particularly NKT1 and NKT17 cells, while conventional T cells and NKT2 cells remained intact. Deletion of Eed disrupted iNKT cell differentiation, leading to increased cell death, which was accompanied by a severe reduction in H3K27me3 levels and abnormal expression of Zbtb16, Cdkn2a, and Cdkn1a. Interestingly, Eed-deficient mice were highly susceptible to acetaminophen-induced liver injury and inflammation in an iNKT cell-dependent manner, highlighting the critical role of Eed-mediated H3K27me3 marks in liver-resident iNKT cells. These findings provide further insight into the epigenetic orchestration of iNKT cell-specific transcriptional programs.

Keywords: Eed; H3K27me3; PRC2; iNKT; liver injury.


Conflict of interest statement

The authors declare that the research was conducted in the absence of any commercial or financial relationships that could be construed as a potential conflict of interest.

Figures

Figure 1
Figure 1
Eed is essential for iNKT cell development. (A) FACS analysis of H3K27me3 levels in the indicated thymic iNKT cell populations. The gray histogram indicates isotype control. S0, CD24+; S1, CD24-CD44-NK1.1-; S2, CD24-CD44+NK1.1-; and S3, CD24-CD44+NK1.1+ cells are gated on TCRβ+CD1d-Tet+. DP, CD4+CD8+. (B) Real-time PCR analysis of the expression of the PRC2 core members Ezh2, Eed, and Suz12 in the indicated T-cell subsets. Expression values were normalized to Ywhaz. DP, CD4+CD8+; 4SP, CD4+CD8-; 8SP, CD4-CD8+ from thymus. iNKT, TCRβ+CD1d-Tet+cells from thymus (Thy) and spleen (Spl). (C) Eed expression in the indicated cell populations of control (red) and Eed cKO (blue) mice. The values in each panel show the mean fluorescence intensity (MFI). DN, CD4-CD8-; DP, CD4+CD8+; 4SP, CD4+CD8-; and 8SP, CD4-CD8+ cells from thymus. (D, E) Representative FACS plots and absolute number of TCRβ+CD1d-Tet+ iNKT cells in the thymus, spleen, liver, and lung from control (n=3-4) and Eed cKO mice (n=4-5). (F) Representative FACS plots of the thymic iNKT populations from control and Eed cKO mice. Expression of CD44 and NK1.1 are analyzed on CD1d-Tet+CD24- fraction corresponding to S1-3 stages of iNKT cells. (G) Percentage and absolute cell number of the indicated cell populations from (F) of control (n=5) and Eed cKO mice (n=4). Data are mean ± SD with statistical significance determined by unpaired t-tests (E) or multiple t-test (G). p values are represented as **, <0.01; ***, <0.001; ****, <0.0001. Data are representative of at least two independent experiments.
Figure 2
Figure 2
Age-dependent and cell-intrinsic role of Eed in the development of iNKT cells. (A) Representative FACS plots of TCRβ+CD1d-Tet+ iNKT cells in the thymus of control and Eed cKO mice at postnatal day 4 (P4), 6 (P6), and 8 (P8). (B) Absolute numbers of total thymocytes and TCRβ+CD1d-Tet+ iNKT cells in the thymus of control and Eed cKO mice at P4 (n>3), P6 (n>5), and P8 (n>5). (C, D) Representative FACS plots, percentage, and absolute cell number of the indicated thymic iNKT populations from control and Eed cKO mice at P8. (E, F) E15.5 fetal thymic lobes were isolated from control or Eed cKO mice and cultured on FTOC condition. (E) Absolute number of TCRβ+CD1d-Tet+ iNKT cells in control and Eed cKO fetal thymus on days 9, 11, 13, and 15 of culture. The number of lobes in FTOC cultures: day 9 (n=3-4), day 11 (n=3-5), day 13 (n=6-10), and day 15 (n=3-5). (F) Percentage and absolute number of S0 to S3 iNKT cells in control and Eed cKO fetal thymus after day 11 of FTOC culture (n=3-5). (G) Scheme for the generation of BM chimeras. (H) Percentage of TCRβ+CD1d-Tet+ iNKT cells in CD45.1-CD45.2+(Ly5.2) and CD45.1+CD45.2+ (Ly5.1/5.2) cells in the indicated organs from BM chimeras (n=5-6). Data are mean ± SD with statistical significance determined by unpaired t-test (B, E, H) or multiple t-tests (D, F). p values are represented as *, <0.05; **, <0.01; ***, <0.001; ****, <0.0001. Data are representative of at least two independent experiments.
Figure 3
Figure 3
Eed is indispensable for the development of NKT1 and NKT17 cells. (A, B) Representative FACS plots, percentage, and absolute number of thymic TCRβ+CD1d-Tet+ iNKT cells with IFN-γ, IL-4, or IL-17 expression from control and Eed cKO mice (n=3 each). (C, D) Representative FACS plots and absolute number of thymic TCRβ+CD1d-Tet+ iNKT cells with T-bet, PLZF, and/or RORγt expression, determined as NKT1 (T-bet+PLZFlow), NKT2(RoRγt-PLZFhi) and NKT17 (RORγt+PLZFmed) from control (n=4) and Eed cKO (n=3) mice. Data are mean ± SD with statistical significance determined by unpaired t-test. p values are represented as *, <0.05; **, <0.01; ***, <0.001. ns, not significant. Data are representative of at least two independent experiments.
Figure 4
Figure 4
Eed is responsible for H3K27me3 marks and transcriptional programming of iNKT cells. (A) RNA-seq analysis on CD4+CD8+TCRβ+CD69+ thymocytes from control and Eed cKO mice (n=3 each). The scatter plot shows genes that were differentially expressed with p<0.05 and fold change >2 (orange) or <0.5 (blue) in control compared to Eed cKO mice. (B) Venn diagram of downregulated DEGs in Eed cKO mice to control with the gene datasets from the publicly available database (29) that upregulated in S1 to DP or S2 to S1. The number of genes is indicated in each compartment. (C) DEGs from control to Eed cKO DP cells are used for GSEA analysis with gene sets obtained from publicly available databases (28). Upregulated in S2 to S1 iNKT cells (left), upregulated in S3 to S2 iNKT cells (middle), and NKT1 cells (right). (D) The relative expression of NKRs in DP thymocytes. Fold changes of mRNA expression in Eed cKO mice to control mice are shown. (E) Surface expression of NK1.1(Klrb1c), Ly49C/Ly49I (Klra3/Klra7), Ly49G2 (Klra9), and Ly49A(Klra1) on S2/3 (CD24-CD44+) iNKT cells from control (red) and Eed cKO (blue) mice, with DP cells from control mice (gray). (F) H3K27me3 level in the indicated thymic iNKT cells from control (red) and Eed cKO (blue) mice. The gray histogram indicates isotype control. The values in each panel show the MFI. (G) H3K27me3 ChIP-seq peaks at the Zbtb16 locus in iNKT cells (bottom) are shown with RNA-seq tracks in control (top) and Eed cKO (middle) DP cells. Representative data from triplicated pairs of control and Eed cKO mice. H3K27me3 ChIP-seq dataset is from GSE84238. (H) ChIP-qPCR analysis of H3K27me3 (filled bars) and control IgG (open bars) enrichments at the proximal promoter and 3’UTR region of Zbtb16 locus in sorted control thymic iNKT cells (n=3). Gapdh and Hoxa11 were used as the negative and positive controls, respectively. (I) ChIP-qPCR analysis of H3K27me3 enrichment at the Zbtb16 locus in DP, S1/2, and S3 cells (n=3-4). (J, K) Representative FACS histograms and the MFI of PLZF in the indicated iNKT cells from control (red, n=4) and Eed cKO (blue, n=3) mice. The gray histogram indicates DP cells from control mice. Data are mean ± SD with statistical significance determined by unpaired t-test (D, H) or multiple t-tests (K). p values are represented as *, <0.05, **, <0.01; ***, <0.001; ****, <0.0001. Data are representative of at least two independent experiments.
Figure 5
Figure 5
Increased cell death in Eed-deficient iNKT cells is associated with abnormal expression of Cdkn2a and Cdkn1a. (A, B) Representative FACS histograms and percentage of BrdU+ iNKT cells in the thymus from BrdU-pulsed control (n=3) and Eed cKO (n=4) mice. The gray line indicates CD4+CD8-SP cells. (C, D) Representative FACS histograms and percentage of Annexin V+-dead cells in the indicated iNKT cells from control (n=4) and Eed cKO (n=3) mice. (E) ChIP-seq analysis of H3K27me3 in iNKT cells at the Cdkn2a locus (upper) and Cdkn1a locus (lower). (F) ChIP-qPCR analysis of H3K27me3 enrichment at the proximal promoter region of p16, p19, and p21 in sorted thymic CD24-NK1.1- S1/2 iNKT cells from control and Eed cKO mice (n=3 each). (G) Real-time PCR analysis of the expression of p16, p19, and p21 in sorted thymic S2 iNKT cells from control and Eed cKO mice (n=3 each). These expressions were normalized to Ywhaz. Data are mean ± SD with statistical significance determined by unpaired t-test (F, G) or multiple t-tests (B, D). p values are represented as *, <0.05; **, <0.01; ****, <0.0001. Data are representative of at least two independent experiments.
Figure 6
Figure 6
Increased susceptibility to liver injury in Eed-deficient mice. (A) Absolute cell number of NKT1 in the spleen, liver, and lung from control (n=3-4) and Eed cKO (n=4) mice. (B) Representative images of H&E staining of the liver from control and Eed cKO mice at 48 h and 72 h after APAP treatment. Image scale, 100 μm. (C) Percentage of necrosis area and inflammation score in the livers of B (n=3-4 each). (D) Survival curve after APAP treatment in control (dotted line), Eed cKO (dashed line) mice, and Eed cKO mice transferred with iNKT cells from wild-type liver (Eed cKO+iNKT, solid line) (n=3-5 each). (E) Representative images of H&E staining of the liver at 24 h after APAP treatment of the indicated mice. Image scale, 100 μm. (F) Percentage of necrosis area in the livers of (E) Data are mean ± SD with statistical significance determined by unpaired t-test (A, C), or one-way ANOVA (F). p values are represented as *, <0.05; **, <0.01; ****, <0.0001. n.s., not significant. Data are representative of at least two independent experiments.

References

    1. Anderson G, Moore NC, Owen JJ, Jenkinson EJ. Cellular interactions in thymocyte development. Annu Rev Immunol. (1996) 14:73–99. doi: 10.1146/annurev.immunol.14.1.73 - DOI - PubMed
    1. Starr TK, Jameson SC, Hogquist KA. Positive and negative selection of T cells. Annu Rev Immunol. (2003) 21:139–76. doi: 10.1146/annurev.immunol.21.120601.141107 - DOI - PubMed
    1. Werlen G, Hausmann B, Naeher D, Palmer E. Signaling life and death in the thymus: timing is everything. Science. (2003) 299:1859–63. doi: 10.1126/science.1067833 - DOI - PubMed
    1. Stritesky GL, Jameson SC, Hogquist KA. Selection of self-reactive T cells in the thymus. Annu Rev Immunol. (2012) 30:95–114. doi: 10.1146/annurev-immunol-020711-075035 - DOI - PMC - PubMed
    1. Daniels MA, Teixeiro E, Gill J, Hausmann B, Roubaty D, Holmberg K, et al. . Thymic selection threshold defined by compartmentalization of ras/mapk signalling. Nature. (2006) 444:724–9. doi: 10.1038/nature05269 - DOI - PubMed

MeSH terms

Substances

LinkOut - more resources