

Interrogating data-independent acquisition LC-MS/MS for affinity proteomics
- PMID: 39372605
- PMCID: PMC11452513
- DOI: 10.1007/s42485-024-00166-4
Interrogating data-independent acquisition LC-MS/MS for affinity proteomics
Abstract
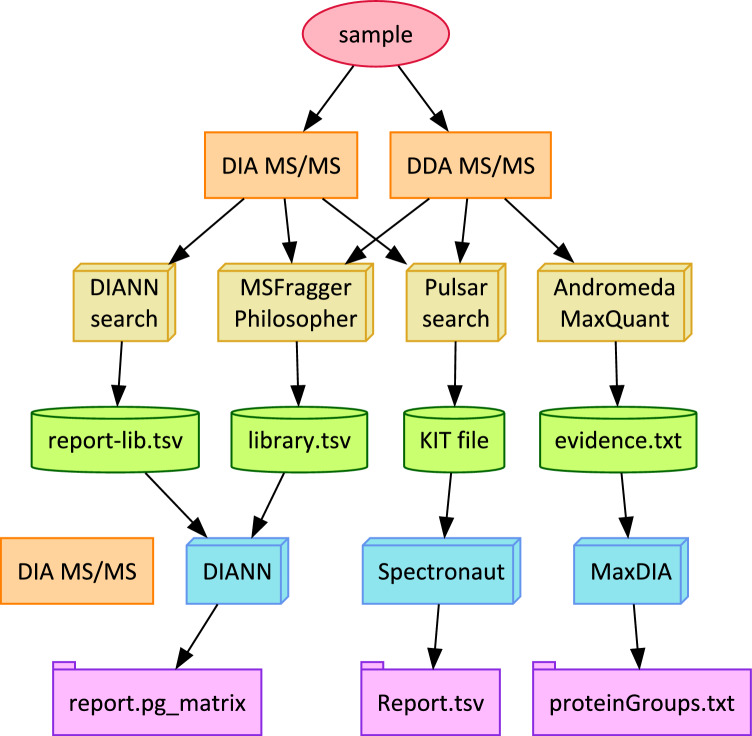
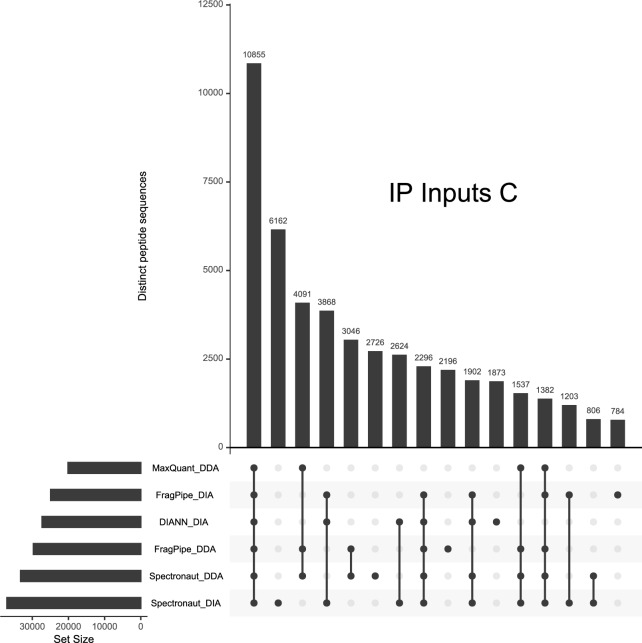
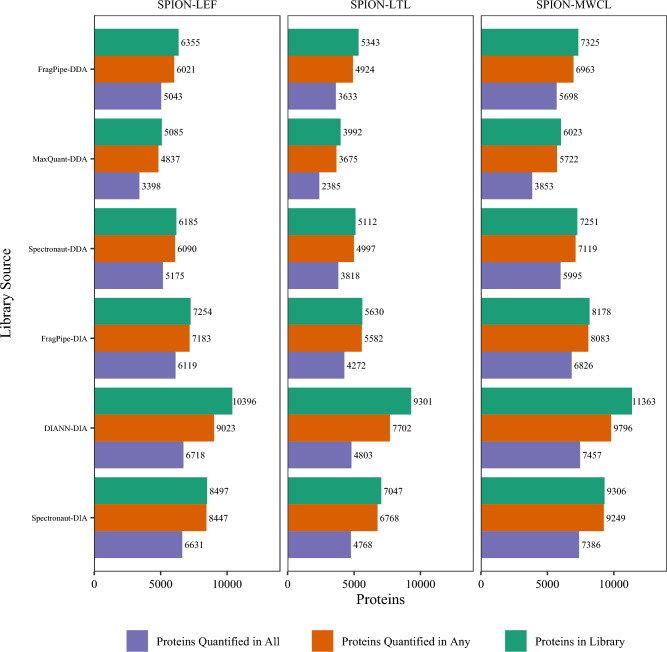
Data-Independent Acquisition (DIA) LC-MS/MS is an attractive partner for co-immunoprecipitation (co-IP) and affinity proteomics in general. Reducing the variability of quantitation by DIA could increase the statistical contrast for detecting specific interactors versus what has been achieved in Data-Dependent Acquisition (DDA). By interrogating affinity proteomes featuring both DDA and DIA experiments, we sought to evaluate the spectral libraries, the missingness of protein quantity tables, and the CV of protein quantities in six studies representing three different instrument manufacturers. We examined four contemporary bioinformatics workflows for DIA: FragPipe, DIA-NN, Spectronaut, and MaxQuant. We determined that (1) identifying spectral libraries directly from DIA experiments works well enough that separate DDA experiments do not produce larger spectral libraries when given equivalent instrument time; (2) experiments involving mock pull-downs or IgG controls may feature such indistinct signals that contemporary software will struggle to quantify them; (3) measured CV values were well controlled by Spectronaut and DIA-NN (and FragPipe, which implements DIA-NN for the quantitation step); and (4) when FragPipe builds spectral libraries and quantifies proteins from DIA experiments rather than performing both operations in DDA experiments, the DIA route results in a larger number of proteins quantified without missing values as well as lower CV for measured protein quantities.
Supplementary information: The online version contains supplementary material available at 10.1007/s42485-024-00166-4.
Keywords: Affinity enrichment; Bioinformatics; Co-immunoprecipitation; Data-independent acquisition; Label-free quantitation.
© The Author(s) 2024.
Conflict of interest statement
Conflict of interestThe authors declare no competing interests.
Figures


References
-
- Barbier-Torres L, Murray B, Yang JW, Wang J, Matsuda M, Robinson A, Binek A, Fan W, Fernández-Ramos D, Lopitz-Otsoa F, Luque-Urbano M, Millet O, Mavila N, Peng H, Ramani K, Gottlieb R, Sun Z, Liangpunsakul S, Seki E, Van Eyk JE, Mato JM, Lu SC (2022) Depletion of mitochondrial methionine adenosyltransferase α1 triggers mitochondrial dysfunction in alcohol-associated liver disease. Nat Commun 13:557. 10.1038/s41467-022-28201-2 - PMC - PubMed
-
- Bruderer R, Bernhardt OM, Gandhi T, Miladinović SM, Cheng L-Y, Messner S, Ehrenberger T, Zanotelli V, Butscheid Y, Escher C, Vitek O, Rinner O, Reiter L (2015) Extending the limits of quantitative proteome profiling with data-independent acquisition and application to acetaminophen-treated three-dimensional liver microtissues. Mol Cell Proteomics 14:1400–1410. 10.1074/mcp.M114.044305 - PMC - PubMed
-
- Brunner A, Thielert M, Vasilopoulou C, Ammar C, Coscia F, Mund A, Hoerning OB, Bache N, Apalategui A, Lubeck M, Richter S, Fischer DS, Raether O, Park MA, Meier F, Theis FJ, Mann M (2022) Ultra-high sensitivity mass spectrometry quantifies single-cell proteome changes upon perturbation. Mole Syst Biol 18:e10798. 10.15252/msb.202110798 - PMC - PubMed
-
- Bubis JA, Levitsky LI, Ivanov MV, Tarasova IA, Gorshkov MV (2017) Comparative evaluation of label-free quantification methods for shotgun proteomics. Rapid Comm Mass Spectrometry 31:606–612. 10.1002/rcm.7829 - PubMed
Grants and funding
LinkOut - more resources
Full Text Sources