[Preprint]. 2024 Sep 16:2024.09.13.612795.
doi: 10.1101/2024.09.13.612795.

Epigenetic control and inheritance of rDNA arrays

Affiliations

Epigenetic control and inheritance of rDNA arrays

Tamara Potapova et al. bioRxiv. .

Abstract

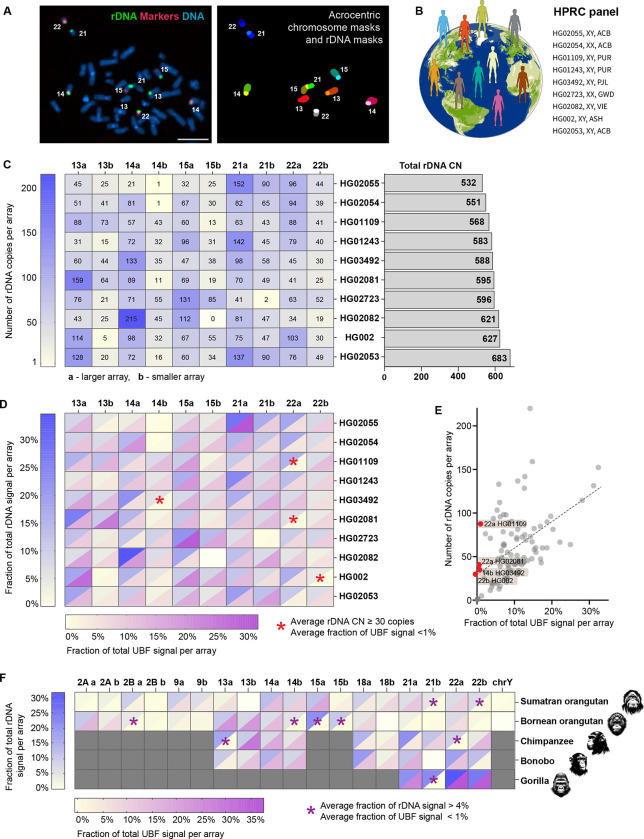
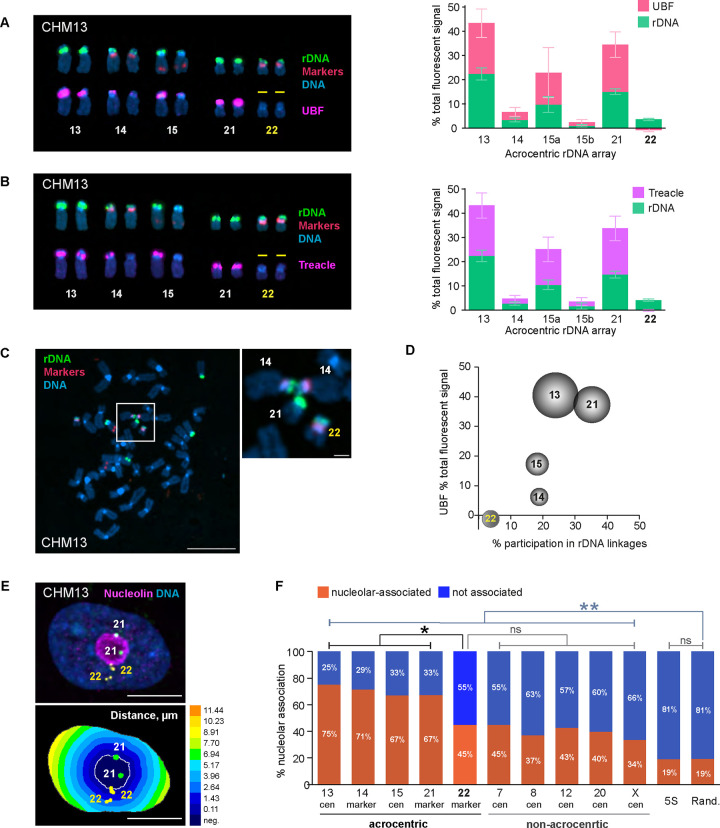
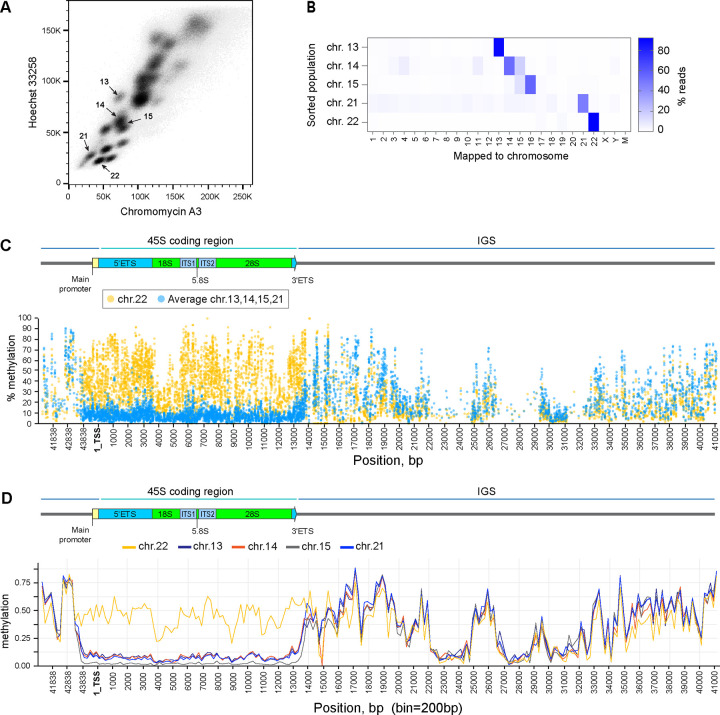
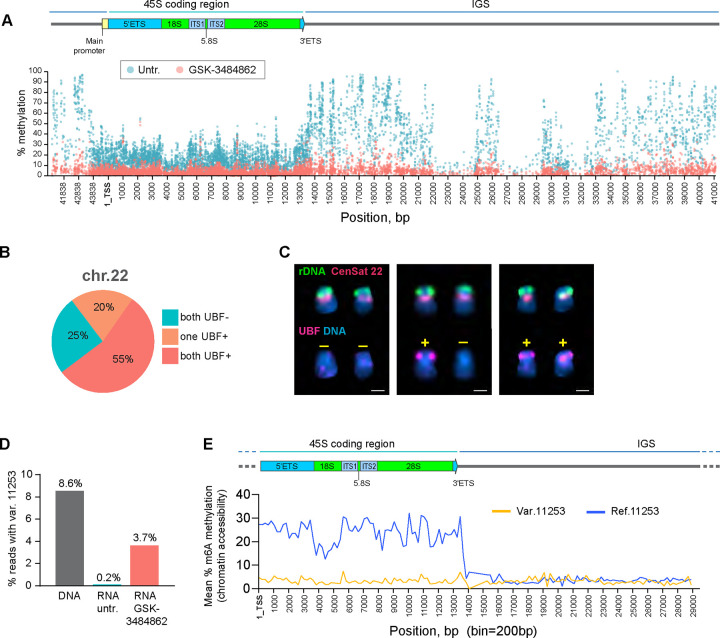
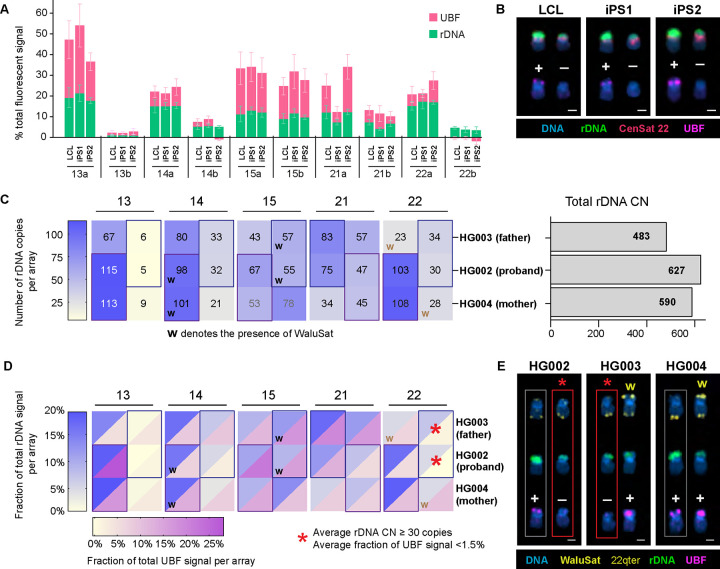
Ribosomal RNA (rRNA) genes exist in multiple copies arranged in tandem arrays known as ribosomal DNA (rDNA). The total number of gene copies is variable, and the mechanisms buffering this copy number variation remain unresolved. We surveyed the number, distribution, and activity of rDNA arrays at the level of individual chromosomes across multiple human and primate genomes. Each individual possessed a unique fingerprint of copy number distribution and activity of rDNA arrays. In some cases, entire rDNA arrays were transcriptionally silent. Silent rDNA arrays showed reduced association with the nucleolus and decreased interchromosomal interactions, indicating that the nucleolar organizer function of rDNA depends on transcriptional activity. Methyl-sequencing of flow-sorted chromosomes, combined with long read sequencing, showed epigenetic modification of rDNA promoter and coding region by DNA methylation. Silent arrays were in a closed chromatin state, as indicated by the accessibility profiles derived from Fiber-seq. Removing DNA methylation restored the transcriptional activity of silent arrays. Array activity status remained stable through the iPS cell re-programming. Family trio analysis demonstrated that the inactive rDNA haplotype can be traced to one of the parental genomes, suggesting that the epigenetic state of rDNA arrays may be heritable. We propose that the dosage of rRNA genes is epigenetically regulated by DNA methylation, and these methylation patterns specify nucleolar organizer function and can propagate transgenerationally.


Figures

Figure 1.
Figure 1.. rDNA copy number and activity in human and primate genomes
A. Identification of specific rDNA arrays for fluorescent intensity measurements. Left panel: chromosome spread from HG002 LCL labeled by FISH with rDNA probe (green) and chromosome identification markers CenSat 14/22 and PML (red). Right panel: segmentation and identification of acrocentric chromosomes and corresponding rDNA arrays. Bar, 10μm. B. HPRC panel of lymphoblastoid cell lines (LCL) used in this study. C. Heatmap of rDNA copy numbers of each acrocentric rDNA array in the selected panel of HPRC cell lines. “a” indicates larger array and “b” smaller array. Numbers are averages from 10 or more spreads, with more detailed boxplots provided in Supplementary Figure 1. The bar plot on the right shows estimates of total rDNA CN in corresponding samples. D. Combined heatmap of average rDNA and UBF fluorescent intensities expressed as fractions of the total signal in a chromosome spread. rDNA was labeled by FISH, and UBF was labeled with an antibody. Both values are averages from 10 or more spreads, with detailed bar graphs shown in Supplementary Figure 2. The blue heat scale corresponds to the rDNA, and the magenta heat scale corresponds to UBF. Blank cell (15b in HG02082) indicates undetectable array. Asterisks denote arrays with 30 or more gene copies, but less than 1% of the total UBF signal. E. Average fractions of the total UBF signal are plotted against the average rDNA CNs for all arrays in all HPRC samples. Linear regression indicates a positive trend (R2=0.27). Red points denote outlier arrays with 30 or more gene copies, but less than 1% of the total UBF signal. F. Combined heatmap of average rDNA and UBF fluorescent intensities of rDNA arrays in non-human primates: Sumatran orangutan, Bornean orangutan, chimpanzee, bonobo, and western lowland gorilla. Chromosome identities were assigned as homo sapiens (hsa) homologues. Gray cells indicate non rDNA-bearing chromosomes in each primate species. Blank cells indicate undetectable rDNA arrays. The blue heat scale corresponds to the rDNA, and the magenta heat scale corresponds to UBF. Both parameters were expressed as percent of the total signal in a chromosome spread, showing averages from 10 or more spreads. Asterisks denote arrays with more than 4% of the total rDNA signal but less than 1% of the total UBF signal. Representative karyograms and fluorescence quantifications are shown in Supplementary Figure 3.
Figure 2.
Figure 2.. Effects of rDNA activity status on 3D organization in CHM13 cell line
A. Right panel: acrocentric karyogram from a representative CHM13 chromosome spread labeled by immuno-FISH with rDNA probe and UBF antibody. Top row of chromosomes shows FISH labeling with rDNA probe (green) and chromosome identification markers CenSat 14/22 and PML (red). Bottom row shows corresponding chromosomes with UBF antibody labeling (magenta). DNA was counterstained with DAPI. Note that both rDNA arrays on chromosome 22 are UBF-negative. Left panel: Quantification of rDNA FISH and UBF antibody labeling on acrocentric arrays. rDNA FISH and UBF antibody signals were measured as fractions of the total fluorescent intensity in the chromosome spread. Since CHM13 cell line is homozygous diploid, both homologous acrocentric arrays were averaged except for chromosome 15. The pink and green sections of the bars represent averages of UBF and rDNA, respectively. Error bars denote standard deviation. B. Treacle antibody was used for rDNA activity estimation in CHM13 by immuno-FISH and as in A. Note that both rDNA arrays on chromosome 22 are also Treacle-negative. C. A representative chromosome spread from CHM13 cell line showing an example of the rDNA linkage between heterologous acrocentric chromosomes. rDNA (green) and chromosome identification markers (red) were labeled by FISH, DNA was counter-stained with DAPI. Bar, 10μm. Magnified insert shows the rDNA linkage between two copies of chromosome 14 and a copy of chromosome 21. Bar, 1μm. D. Relationship between the frequency of rDNA linkages and the activity of rDNA arrays measured by UBF as fractions of the total fluorescent signal. The percent participation in rDNA linkages was determined as the fraction of total linkage occurrences for a particular chromosome. The dimensions of the spheres reflect sizes of rDNA arrays. Both homologous acrocentric arrays were averaged. Large and highly active rDNA arrays (chromosomes 13 and 21) formed linkages frequently, while the inactive arrays on chromosome 22 very rarely participated in linkages. E. Top panel: immuno-FISH image of a representative CHM13 nucleus labeled with rDNA-adjacent markers for chromosome 21 (green), chromosome 22 (yellow), and nucleoar marker nucleolin (magenta). Nuclei were counter-stained with DAPI (blue). Bar, 10μm. Bottom panel: Euclidean Distance Transform (EDT) map of the same nucleus with nucleolus and near-centromeric markers segmented. The intensity scale indicates the distance to nucleolar boundary, μm. F. Nucleolar association of rDNA-adjacent acrocentric chromosome-specific markers, non-acrocentric centromeric markers, and 5S rDNA loci in CHM13 cells. The orange and blue sections of the bars represent fractions of nucleolar-associated and not associated loci, respectively. Validation of rDNA-adjacent chromosome-specific markers is shown in Supplementary Figure 4A. The nucleolar association of chromosome 22 marker is significantly reduced compared to the active acrocentric chromosome markers and is not significantly different from non-acrocentric centromeric markers (Kolmogorov-Smirnov test). Note that nucleolar association of both acrocentric and non-acrocentric markers was significantly higher than that of 5S rDNA locus or random points in the nucleus. Distributions of distances from the nucleolar boundary for all markers are shown in Supplementary Figure 4B.
Figure 3.
Figure 3.. Epigenetic silencing of rDNA by methylation in CHM13 cell line
A. Acrocentric chromosome sorting by flow cytometry. Chromosomes were isolated from CHM13 cell line as detailed in the Materials and Methods and labeled with Chromomycin A3 and Hoechst 33258. Arrows indicate sorted populations. B. Illumina short read mapping from flow-sorted chromosomes. The purity of sorted populations was confirmed by the highest fraction of reads mapped to expected chromosomes, indicated by the color scale. C. Percent methylation of each cytosine base in reads mapped to the rDNA reference sequence across the rRNA gene determined by short-read methyl-sequencing analysis. The promoter and the coding region of transcriptionally inactive chromosome 22 rDNA (yellow circles) are highly methylated compared to averages of all other acrocentric chromosomes with transcriptionally active rDNA (blue circles). Individual plots for each chromosome are shown in Supplementary Figure 5 A–D. D. Methylation calls from ONT long-read sequencing of rDNA reads mapped to specific acrocentric chromosomes. Reads mapped to chromosome 22 (yellow line) are highly methylated in the promoter and coding region compared to reads mapped to other acrocentric chromosomes. Bin size 200bp.
Figure 4.
Figure 4.. DNMT1 inhibitor restores the activity of silent rDNA arrays in CHM13 cell line
A. Methyl-sequencing analysis of CHM13 cells grown in the presence of the DNMT1 inhibitor GSK-3484862 for four weeks, with an untreated culture maintained in parallel. The percent methylation of each cytosine base in reads mapped to the rDNA reference sequence across the entire rRNA gene is shown. The DNMT1 inhibitor reduces DNA methylation levels throughout the gene, including the promoter, coding region, and intergenic spacer. B. UBF immuno-FISH results from forty chromosome spreads of CHM13 cells treated with the DNMT1 inhibitor. The fractions of spreads where one, both, or neither rDNA arrays on chromosome 22 re-gained UBF signal are shown. C. Examples of chromosome 22 pairs from UBF immuno-FISH experiment show panel in B. The top rows of chromosomes show FISH labeling with rDNA probe (green) and CenSat 22 (red). The bottom rows show corresponding chromosomes with UBF antibody labeling (magenta). DNA was counter-stained with DAPI. UBF status is indicated by +/−. Complete karyograms are provided in Supplementary Figure 6B. D. Fractions of rRNA reads containing a variant at position 44997. RNA from untreated and GSK-3484862-treated cells was used to create non-ribodepleted libraries. Illumina short sequencing reads were analyzed using the mpileup tool to detect the presence of the variant at position 44997. DNA from the CHM13 cell line was analyzed in parallel. The DNMT1 inhibitor treatment caused re-expression of the silent variant. E. Fiber-seq mean percent methylation of adenine bases in rDNA-containing reads. Reads containing chromosome 22-specific variant at position 11253 (yellow line) are less methylated in the coding region compared to reads containing the reference base (blue line), indicating less accessible chromatin. Bin size 200 bp.
Figure 5.
Figure 5.. rDNA copy number and activity status in HG002 iPS cells and family trio
A. Quantification of rDNA FISH and UBF antibody labeling on acrocentric arrays in HG002 LCL and two iPS cell lines. The rDNA FISH and UBF antibody signals were measured as fractions of the total fluorescent intensity in the chromosome spread. Note the smaller rDNA array on chromosome 22 that is UBF-negative in all three cell lines. The green and pink sections of the bars represent the averages of rDNA and UBF signals, respectively. Error bars denote standard deviations. B. Examples of chromosome 22 pairs from HG002 cell lines measured in panel A. The top rows display FISH labeling with the rDNA probe (green) and CenSat 22 (red). The bottom rows show corresponding chromosomes with UBF antibody labeling (magenta). DNA was counterstained with DAPI. UBF status is indicated by +/−. Extended karyograms are provided in Supplementary Figure 7A. C. Heatmap of rDNA copy numbers for each acrocentric rDNA array in the HG002 family trio. The proband’s arrays are sorted by size (large and small), while parental arrays are arranged to match the proband. Boxes indicate approximations for inherited arrays, and “w” denotes the presence of WaluSat. Numbers represent averages from 10 or more spreads, with detailed boxplots in Supplementary Figure 1 for HG002, and Supplementary Figure 6B for HG003 and HG004. The bar plot on the right estimates the total rDNA copy number in corresponding samples. D. Combined heatmap of average rDNA and UBF fluorescent intensities, expressed as fractions of the total signal in a chromosome spread. Both values are averages from 10 or more spreads, with detailed bar graphs provided in Supplementary Figure 2 for HG002, and Supplementary Figure 7C for HG003 and HG004. The blue heat scale corresponds to rDNA, and the magenta heat scale corresponds to UBF. The asterisk denotes the low activity rDNA array present on the WaluSat-negative copy of chromosome 22 in HG002 (proband) and HG003 (father). E. Examples of chromosome 22 pairs from HG002, HG003, and HG004 LCL cell lines shown in panel D. The top rows display chromosomes labeled by FISH with WaluSat probe (highlighted by arrows) and a chromosome 22 q-terminal region probe (arrow) serving as an identification marker. The middle rows show corresponding chromosomes labeled with the rDNA probe (green). The bottom rows display the corresponding chromosomes labeled with UBF antibody (magenta). DNA was counterstained with DAPI. The UBF-negative rDNA array on the WaluSat-negative copy of chromosome 22 in HG002 and the corresponding paternal copy of chromosome 22 in HG003 are highlighted by red boxes and asterisks. The maternal copy of chromosome 22 is highlighted by gray boxes. Extended acrocentric karyograms are shown in Supplementary Figure 7D.

References

    1. Agrawal S. and Ganley A. R. D. (2018). “The conservation landscape of the human ribosomal RNA gene repeats.” PLoS One 13(12): e0207531. - PMC - PubMed
    1. Azevedo Portilho N., Saini D., Hossain I., Sirois J., Moraes C. and Pastor W. A. (2021). “The DNMT1 inhibitor GSK-3484862 mediates global demethylation in murine embryonic stem cells.” Epigenetics Chromatin 14(1): 56. - PMC - PubMed
    1. Bell S. P., Learned R. M., Jantzen H. M. and Tjian R. (1988). “Functional cooperativity between transcription factors UBF1 and SL1 mediates human ribosomal RNA synthesis.” Science 241(4870): 1192–1197. - PubMed
    1. Boisvert F. M., van Koningsbruggen S., Navascues J. and Lamond A. I. (2007). “The multifunctional nucleolus.” Nat Rev Mol Cell Biol 8(7): 574–585. - PubMed
    1. Bonduriansky R. (2012). “Rethinking heredity, again.” Trends Ecol Evol 27(6): 330–336. - PubMed

Publication types

LinkOut - more resources