[Preprint]. 2024 Jun 14:2024.06.14.599098.
doi: 10.1101/2024.06.14.599098.

Lineage-specific CDK activity dynamics characterize early mammalian development

Affiliations

Lineage-specific CDK activity dynamics characterize early mammalian development

Bechara Saykali et al. bioRxiv. .

Update in

Abstract

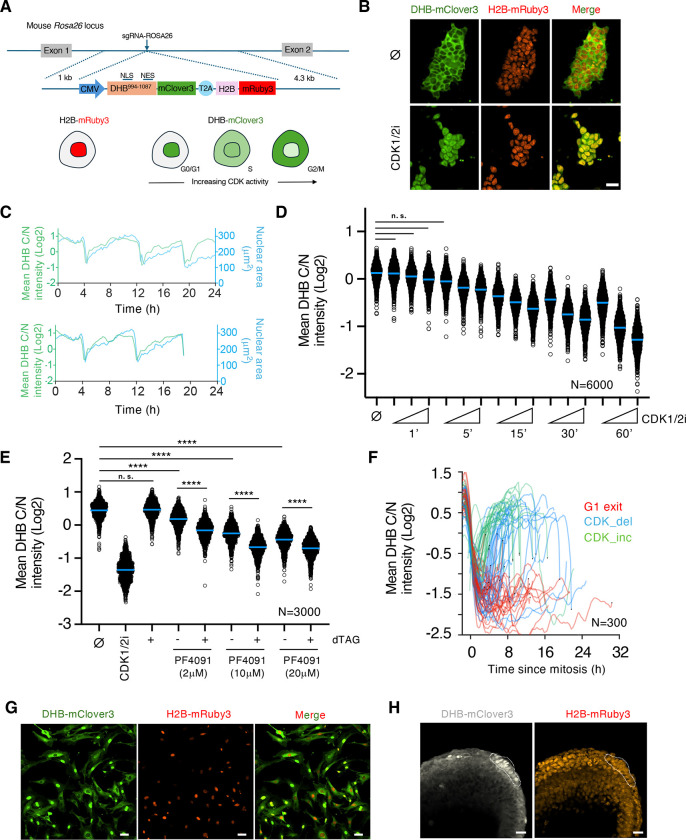
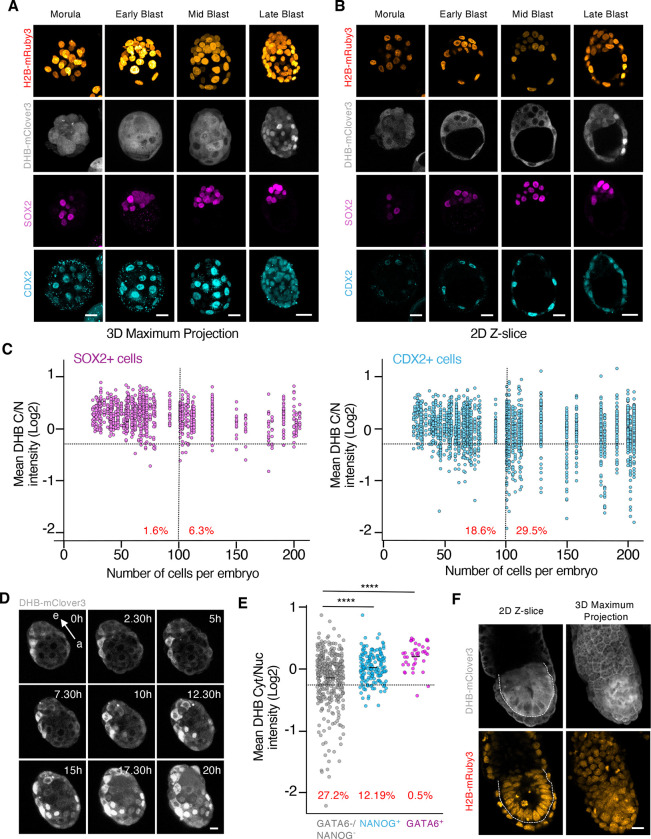
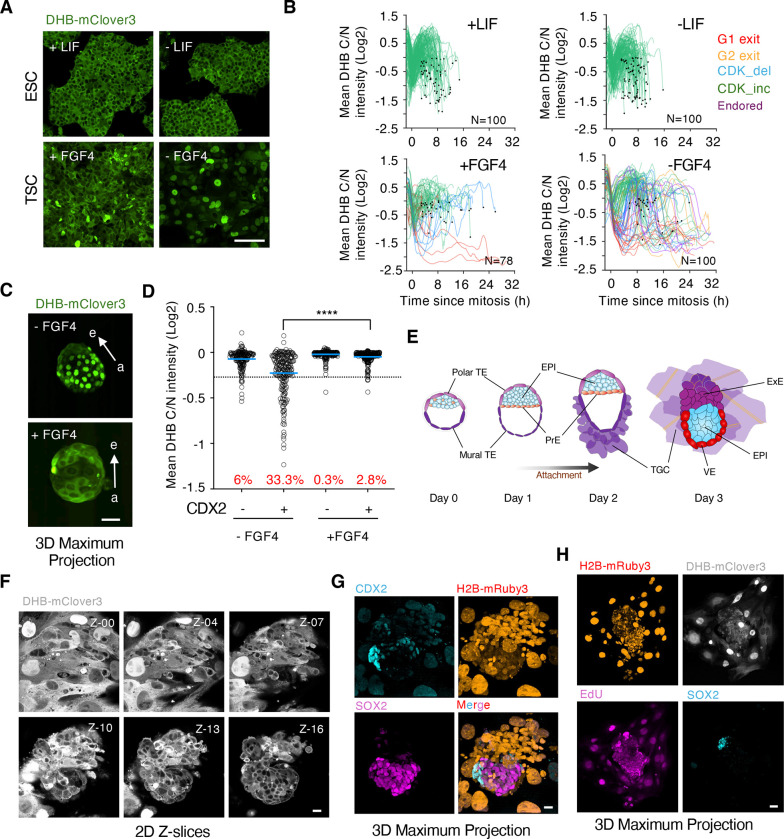
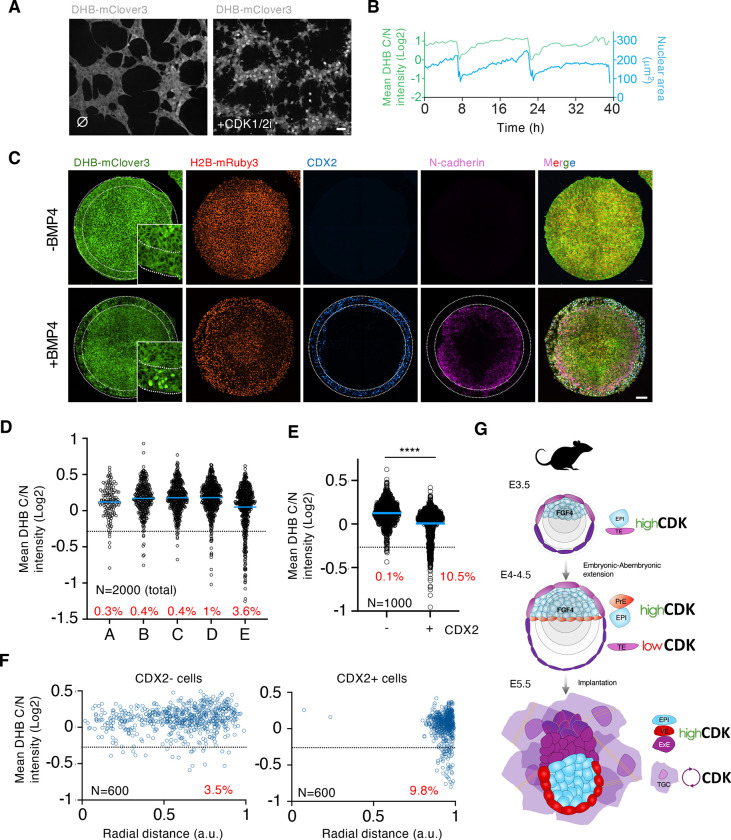
Cyclin-dependent kinases (CDK) are key regulatory enzymes that regulate proliferation dynamics and cell fate in response to extracellular inputs. It remains largely unknown how CDK activity fluctuates and influences cell commitment in vivo during early mammalian development. Here, we generated a transgenic mouse model expressing a CDK kinase translocation reporter (KTR) that enabled quantification of CDK activity in live single cells. By examining pre- and post-implantation mouse embryos at different stages, we observed a progressive decrease in CDK activity in cells from the trophectoderm (TE) prior to implantation. This drop correlated with the establishment of an FGF4-dependent signaling gradient through the embryonic-abembryonic axis. Furthermore, we showed that CDK activity levels do not determine cell fate decisions during pre-implantation development. Finally, we uncovered the existence of conserved regulatory mechanisms in mammals by revealing lineage-specific regulation of CDK activity in TE-like human cells.

Keywords: CDK; Embryonic stem cells; Kinase translocation reporter; Pre-implantation development; Trophectoderm.


Conflict of interest statement

COMPETING INTERESTS The authors declare no competing interests.

Figures

Figure 1:
Figure 1:. A CDK-KTR transgenic mouse model for live visualization of CDK activity in vivo
(A) Schematic representation of the CDK activity sensor targeted at the Rosa26 locus in ESC. The DNA helicase B (DHB, amino acids 994–1087)-mClover3 KTR shuffles between nucleus and cytoplasm and is used as a readout for CDK activity. NLS: nuclear localization signal. NES: nuclear export signal. (B) Confocal images of mouse ESCDHB/H2B cultures that were untreated (⌀) or CDK1/2i-treated (30μM) for one hour. Scale bar, 30μm. (C) Single-cell CDK activity (based on Cytoplasm/Nuclear (C/N) ratio, green) and nuclear size (blue) traces of representative examples of proliferating ESCDHB/H2B. We tracked the same cell (starting point in both plots) and followed daughter and granddaughter cells derived after mitosis. The sudden drop in CDK activity and nuclear size corresponds to a mitotic event. (D) High-throughput imaging (HTI) quantification of C/N mean intensity in untreated (⌀) or CDK1/2i-treated ESCDHB/H2B cultures at different time points with increasing concentration of the inhibitor (1μM, 5μM and 30μM). Center lines indicate mean values. N=6000 cells; All comparisons between untreated and treated cells showed a p-value of p<0.0001 from two-tailed unpaired t-tests except those shown as n.s. (non-significant). (E) HTI quantification of C/N mean intensity in untreated (⌀) or dTAG-treated CDK1-degron ESCDHB/H2B cultures combined with the CDK2 inhibitor PF4091 at different concentrations for two hours. Center lines indicate mean values. N=3000 cells; p-values are shown from two-tailed unpaired t-tests. **** p<0.0001; n.s.: non-significant. (F) Single-cell CDK activity traces from mouse embryonic fibroblasts (MEF) obtained from ROSA26DHB/H2B mice. All tracks were synchronized in silico to mitosis and the fate of each cell was followed. Criteria to define cells as CDK_inc, CDK_del and G1 exit are specified in Methods. (G) Confocal images of untreated MEF cultures derived from E13.5 ROSA26DHB/H2B mice. Scale bar, 50μm. (H) Confocal images of E7.5 ROSA26DHB/H2B mice showing the location of the node (dashed lines). Scale bar, 20μm.
Figure 2
Figure 2. The cells from the TE show a reduction in CDK activity upon implantation
(A and B) Confocal images from hemizygous ROSA26DHB/H2B embryos during pre-implantation development (from morula to late blastocyst). Scale bar, 20μm. (C) Plot showing a quantification of C/N mean intensity in individual cells (each represented by a dot) obtained from hemizygous ROSA26DHB/H2B embryos during pre-implantation development. The collection of dots from the same column belongs to embryos with the same cell count. Embryos were staged based on the number of cells and cells classified as SOX2 (left panel) or CDX2 (right panel) expressing cells in each embryo. In red is the percentage of cells below the defined arbitrary threshold (−0.25) shown for embryos containing 0–100 cells (left) and embryos containing above 100 cells (right). N=54 embryos. (D) Time-lapse microscopy experiment performed in E3.5 isolated hemizygous ROSA26DHB/H2B embryos. One representative embryo is shown. Note how the CDK sensor translocates to the nuclei in TE cells. Arrow indicates the embryonic (e)- abembryonic (a) axis. Scale bar, 15μm. (E) Plot showing a quantification of C/N mean intensity in individual cells obtained from a pool of hemizygous E4.5 ROSA26DHB/H2B embryos. In red is the percentage of cells below the arbitrary defined threshold (−0.25). p-values are shown from two-tailed unpaired t-tests. **** p<0.0001; N=5 embryos. (F) Confocal images from E6.5 hemizygous ROSA26DHB/H2B embryos. Dashed line surrounds the EPI. Scale bar, 20μm.
Figure 3
Figure 3. ICM-derived FGF4 establishes a signaling gradient through the embryonic-abembryonic axis.
(A) Confocal images of TSCDHB/H2B and ESCDHB/H2B cells cultured with or without self-renewal signals for seventy-two hours. Scale bar, 100μm. (B) Single-cell CDK activity traces from TSCDHB/H2B and ESCDHB/H2B cells cultured with or without self-renewal signals for seventy-two hours. All tracks were synchronized in silico to mitosis and the fate of each cell was followed. Criteria to define cells as CDK_inc, CDK_del, Endored, G1 exit and G2 exit are specified in Methods. (C) Confocal images of representative untreated or FGF4-treated hemizygous ROSA26DHB/H2B embryos cultured for 20 hours after isolation at E3.5. Scale bar, 50μm. Arrows indicate the embryonic (e)- abembryonic (a) axis. (D) Plot showing quantification of C/N mean intensity in a pool of CDX2+ or CDX2− cells from untreated (N=5 embryos) or FGF4-treated (N=9 embryos). P-value is shown from a two-tailed unpaired t-test. **** p<0.0001. In red is the percentage of cells below the defined sarbitrary threshold (−0.25). (E) Schematic representation of the embryonic development in vitro of a E3.5 (Day 0 for in vitro culture) blastocyst beyond implantation stages. TE: trophectoderm; EPI: epiblast; PrE: primitive endoderm; TGC: trophoblast giant cell; VE: visceral endoderm; ExE: extraembryonic endoderm. (F) Series of 2D-Z confocal images (3μm slice interval) of a representative hemizygous ROSA26DHB/H2B embryo cultured in vitro three days after isolation at E3.5. Scale bar, 20μm. (G) Confocal images of the same hemizygous ROSA26DHB/H2B embryo from (F). Scale bar, 20μm. (H) Confocal images of a representative hemizygous ROSA26DHB/H2B embryo cultured three days after isolation at E3.5. Scale bar, 50μm.
Figure 4
Figure 4. Human TE-like cells show nuclear translocation of the CDK sensor.
(A) Confocal images of human ESCDHB/H2B cultures that were untreated (⌀) or CDK1/2i-treated (30μM) for one hour. Scale bar, 50μm. (B) Single-cell CDK activity and nuclear trace of a representative proliferating human ESCDHB/H2B. The sudden drop in CDK activity and nuclear size corresponds to a mitotic event. (C) Confocal images of representative gastruloids uninduced or BMP4-induced for seventy-two hours. Insets can be found for DHB-mClover3 with higher magnification. Dashed lines indicate the outer ring of TE-like cells identified by CDX2 expression. Scale bar, 100μm. (D) Plot showing a quantification of C/N mean intensity in a total number of 2000 random individual cells distributed according to their position in defined rings from the center of the gastruloid (see Figure S8A for details). In red is the percentage of cells per ring below the defined arbitrary threshold (<−0.25). Data was obtained by combining multiple gastruloids from the same experiment (N=12 gastruloids). (E) Plot showing a quantification of C/N mean intensity in 1000 random CDX2 positive or negative cells from human gastruloids. p value is shown from a two-tailed unpaired t-test. **** p<0.0001. In red is the percentage of cells below the defined arbitrary threshold (−0.25). Data was obtained by combining multiple gastruloids from the same experiment (N=12 gastruloids). (F) Plot showing a quantification of C/N mean intensity in 600 random CDX2+ or CDX2− cells distributed according to their radial distance from the center of the gastruloid (see Figure S8A for details). In red is the percentage of cells per ring below the defined arbitrary threshold (<−0.25). Data was obtained by combining multiple gastruloids from the same experiment (N=12 gastruloids). (G) Schematic model summarizing our findings. TE: trophectoderm; EPI: epiblast; PrE: primitive endoderm; TGC: trophoblast giant cell; VE: visceral endoderm; ExE: extraembryonic endoderm.

References

    1. Aleem E., Kiyokawa H. and Kaldis P. (2005) Cdc2-cyclin E complexes regulate the G1/S phase transition. Nat. Cell Biol. 7, 831–836. - PubMed
    1. Bedzhov I., Leung C.Y., Bialecka M. and Zernicka-Goetz M. (2014) In vitro culture of mouse blastocysts beyond the implantation stages. Nat. Protoc. 9, 2732–2739. - PubMed
    1. Boroviak T., Loos R., Lombard P., Okahara J., Behr R., Sasaki E., Nichols J., Smith A. and Bertone P. (2015) Lineage-specific profiling delineates the emergence and progression of naive pluripotency in mammalian embryogenesis. Dev. Cell 35, 366–382. - PMC - PubMed
    1. Bulut-Karslioglu A., Biechele S., Jin H., Macrae T.A., Hejna M., Gertsenstein M., Song J.S. and Ramalho-Santos M. (2016) Inhibition of mTOR induces a paused pluripotent state. Nature 540, 119–123. - PMC - PubMed
    1. Cappell S.D., Chung M., Jaimovich A., Spencer S.L. and Meyer T. (2016) Irreversible APC(Cdh1) Inactivation Underlies the Point of No Return for Cell-Cycle Entry. Cell 166, 167–180. - PMC - PubMed

Publication types

LinkOut - more resources