[Preprint]. 2024 Jun 28:2024.06.27.600657.
doi: 10.1101/2024.06.27.600657.

Cryo-electron tomography pipeline for plasma membranes

Affiliations

Cryo-electron tomography pipeline for plasma membranes

Willy W Sun et al. bioRxiv. .

Update in

  • Cryo-electron tomography pipeline for plasma membranes.
    Sun WW, Michalak DJ, Sochacki KA, Kunamaneni P, Alfonzo-Méndez MA, Arnold AM, Strub MP, Hinshaw JE, Taraska JW. Sun WW, et al. Nat Commun. 2025 Jan 20;16(1):855. doi: 10.1038/s41467-025-56045-z. Nat Commun. 2025. PMID: 39833141 Free PMC article.

Abstract

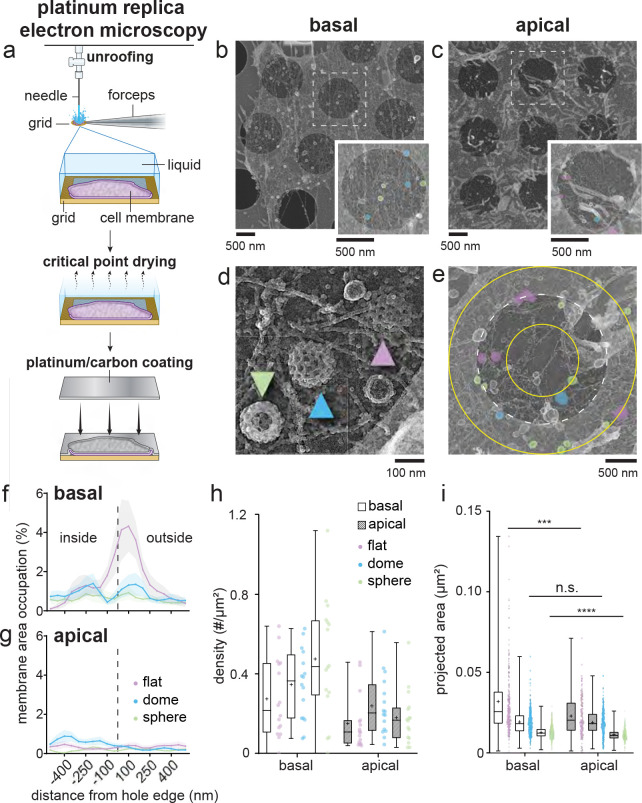
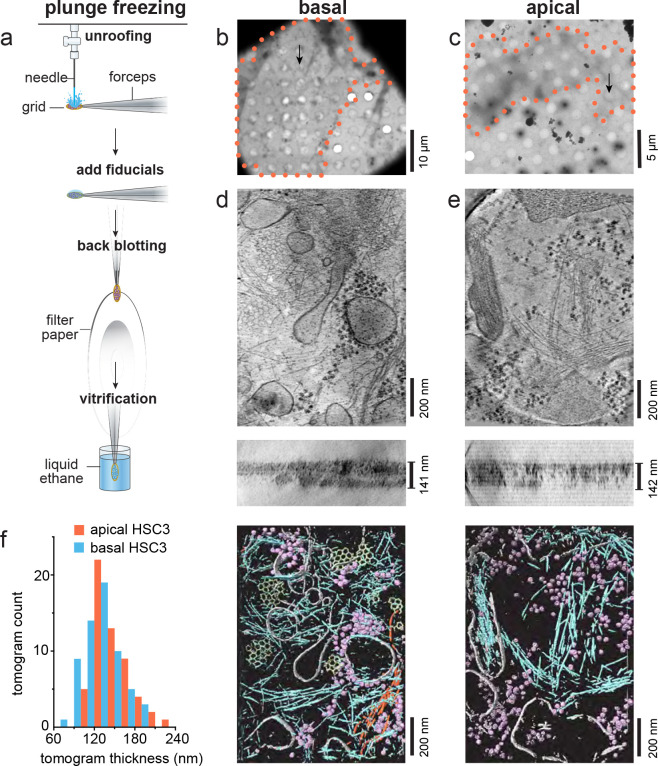
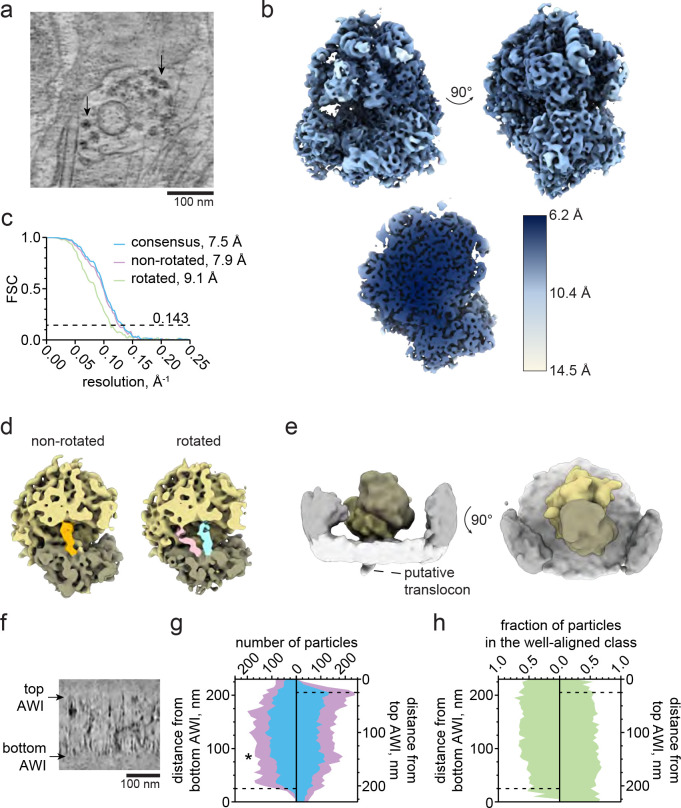
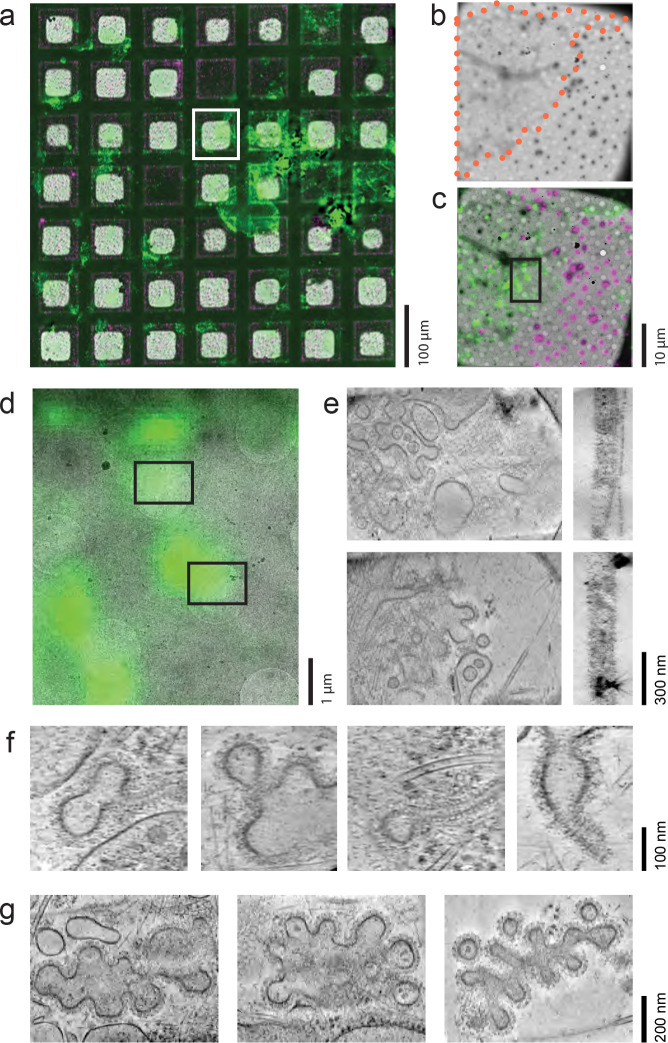
Cryo-electron tomography (cryoET) provides sub-nanometer protein structure within the dense cellular environment. Existing sample preparation methods are insufficient at accessing the plasma membrane and its associated proteins. Here, we present a correlative cryo-electron tomography pipeline optimally suited to image large ultra-thin areas of isolated basal and apical plasma membranes. The pipeline allows for angstrom-scale structure determination with sub-tomogram averaging and employs a genetically-encodable rapid chemically-induced electron microscopy visible tag for marking specific proteins within the complex cell environment. The pipeline provides fast, efficient, distributable, low-cost sample preparation and enables targeted structural studies of identified proteins at the plasma membrane of cells.


Figures

Figure 1.
Figure 1.. Generating isolated plasma membranes on EM grids.
a, Diagrams showing the workflow for isolating basal plasma membranes. A plasma-cleaned grid is placed onto a coverslip and secured with a PDMS stencil. Cells are then seeded onto the grid and incubated overnight. To generate isolated basal plasma membranes, the grid is placed under a pressurized fluid-delivering device and the grid is sprayed with unroofing buffer to wash away the apical portions of cells with shearing force. b, Diagrams showing the workflow for isolating apical plasma membranes. Cells are first seeded onto a coverslip and incubated overnight. A plasma-cleaned, poly-L-lysine coated grid is then brought into contact with the coverslip to pick up cells. Pressurized fluid is then applied to the grid to wash away the basal portions of cells to generate isolated apical plasma membranes.
Figure 2.
Figure 2.. Evaluating isolated plasma membranes of HSC3 cells on EM grids with platinum replica electron microscopy.
a, Cartoon showing the process from generating isolated plasma membranes on grids to producing platinum replicas of the isolated plasma membranes. b, An isolated HSC3 cell basal plasma membrane on an R2/1 Quantifoil grid. The inset shows an enlarged view of the white dash square area. Structural classes of clathrin are color-coded: Lilac = flat; processed cyan = dome; tea green = sphere. c, An isolated HSC3 cell apical plasma membrane on an R2/1 Quantifoil grid. The inset shows an enlarged view of the white dash square area. Color-coding is as in b. d, A close-up view showing the three classes of clathrin structures. The lilac-colored arrow points to a flat clathrin structure, with a visible clathrin lattice edge; the cyan-colored arrow points to a dome-shaped clathrin structure with an elevated lattice structure and a less well-defined lattice edge; the tea green-colored arrow points to a spherical clathrin structure with no visible clathrin lattice edge. e, The edge of the hole (white dash circle) is used as the reference point to evaluate the distribution of the different classes of clathrin-coated structures across the changing grid surface. Yellow circles inside and outside of the hole define the 500 nm range from the edge of the hole evaluated. The 1000 nm range (500 nm outside and 500 nm inside the hole edge) is divided into 10 bins of 50 nm (as plotted in f,g). Clathrin structures are color-coded as mentioned above. f,g, Comparison of the distribution of flat, dome, and sphere clathrin-coated structures with respect to the edge of the hole between basal f and apical g isolated plasma membranes. h and i are box and whisker plots, h comparing the density of different classes of clathrin structures between isolated basal and apical plasma membranes, and i of the projected area of individual clathrin structures grouped by structural class. On average, flat (***p = 0.0002) and sphere (****p < 0.0001) clathrin structures on basal membranes have a larger projected area when compared to their apical counterparts. For h and i, horizontal lines=median, plus signs=mean.
Figure 3.
Figure 3.. Unroofed cells provide 100–200 nm thick plasma membrane samples for cryoET.
a, A diagram highlighting unroofing, addition of fiducial markers, back-blotting, and plunging in liquid ethane for vitrification. b, A 2250x magnification montage of a grid square containing an isolated HSC3 basal membrane (outlined with an orange dotted line). c, A 2250x magnification montage of a grid square containing an isolated apical HSC3 membrane (outlined with an orange dotted line). d (top) shows a minimum-intensity projection along the Z axis through 21 slices of a gaussian-smoothed bin8 tomogram acquired at the location of the arrow in b. d (middle) shows a minimum-intensity projection of 101 slices through the Y axis of the same tomogram with the measured thickness shown. d (bottom) shows a segmentation (mask guided isosurface) of the above tomogram: gray=membrane, purple=ribosomes, blue=actin, light green=clathrin, orange=intermediate filaments. e, Same as d, but for the apical membrane tomogram acquired at the position of the black arrow in c. f, Histogram of tomogram thicknesses of HSC3 basal and apical membranes imaged here. Napical=56, Nbasal=61, 2 grids represented for each. Scale bars are 10 μm, 5 μm for b,c respectively and 200 nm for d,e.
Figure 4.
Figure 4.. Subtomogram averaging and contextual analysis shows sub-nanometer detail is preserved in isolated plasma membranes.
a, Projection of 21 z-slices from a tomogram of an isolated plasma membrane. 80S ribosomes (black arrows) are frequently found in unroofed HEK293 cells overexpressing dynamin-1(K44A). b, Rotated views (top) and a clipped view (bottom) of a consensus subtomogram average filtered according to the local resolution. c, Fourier shell correlation (FSC) profiles obtained from subtomogram averages. The nominal resolution is reported at FSC=0.143. d,e, Classification of the set of well-aligning particles obtained subtomogram averages of the 80S ribosome in non-rotated and rotated states. tRNA occupying the P, P/E, and A/P sites are indicated in orange, pink, and blue, respectively (d) and a subset of 446 membrane-bound ribosomes (two views, e). f, A view from a tomogram with the top and bottom air-water interfaces (AWIs) indicated (black arrows). g, Distances of putative ribosomes were measured from both AWIs. The number of particles falling within successive 5 nm bins from the bottom and top AWIs (left and right panels, respectively) is plotted for the set of particles obtained immediately following picking (cyan) and the set of well-aligning particles obtained from classification (purple). h, The fraction of particles found with particle picking that constitute the well-aligning class are plotted with respect to their distance to the bottom and top AWIs.
Figure 5.
Figure 5.. CLEM finds sites of arrested clathrin-mediated endocytosis (CME).
a, Select portion of grid shown as a low magnification cryoEM image registered with cryo-fluorescence images of Dyn1(K44A)-GFP (green) and 500 nm fiducial markers (red). b, The grid square highlighted in white (a) is shown in a higher resolution map. Orange dots indicate the outline of the isolated plasma membrane. c, The fluorescence overlay is shown. d, The black box is shown enlarged. Black boxes indicate the location of tilt series acquisition for the tomograms shown in e. e, Examples of tomograms in XY (left) and XZ (right) f, Examples of arrested CME sites with Dynamin 1 (K44A) tubules. g, Examples of arrested CME sites with large clathrin-decorated clusters. All XY tomogram images are minimum intensity projections (mIPs) over 21 gaussian-smoothed XY slices while XZ images are mIPs of 101 XZ slices. Scale bars are a, 100 μm; b,c, 10 μm; d, 1 μm; e, 300 nm; f, 100 nm; g, 200 nm.
Figure 6.
Figure 6.. Iron-Free FerriTag is specific, efficient, and visible in cryoET.
a, TIRF microscopy of a HEK293 cell expressing FerriTag (FRB-mCherry-FTH1, magenta, and FTL) and Hip1R-GFP-FKBP (green) shown before rapamycin addition (left) and 30–60 seconds after rapamycin addition (right). b, Cryo-fluorescence microscopy of HEK293 isolated plasma membrane on a grid expressing FerriTag (FRB-mCherry-FTH1, magenta, and FTL) and Hip1R-GFP-FKBP (green) with combined colors on the right. c (left), CryoEM montaged map of the same grid square. c(middle), Reflection image acquired on the cryo fluorescence microscope and used to register the images. c(right), Registered fluorescence and EM images combined. Orange dots = membrane outline, arrows = position of d acquisition. d, Tomogram of Hip1R/FerriTag labelling and an example of a prominent clathrin structure (right). Empty FerriTag structures are clearly visible as 12 nm circles (arrow). e, Selected tomogram from HEK293 cells with labeled FerriTag on GFP-FKBP-LCa shown and an example of a well-defined clathrin structure (right). For d and e, a cartoon at the top right depicts the location of the membrane (gray), clathrin (green), and FerriTag (purple). f, A histogram of the FerriTag distance from clathrin coated membrane (shown at 0–600 nm and 0–80 nm) for clathrin light chain (GFP-FKBP-LCa) and Hip1R (Hip1R-GFP-FKBP). Molecular models of Ferritin (PDB-1fha), mCherry (PDB-2h5q), FRB/FKBP (PDB-3fap), and GFP (PDB-5wwk) and EM density of the clathrin cage (emdb-21608) at scale with the zoomed-in histogram in combination with cartoons of Hip1R, actin, and membrane are shown as putative models explaining the data to the left. The dashed orange line guides the eye from the data peaks to the center of the FerriTag model. g, An example of FerriTag Hip1R labeling and surrounding a clathrin structure. Segmentation of membrane (gray), clathrin (green), FerriTag (purple) and actin (blue) are shown to the right. h, Close-up examples showing Hip1R density adjacent to FerriTag. Cartoons of membrane (light gray), clathrin (green), Hip1R (dark gray), FerriTag (purple), and actin (blue) are shown to the right to aid image interpretation. Tomogram images in d,e are minimum intensity projections (mIPs) of 21 Gaussian-smoothed XY slices. Tomogram images in g,h are mIPs of 10 Gaussian-smoothed slices. Scale bars are a, 20 μm, 8 μm inset full-width; b,c, 10 μm; d,e, 200 nm, 50 nm inset; g, 100 nm; h, 30 nm.

References

    1. Lučič V., Rigort A., and Baumeister W., Cryo-electron tomography: the challenge of doing structural biology in situ. J Cell Biol, 2013. 202(3): p. 407–19. - PMC - PubMed
    1. Bäuerlein F.J. and Baumeister W., Towards visual proteomics at high resolution. Journal of Molecular Biology, 2021. 433(20): p. 167187. - PubMed
    1. Consortium T.U., UniProt: the Universal Protein Knowledgebase in 2023. Nucleic Acids Research, 2022. 51(D1): p. D523–D531. - PMC - PubMed
    1. Sochacki K.A. and Taraska J.W., Correlative Fluorescence Super-Resolution Localization Microscopy and Platinum Replica EM on Unroofed Cells. Methods Mol Biol, 2017. 1663: p. 219–230. - PMC - PubMed
    1. Svitkina T.M., Platinum replica electron microscopy: Imaging the cytoskeleton globally and locally. Int J Biochem Cell Biol, 2017. 86: p. 37–41. - PMC - PubMed

Publication types

LinkOut - more resources