[Preprint]. 2024 Sep 24:2024.09.20.614175.
doi: 10.1101/2024.09.20.614175.

Exploring midgut expression dynamics: longitudinal transcriptomic analysis of adult female Amblyomma americanum midgut and comparative insights with other hard tick species

Affiliations

Exploring midgut expression dynamics: longitudinal transcriptomic analysis of adult female Amblyomma americanum midgut and comparative insights with other hard tick species

Stephen Lu et al. bioRxiv. .

Abstract

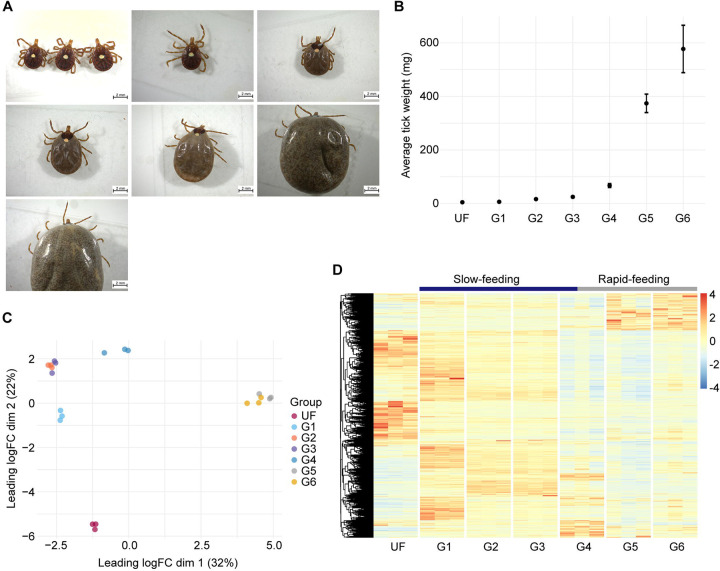
Background: Female ticks remain attached to their host for multiple days to complete a blood meal. This prolonged feeding period is accompanied by a significant increase in the tick's size and body weight, paralleled by noteworthy changes to the tick midgut. While the midgut is recognized for its established role in blood storage and processing, its importance extends to playing a crucial role in the acquisition, survival, and proliferation of pathogens. Despite this, our overall understanding of tick midgut biology is limited.

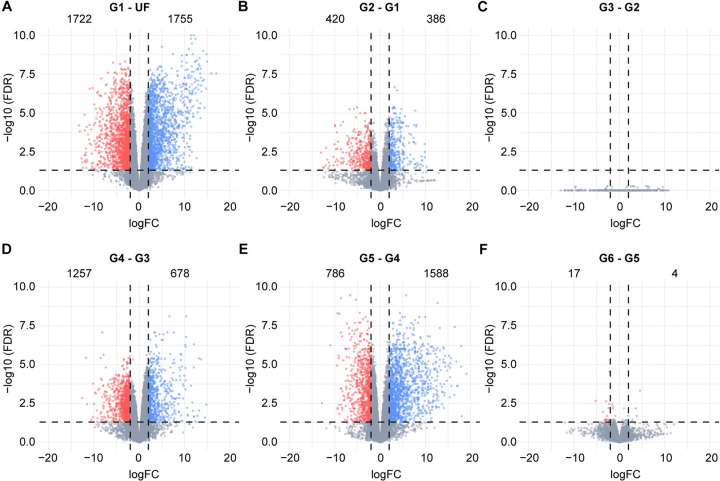
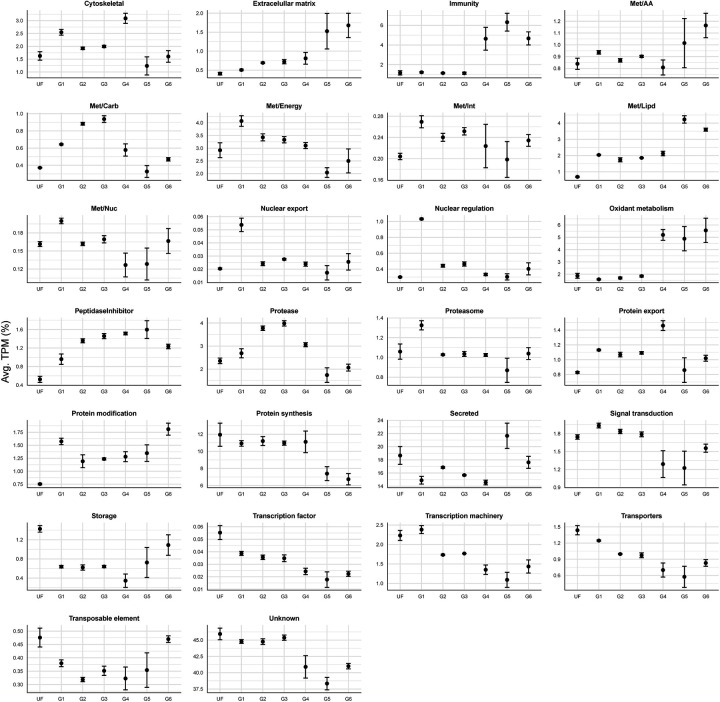
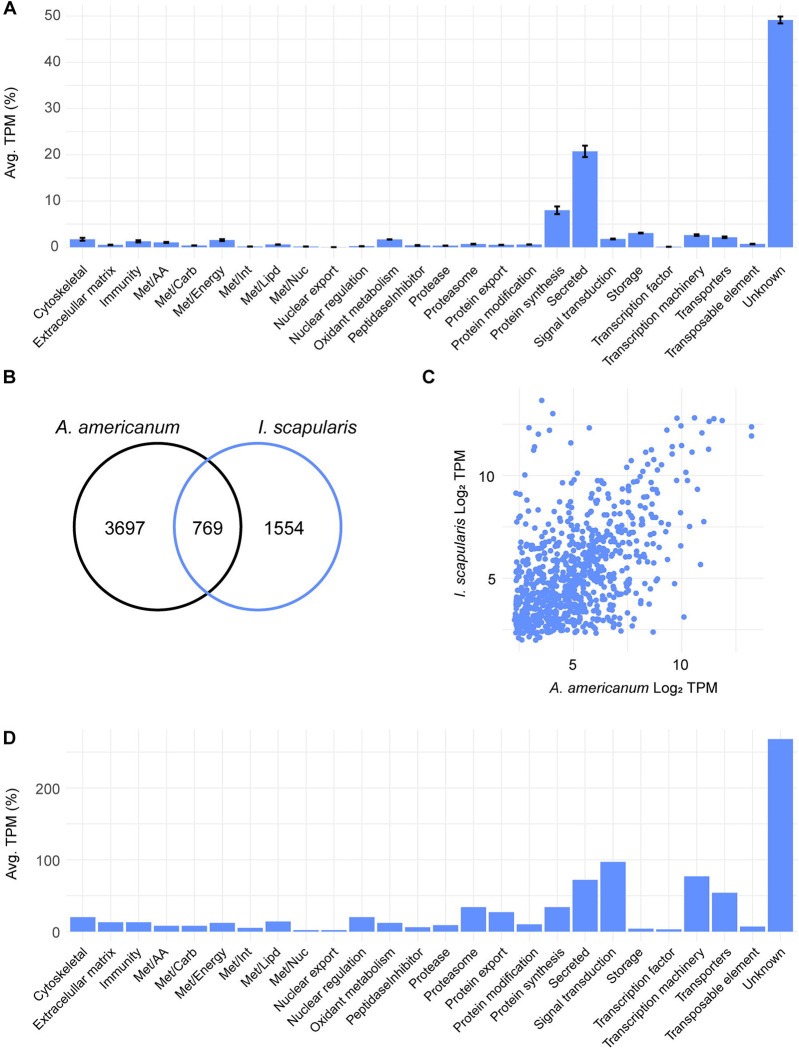
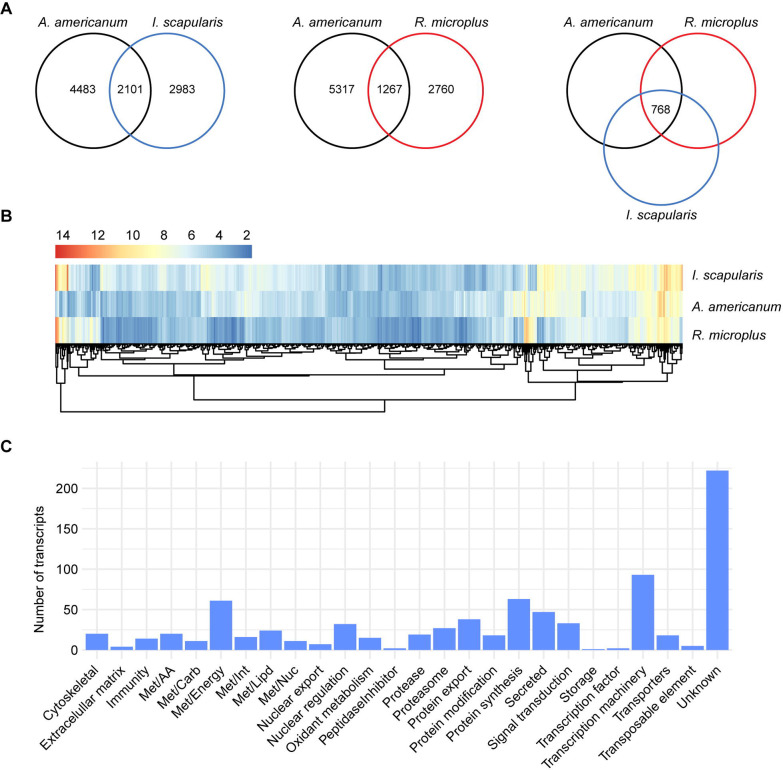
Results: We conducted a comprehensive longitudinal transcriptome analysis of the midgut in adult female A. americanum ticks across various feeding stages, including unfed, slow-feeding, and rapid-feeding phases. Our analysis revealed 15,599 putative DNA coding sequences (CDS) classified within 26 functional groups. Dimensional and differential expression analysis highlighted the dynamic transcriptional changes in the tick midgut as feeding progresses, particularly during the initial period of feeding and the transition from the slow-feeding to the rapid-feeding phase. Additionally, we performed an orthology analysis comparing our dataset with midgut transcriptomes from other hard ticks, such as Ixodes scapularis and Rhipicephalus microplus. This comparison allowed us to identify transcripts commonly expressed during different feeding phases across these three species.

Conclusion: Our findings provide a detailed temporal resolution of numerous metabolic pathways in A. americanum, emphasizing the dynamic transcriptional changes occurring in the tick midgut throughout the feeding process. Furthermore, we identified conserved transcripts across three different tick species that exhibit similar expression patterns. This knowledge has significant implications for future research aimed at deciphering the physiological pathways relevant within the tick midgut. It also offers potential avenues for developing control methods that target multiple tick species.

Keywords: RNA-sequencing; blood meal digestion; midgut; ticks.


Figures

Figure 1:
Figure 1:
Overview of the transcriptome profile of Amblyomma americanum midgut at different feeding stages. (A) Representative images of A. americanum adult females collected at different feeding stages and their (B) average weight (± standard deviation of the mean). (C) Multidimension plot of the transcripts identified in A. americanum midgut with TPM ≥ 5 in at least one of the biological conditions. (D) Heatmap plot of the normalized TPM values of each transcript with TPM ≥ 5 identified in A. americanum midgut at each feeding stage.
Figure 2:
Figure 2:
Volcano plots showing the differentially expressed transcripts obtained from the pairwise comparisons between the groups (A) G1 and unfed (UF), (B) G2 and G1, (C) G3 and G2, (D) G4 and G3, (E) G5 and G4, and (F) G6 – G5. The groups G1 – G6 represents ticks in different feeding stages that were group by their average weight; (G1) 6.4 ± 0.60 mg, (G2) 16.4 ± 1.82 mg, (G3) 24.7 ± 3.24 mg, (G4) 67.2 ± 7.30 mg, (G5) 373.9 ± 34.48 mg and (G6) 577.0 ± 88.50 mg. Statistical difference was considered when a transcript presented a LogFC higher than 2 or lesser than −2 (vertical dotted lines), alongside a false discovery rate (FDR) ≤ 0.05 (horizontal dotted lines). Upregulated transcripts are shown as blue dots, downregulated transcripts are shown as red dots and gray dots represents transcripts that were not considered differentially expressed. Numbers inside each plot indicates de number of transcripts differentially expressed.
Figure 3:
Figure 3:
Relative quantification of the 26 functional classes over the different feeding stages of A. americanum midgut. Dots represent the average TPM (%) of each class at each biological condition. The error bars represent the standard deviation of the mean.
Figure 4:
Figure 4:
The transcriptional profile of unfed A. americanum adult female midgut. (A) Functional classification of 4,466 CDS abundant in the midgut of unfed ticks. Bars represent the average transcript per million (TPM) of each class, the error bars represent the standard deviation of the mean and the number inside each bar indicates the total number of transcripts classified within each class. Comparison between the abundant transcripts found in the midgut of unfed A. americanum and I. scapularis. (B) Venn diagram represent the number of transcripts unique and orthologous between both ticks. (C) Scatter plot of the Log2TPM of the 769 orthologous transcripts in the midgut of unfed adult females. (D) Functional classification of the shared transcripts between the unfed midguts of A. americanum and I. scapularis adult females. Bars represent the number of coding sequences (CDS) identified within each class.
Figure 5:
Figure 5:
Comparison of the transcriptional profile of the midgut of slow-feeding A. americanum, I. scapularis, and R. microplus. (A) Venn diagrams displaying the number of unique and orthologous transcripts across the different tick species. (B) Heatmap plot based on the Log2TPM of the 768 orthologous transcripts and their (C) functional classification.

Similar articles

References

    1. Springer Y. P., Eisen L., Beati L., James A. M., Eisen R. J., Spatial distribution of counties in the continental United States with records of occurrence of Amblyomma americanum (Ixodida: Ixodidae). J Med Entomol 51, 342–351 (2014). - PMC - PubMed
    1. Sonenshine D. E., Range Expansion of Tick Disease Vectors in North America: Implications for Spread of Tick-Borne Disease. Int J Environ Res Public Health 15 (2018). - PMC - PubMed
    1. Anderson B. E. et al., Amblyomma americanum: a potential vector of human ehrlichiosis. Am J Trop Med Hyg 49, 239–244 (1993). - PubMed
    1. C. E. a. D. Hopla C.M., The Isolation of Bacterium Tularense from the Tick, Amblyomma Americanum. Journal of the Kansas Entomological Society 26, 2 (1953).
    1. James A. M. et al., Borrelia lonestari infection after a bite by an Amblyomma americanum tick. J Infect Dis 183, 1810–1814 (2001). - PubMed

Publication types

LinkOut - more resources