[Preprint]. 2024 Jul 13:2024.07.12.603320.
doi: 10.1101/2024.07.12.603320.

REAL-TIME VISUALIZATION OF SPLICEOSOME ASSEMBLY REVEALS BASIC PRINCIPLES OF SPLICE SITE SELECTION

Affiliations

REAL-TIME VISUALIZATION OF SPLICEOSOME ASSEMBLY REVEALS BASIC PRINCIPLES OF SPLICE SITE SELECTION

Benjamin T Donovan et al. bioRxiv. .

Abstract

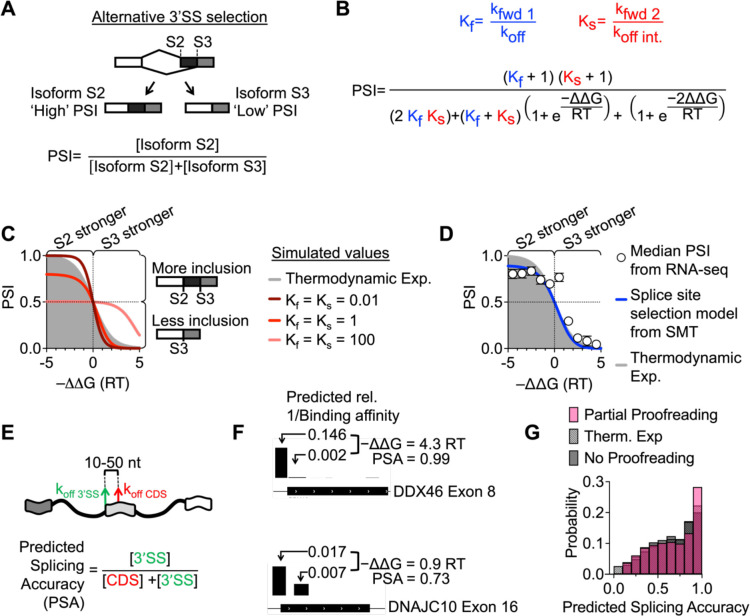
The spliceosome is a megadalton protein-RNA complex which removes introns from pre-mRNA, yet the dynamic early assembly steps have not been structurally resolved. Specifically, how the spliceosome selects the correct 3' splice site (3'SS) amongst highly similar non-functional sites is not known. Here, we develop a kinetic model of splice site selection based on single-molecule U2AF heterodimer imaging in vitro and in vivo. The model successfully predicts alternative splicing patterns and indicates that 3'SS selection occurs while U2AF is in complex with the spliceosome, not during initial binding. This finding indicates the spliceosome operates in a 'partial' kinetic proofreading regime, catalyzed in part by the helicase DDX42, which increases selectivity to the underlying U2AF binding site while still allowing for efficient forward progression.


Figures

Figure 1:
Figure 1:. In vitro characterization of U2AF binding transcriptome wide
A. Full length U2AF was purified from insect cells. We tested functionality by electrophoresis mobility shift assay (EMSA). B. Measuring U2AF binding to all possible 12mers in parallel with RNA Bind-N-Seq. U2AF heterodimer was mixed with a random pool of RNAs. Bound RNAs were isolated by U2AF1-FLAG IP and sequenced. The plot displays the distribution enrichment ((R = FreqIP /Freqinput) segregated by number of uridines in 12mer (this data represents enrichment for 20 nM U2AF, n=2 replicates). C. The distribution of significantly enriched RNAs containing -AG dinucleotide. D. The enrichment ratio of an –AG containing sequence relative to an otherwise identical –GA containing sequence segregated by position of the -AG/-GA in the 12mer. E. Prediction of free energy contribution of each nucleotide using probound. F. Validating probound with competitive binding assays resolved by EMSA (see Fig. S2). Error bars represent one standard devation. G. Assigning U2AF binding affinity to in vivo binding sites detected with PAR-CLIP. In the browser shot of RAB7A, the height of each bar represents binding affinity relative to the sequence in (E). H. Adopting the PIFE assay to detect U2AF binding in vitro by bulk fluorescence. U2AF binding results in a ~1.5 fold increase in fluorescence (n=2 replicates). As a control, we also performed the assay in the absence of RNA and find that intrinsic U2AF autofluorescence contributes very little to measured emission. I. Plotting relative change in fluorescence when titrating U2AF. Fitting with non-cooperative Hill Function (KD=27±7nM) agrees with EMSA measurements. Error bars represent one standard deviation. J. Applying the PIFE assay to the single-molecule level. RNAs are tethered to glass microscope slide through biotin-neutravidin linkage. Single surface-tethered RNAs are illuminated by Total Internal Fluorescence Reflection (TIRF) microscopy. K. U2AF binding and dissociation on individual RNAs is inferred from two-state Hidden Markov Model. L. EMSA of U2AF binding to an RNA with a mutated pyrimidine tract. M. U2AF binding rate to the AdML and mutant 3’ SS (KonAdML=0.0010±0.0001nM-1s-1, konMutant=0.0011±0.0002nM-1s-1) (n=3 replicates for AdML, n=2 replicates for Mutant 3’SS). Error bars represent one standard deviation. N. Left: plotting U2AF dwell times for all replicates to AdML (n=9 measurements) and Mutant (n=6 measurements) 3’SS. Dotted lines represent individual replicates and solid lines represent average of all replicates. Right: Comparing U2AF dissociation rate from the AdML and mutant 3’SS at three concentrations of U2AF. U2AF dissociates about 1.5-fold faster from the mutant 3’SS (koffAdML=0.057±0.003s-1, koffMutant=0.085±0.003s-1). Error bars represent one standard deviation. O. Comparing the distribution of U2AF binding affinities (relative to consensus sequence in Fig. 1E) for different binding site types. This plot only contains binding affinities within the range that were validated in Fig. 1F (>370-fold weaker than consensus). A speculative range of dwell times for these interactions is included on the top x-axis.
Figure 2:
Figure 2:. Single-molecule visualization of spliceosome assembly reveals stable U2AF binding through multiple assembly intermediates.
A) Western blot of HBEC line containing one copy of U2AF1–3XFLAG-HALO, subsequently referred to as U2AF1-HALO. B) Fast tracking of U2AF1-HALO diffusion throughout the nucleus imaged with Highly Inclined and Laminated Optical Sheet (HILO) illumination at 100 Hz over 10 seconds. Bound and unbound states were inferred using a 2 state HMM model. We analyzed tracks that show complete binding events (i.e. bound event flanked by two unbound events) (n=2 replicates). C) Kymographs comparing U2AF1-HALO and H2B-HALO diffusion in fast tracking assays. D) Dwell times of complete binding events measured in fast tracking assays. E) Slow tracking U2AF1-HALO diffusion throughout the nucleus at 0.33 Hz over 20 minutes (n=3 replicates, shaded region represents 95% CI). For comparison, in vitro U2AF dwell time distributions from Fig. 1N are also included. F) Treating cells with pladienolide B (PB) results in a reduction in U2AF1-HALO dwell times (n=3 replicates). Shaded region represents 95% CI. G) Interpreting slow SMT data which detects U2AF dissociation from spliceosome complexes with a splice site selection model (intermediate and A complex states highlighted in gray box). Data is fit so that koffint. and koffA are the same for both control and PB datasets. Blue highlighted rates represent Kf, the ratio of spliceosome forward progression with respect to U2AF dissociation at the E complex Kf=kfwd1/koff. Red highlighted rates represent Ks, the ratio of spliceosome forward progression with respect to U2AF dissociation at the intermediate state Ks=kfwd2/koffInt.). H) Model fitting reveals pladienolide B reduces kfwd2, the transition rate from intermediate to A complex by 2-fold. Additionally, our fits indicate U2AF remains bound in the intermediate state for 9.1 ± 0.4 seconds and the A complex for 82 ± 21 seconds. I) We used CRISPR to integrate a HALO tag on the C-terminus of U2AF1 in a cell line containing 24 MS2 stem loops integrated about 4kb upstream of the first 3’SS in MYH9. These cells also contain GFP-MS2 coat protein (MCP) so that upon transcription of stem loops, MCP binds and enables detection of RNA. J) Overnight confocal imaging of MYH9 transcription sites reveals both transcription (transition to high fluorescent state) and splicing (transition back to low fluorescent state). K) Fluctuations were analyzed by correlation analysis and indicates a characteristic time of 19 ± 2 min for transcription and splicing. Error bars represent one standard deviation. L) 3D orbital tracking: a laser orbits above and below the transcription site. By monitoring the intensity in the XY plane as well as in Z, the particle is tracked in three dimensions. We tracked MYH9-GFP while monitoring U2AF diffusion in and out of the confocal volume in another channel. M) Example traces of MYH9 splicing and U2AF binding. Imaging was performed at 4 Hz over 20 minutes. Splicing manifests as a sudden decrease in GFP signal. N) Autocorrelation of time traces in U2AF channel corresponds to dwell times of τcontrol=1.7±0.1min, τPB:1.3±0.1min. Error bars represent one standard deviation. O) U2AF→MYH9 cross-correlations are centered around 0 indicating overlap between MYH9 and U2AF events. Additionally, the width of the cross-correlation curves represent the time to splice (τsplicecontrol=16±1min, τsplicePB=27±1min). Error bars represent one standard deviation. P) Summary of findings from SMT and OT experiments. U2AF binds for about 2 minutes to a pre-mRNA undergoing the splicing reaction. While U2AF dwell times are shorter after treatment with PB, overall time to splice increases.
Figure 3:
Figure 3:. A kinetic model of splice site selection
A) Alternative 3’SS selection. U2AF may bind to initiate spliceosome assembly at two competing 3’SSs, S2 and S3. B) Applying the kinetic model developed in figure 2 to the process of alternative 3’SS selection. This equation relates relative U2AF dissociation rate (-ΔΔG=RTlnkoff3/koff2 to percent spliced in (PSI). While the Probound binding model in Fig. 1 initially reports relative binding affinities instead of dissociation rates, we assume only dissociation rates (and not association rates) depend on sequence and, therefore, use koff instead of KD in our -ΔΔG calculation. C) The predicted relationship between -ΔΔG and PSI described by equation 2. The gray plot shows the expected relationship between PSI and ΔΔG in the scenario where splice site selection depends entirely on the relative equilibrium binding affinity between sites S2 and S3. The maroon curve represents the ‘full proofreading’ scenario where U2AF reads the 3’SS twice and both Kf and Ks1. Increasing Kf and Ks reduces the role of underlying U2AF binding affinity in splice site choice. For example, when Kf and Ks=100 (salmon curve), PSI asymptotes at 0.5 at negative -ΔΔG. D) We performed RNA sequencing and quantified alternative splicing in HBECs. PSI values were binned by -ΔΔG, the free energy of U2AF binding the S3 site relative to the S2 site. White circles represent median PSI of each bin. Error bars represent the average standard deviation of PSI for each alternative 3’SS (n = 2 replicates). The blue curve represents the predicted relationship between PSI and -ΔΔG based on slow SMT measurements Ks=0.15). KF can be fixed to any value above 10. E) Determining predicted splicing accuracy (PSA) by applying equation 2 for U2AF binding affinity at 3’SSs relative to sites in downstream coding regions (10–50 nt downstream). F) Comparing predicted U2AF binding affinity at 3’SSs with respect to downstream sites in coding regions. The height of each bar corresponds to 1 / relative binding affinity. We used the measured rates from the SMT assays to calculate PSA. G) The distribution of predicted splicing accuracy (PSA) for a non-proofreading ‘bind-once’ model (gray, Ks=0.15 ), thermodynamic expectation (patterned), and partial proofreading model (pink, Kf=10 and Ks=0.15). The partial proofreading model predicts the highest splicing accuracy. U2AF binding locations come from PAR-CLIP measurements and we only measured pairs of sites where predicted relative binding affinity for both sites is more than 0.1% of the highest affinity sequence.
Figure 4.
Figure 4.. DDX42 accelerates U2AF dissociation from intermediate state and A complex
A) Top: Workflow for U2AF1-FLAG IP-MS from HBEC nuclear extract. Bottom: Ranking identified proteins by signal-to-noise (where control is parental HBEC cell line). Other than U2AF1 and U2AF2, DDX42 is the most enriched splicing factor (n = 3 replicates). B) Plotting enrichment of proteins associated with U1, U2, and the tri-snRNP from our U2AF1 IP-MS assay. The protein components of each snRNP were determined using the spliceosome database (38). C) Western blot after U2AF1-FLAG IP confirms U2AF1-DDX42 interaction. D) Comparing U2AF1 dwell time distributions in the slow SMT assay after electroporation with DDX42 or Control siRNA. Fitting to the kinetic model from Fig. 2G reveals a reduction in koffInt., and koffA. Error bars in bar chart represent standard error of the mean from 3 replicates. E) Measuring U2AF dwell times after knockdown of DDX39B (n = 1 replicate). Error bars represent standard deviation of 1000 bootstrapping iterations. F) Predicting the change in PSI (PSIsiDDX42-PSIsiControl) after DDX42 knockdown based on the change in Ks measured in slow SMT. Red dashed lines represent predicted PSI, white circles represent mean ΔPSI for binned -ΔΔG values from RNA sequencing. This analysis was performed on alternative 3’SSs where U2AF affinity to both sites was within 50-fold of the ideal site (6994/24112 alternative 3’SSs). G) The relationship between PSI and ΔΔG for the 854 3’SSs that exhibit significant splicing changes after DDX42 knockdown (P<0.05). H) For this subset of alternative 3’SSs, DDX42 knockdown increases Ks by 5.9 ± 1.5-fold. Error bars represent one standard deviation. I) Autocorrelation of the U2AF time traces from the orbital tracking measurements after DDX42 knockdown show that, on a pre-mRNA undergoing the splicing reaction, U2AF dwell times are longer (τboundU2AFsiDDX42=5.8±0.2min, τboundU2AFsiCont=1.7±0.1min). Error bars represent one standard deviation. J) U2AF→MYH9 cross-correlation broadens after DDX42 knockdown, indicating slower overall splicing (τspliceU2AFsiDDX42=30±1min, τspliceU2AFsiCont=16±1min). Error bars represent one standard deviation. K) Interpretation of SMT and orbital tracking data: DDX42 knockdown prolongs both U2AF binding and MYH9 splicing. L) Example time traces of gene trap cell line showing transcription and splicing events. M) Measuring changes splicing kinetics globally with the gene trap cell line τ1/2siControl=18min, τ1/2siDDX42=26min. Shaded regions represent one SEM (n=4 replicates for siControl, n=2 replicates for siDDX42). N) Comparing predicted splicing accuracy (as in figure 3E–G) for 3’SSs in competition with binding sites in nearby downstream coding regions for three regimes of the proofreading model, full Kf=0.1,Ks=0.15, partial Kf=10,Ks=0.15, and none Kf=10,Ks=10. O) Comparing the fraction of bound U2AF molecules in the A complex for the three scenarios introduced in N. While figure N establishes that full proofreading is the most accurate, it is also very slow, at best, only ~1% of bound U2AF molecules are in the A complex at a specific time.

References

    1. Hoskins A. A., Moore M. J., The spliceosome: a flexible, reversible macromolecular machine. Trends Biochem Sci 37, 179–188 (2012). - PMC - PubMed
    1. Jurica M. S., Moore M. J., Pre-mRNA splicing: awash in a sea of proteins. Mol Cell 12, 5–14 (2003). - PubMed
    1. Nilsen T. W., Graveley B. R., Expansion of the eukaryotic proteome by alternative splicing. Nature 463, 457–463 (2010). - PMC - PubMed
    1. Duff M. O., Olson S., Wei X., Garrett S. C., Osman A., Bolisetty M., Plocik A., Celniker S. E., Graveley B. R., Genome-wide identification of zero nucleotide recursive splicing in Drosophila. Nature 521, 376–379 (2015). - PMC - PubMed
    1. Sibley C. R., Emmett W., Blazquez L., Faro A., Haberman N., Briese M., Trabzuni D., Ryten M., Weale M. E., Hardy J., Modic M., Curk T., Wilson S. W., Plagnol V., Ule J., Recursive splicing in long vertebrate genes. Nature 521, 371–375 (2015). - PMC - PubMed

Publication types

LinkOut - more resources