[Preprint]. 2024 Sep 25:2024.09.24.614721.
doi: 10.1101/2024.09.24.614721.

Complex genetic variation in nearly complete human genomes

Glennis A Logsdon  1   2 Peter Ebert  3   4 Peter A Audano  5 Mark Loftus  6   7 David Porubsky  2 Jana Ebler  8   4 Feyza Yilmaz  5 Pille Hallast  5 Timofey Prodanov  8   4 DongAhn Yoo  2 Carolyn A Paisie  5 William T Harvey  2 Xuefang Zhao  9   10 Gianni V Martino  6   7   11 Mir Henglin  8   4 Katherine M Munson  2 Keon Rabbani  12 Chen-Shan Chin  13 Bida Gu  12 Hufsah Ashraf  8   4 Olanrewaju Austine-Orimoloye  14 Parithi Balachandran  5 Marc Jan Bonder  15   16 Haoyu Cheng  17 Zechen Chong  18 Jonathan Crabtree  19 Mark Gerstein  20   21 Lisbeth A Guethlein  22 Patrick Hasenfeld  23 Glenn Hickey  24 Kendra Hoekzema  2 Sarah E Hunt  14 Matthew Jensen  20   21 Yunzhe Jiang  20   21 Sergey Koren  25 Youngjun Kwon  2 Chong Li  26   27 Heng Li  28   29 Jiaqi Li  20   21 Paul J Norman  30   31 Keisuke K Oshima  1 Benedict Paten  24 Adam M Phillippy  25 Nicholas R Pollock  30 Tobias Rausch  23 Mikko Rautiainen  32 Stephan Scholz  33 Yuwei Song  18 Arda Söylev  8   4 Arvis Sulovari  2 Likhitha Surapaneni  14 Vasiliki Tsapalou  23 Weichen Zhou  34 Ying Zhou  28   29 Qihui Zhu  5   35 Michael C Zody  36 Ryan E Mills  34 Scott E Devine  19 Xinghua Shi  26   27 Mike E Talkowski  9   10   37 Mark J P Chaisson  12 Alexander T Dilthey  4   33 Miriam K Konkel  6   7 Jan O Korbel  23 Charles Lee  5 Christine R Beck  5   38 Evan E Eichler  2   39 Tobias Marschall  8   4
Affiliations

Complex genetic variation in nearly complete human genomes

Glennis A Logsdon et al. bioRxiv. .

Update in

  • Complex genetic variation in nearly complete human genomes.
    Logsdon GA, Ebert P, Audano PA, Loftus M, Porubsky D, Ebler J, Yilmaz F, Hallast P, Prodanov T, Yoo D, Paisie CA, Harvey WT, Zhao X, Martino GV, Henglin M, Munson KM, Rabbani K, Chin CS, Gu B, Ashraf H, Scholz S, Austine-Orimoloye O, Balachandran P, Bonder MJ, Cheng H, Chong Z, Crabtree J, Gerstein M, Guethlein LA, Hasenfeld P, Hickey G, Hoekzema K, Hunt SE, Jensen M, Jiang Y, Koren S, Kwon Y, Li C, Li H, Li J, Norman PJ, Oshima KK, Paten B, Phillippy AM, Pollock NR, Rausch T, Rautiainen M, Song Y, Söylev A, Sulovari A, Surapaneni L, Tsapalou V, Zhou W, Zhou Y, Zhu Q, Zody MC, Mills RE, Devine SE, Shi X, Talkowski ME, Chaisson MJP, Dilthey AT, Konkel MK, Korbel JO, Lee C, Beck CR, Eichler EE, Marschall T. Logsdon GA, et al. Nature. 2025 Aug;644(8076):430-441. doi: 10.1038/s41586-025-09140-6. Epub 2025 Jul 23. Nature. 2025. PMID: 40702183 Free PMC article.

Abstract

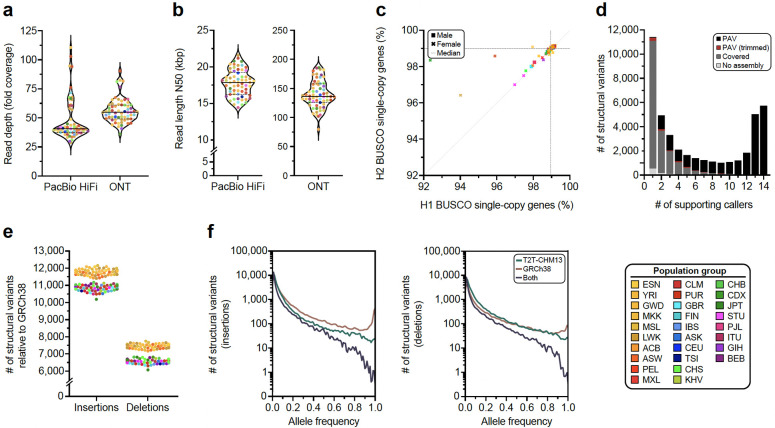
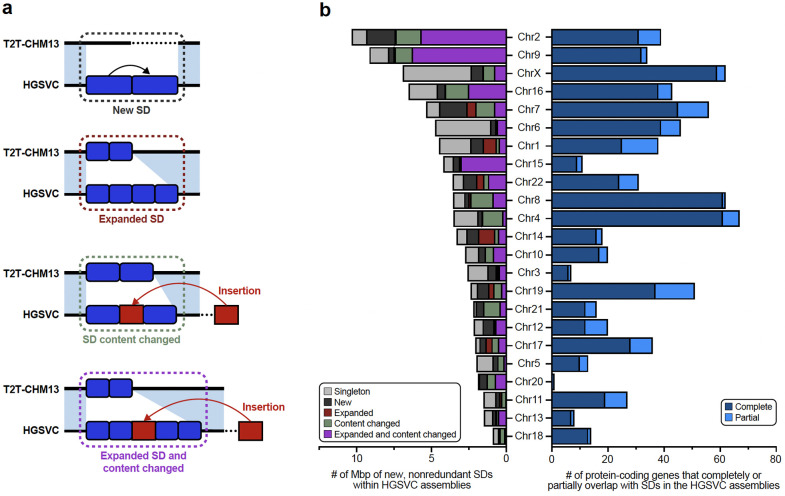
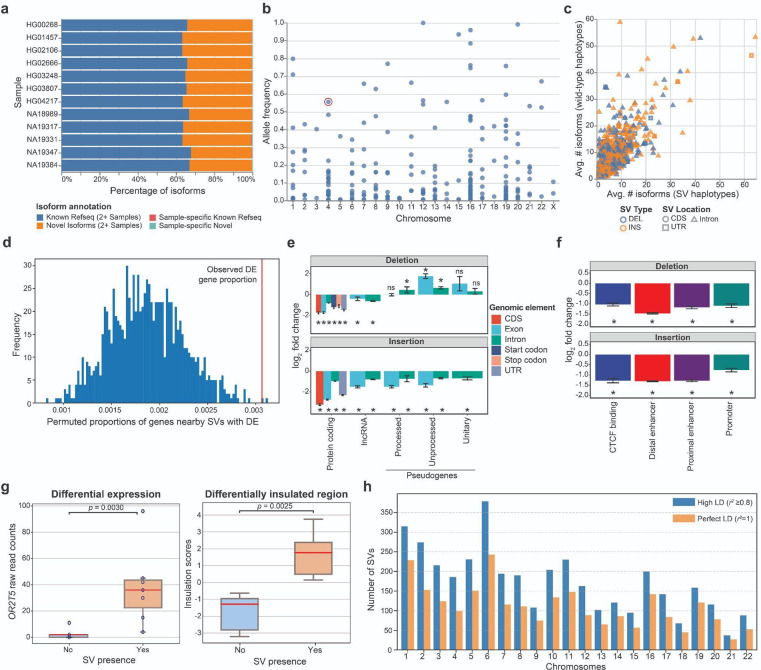
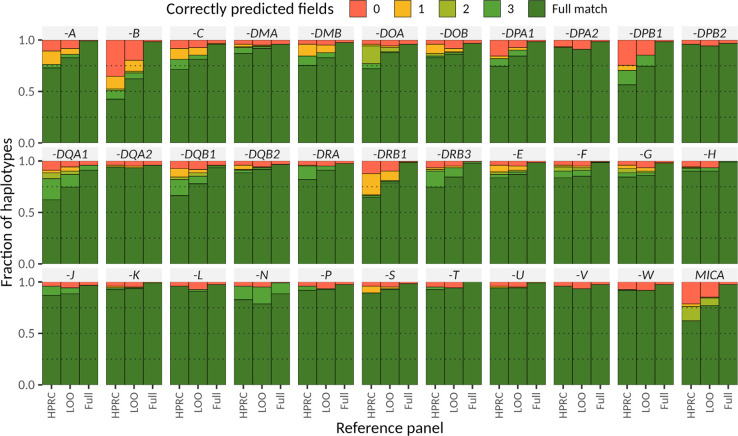
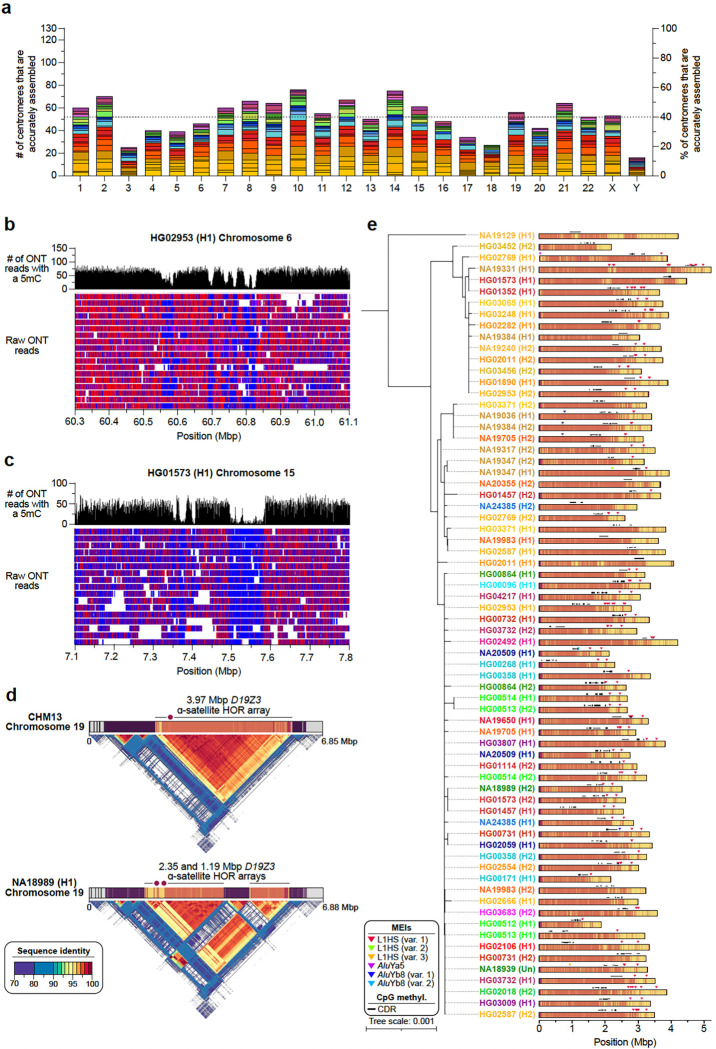
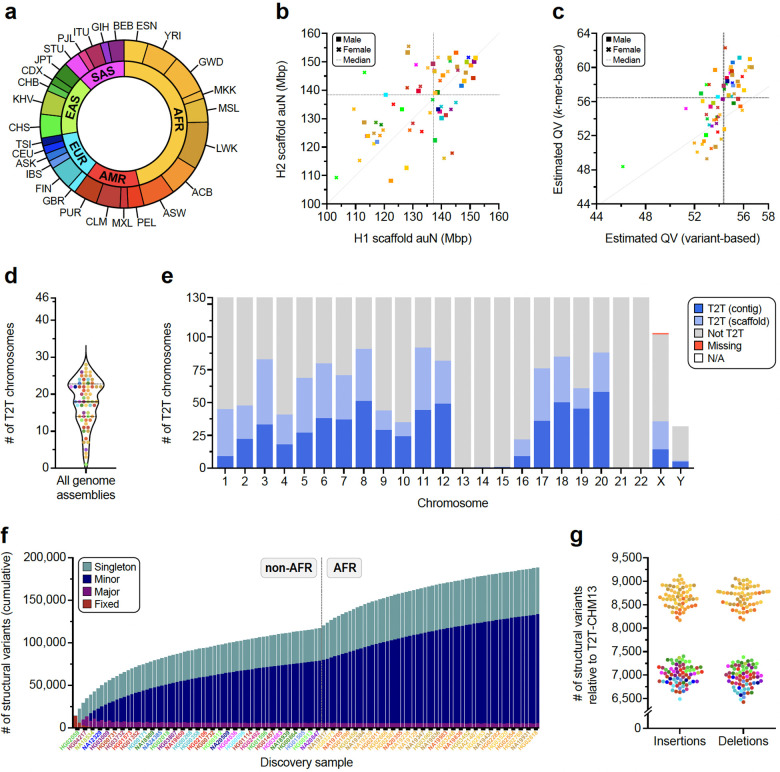
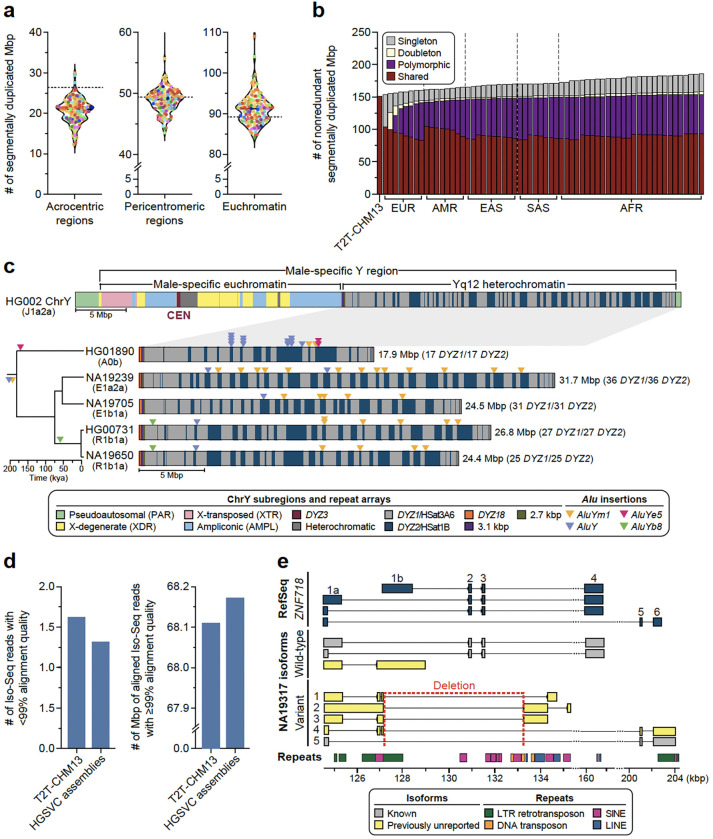
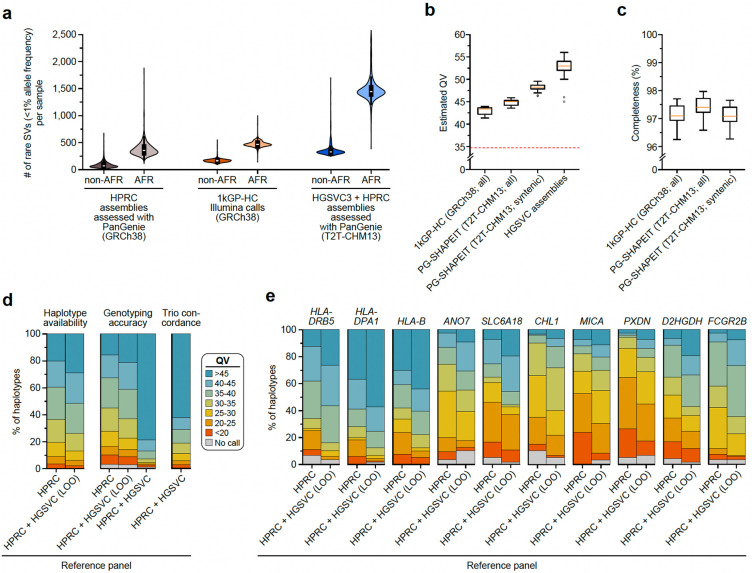
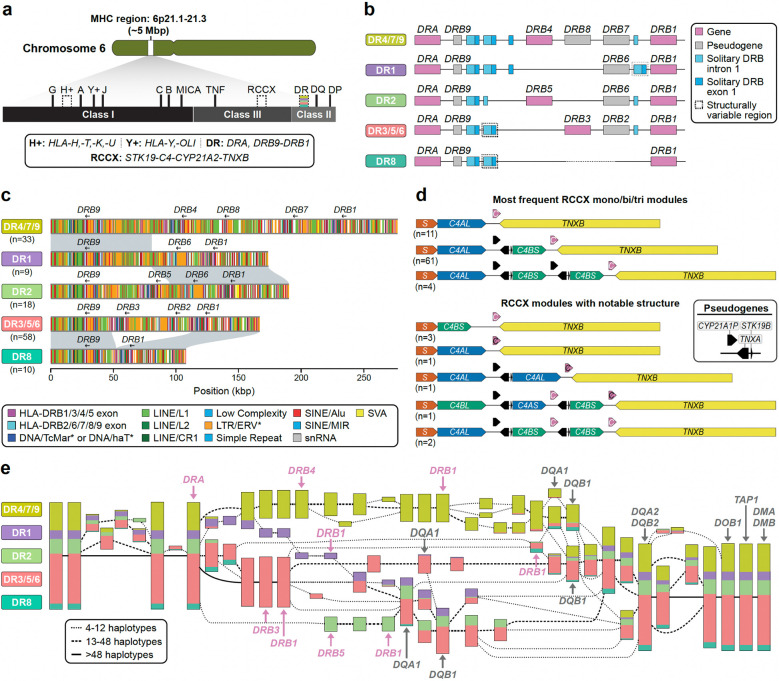
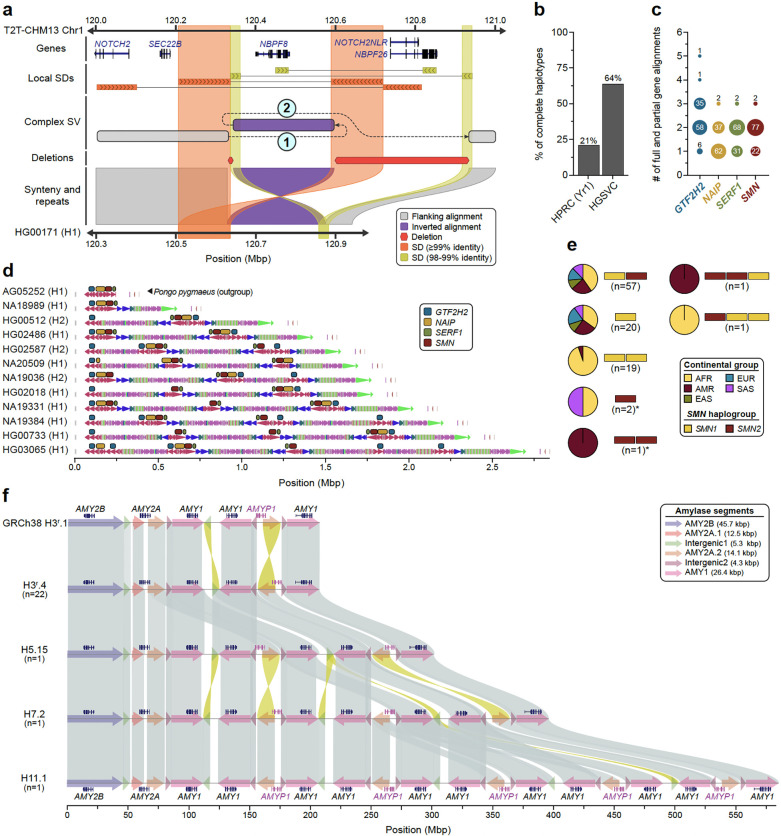
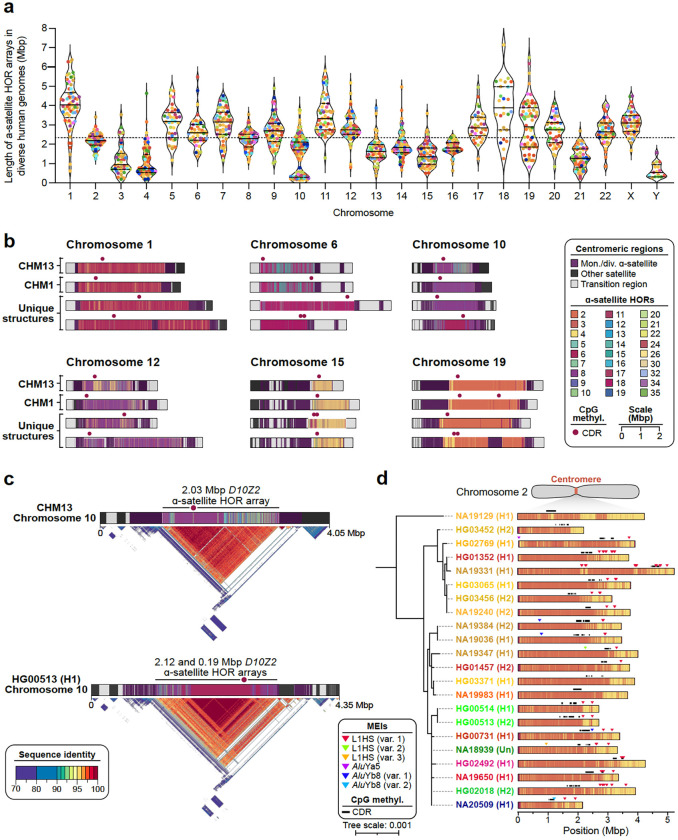
Diverse sets of complete human genomes are required to construct a pangenome reference and to understand the extent of complex structural variation. Here, we sequence 65 diverse human genomes and build 130 haplotype-resolved assemblies (130 Mbp median continuity), closing 92% of all previous assembly gaps1,2 and reaching telomere-to-telomere (T2T) status for 39% of the chromosomes. We highlight complete sequence continuity of complex loci, including the major histocompatibility complex (MHC), SMN1/SMN2, NBPF8, and AMY1/AMY2, and fully resolve 1,852 complex structural variants (SVs). In addition, we completely assemble and validate 1,246 human centromeres. We find up to 30-fold variation in α-satellite high-order repeat (HOR) array length and characterize the pattern of mobile element insertions into α-satellite HOR arrays. While most centromeres predict a single site of kinetochore attachment, epigenetic analysis suggests the presence of two hypomethylated regions for 7% of centromeres. Combining our data with the draft pangenome reference1 significantly enhances genotyping accuracy from short-read data, enabling whole-genome inference3 to a median quality value (QV) of 45. Using this approach, 26,115 SVs per sample are detected, substantially increasing the number of SVs now amenable to downstream disease association studies.


Conflict of interest statement

Competing Interests E.E.E. is a scientific advisory board member of Variant Bio, Inc. C. Lee is a scientific advisory board member of Nabsys and Genome Insight. S.K. has received travel funds to speak at events hosted by Oxford Nanopore Technologies. The following authors have previously disclosed a patent application (No. EP19169090) relevant to Strand-seq: J.O.K., T.M., and D.P. The other authors declare no competing interests.

Figures

Extended Data Figure 1.
Extended Data Figure 1.. Statistics of long-read sequencing data and genome assemblies generated in this study as well as variant calls for 65 diverse human genomes.
a) Fold coverage of the Pacific Biosciences (PacBio) high-fidelity (HiFi) and Oxford Nanopore Technologies (ONT) long-read sequencing data generated for each genome in this study. The median (solid line) and first and third quartiles (dotted lines) are shown. b) Read length N50 of the PacBio HiFi and ONT data generated for each genome in this study. The median (solid line) and first and third quartiles (dotted lines) are shown. c) Gene completeness as a percentage of BUSCO single-copy orthologs detected in each haplotype from each genome assembly (Methods). d) The number of structural variants (SVs) detected by the Phased Assembly Variant (PAV) caller. Before applying caller-based QC, 99.75% of PAV calls are supported by at least one other call source. PAV, variant supported by PAV; PAV (trimmed), variant was removed when PAV trimmed repetitive bases mapped multiple times; Covered, region covered by an assembly, but no comparable SV found by PAV; No Assembly, SV occurs in a region where an assembly sequence was not aligned. e) Number of SVs called for each haplotype relative to the GRCh38 reference genome, colored by population. Insertions and deletions are imbalanced when called against the GRCh38 reference genome but balanced when called against the T2T-CHM13 reference genome (Fig. 1g). f) Number of SV insertions (left) and deletions (right) called against the T2T-CHM13 reference genome, GRCh38 reference genome, or both relative to their allele frequency. SVs called against both references tend to be more rare because they are less likely to appear in a reference genome. A sharp peak for high allele frequency (~1.0) for insertions is detected relative to the GRCh38 reference genome but not the T2T-CHM13 reference genome.
Extended Data Figure 2.
Extended Data Figure 2.. Classification and distribution of changes in SD content in the 65 genomes.
a) Schematic depicting the four categories of non-reference SDs: 1) new (i.e., unique in the reference), 2) expanded copy number, 3) content or composition changed, and 4) expanded and content changed SDs with respect to the SDs in the reference genome, T2T-CHM13. b) Quantification in terms of Mbp and predicted protein-coding genes across the four categories of new SDs compared to T2T-CHM13. The left panel shows the Mbp by category, while flagging those that are singleton (i.e., duplicated in T2T-CHM13 but not in other genomes). The right panel quantifies the number of complete (100% coverage) and partial overlaps (>50% coverage) with protein-coding genes for the respective chromosomes.
Extended Data Figure 3.
Extended Data Figure 3.. Effects of SVs on gene expression, chromosome conformation, and complex traits.
a) The percentage of Iso-Seq isoforms identified for each sample classified as novel (present in at least two samples; orange), previously identified in RefSeq (present in at least two samples; blue), sample-specific novel (teal), or sample-specific previously identified isoforms (red). b) Manhattan plot of the allele frequencies for 256 SVs disrupting protein-coding exons of 136 genes with expression present in Iso-Seq. Circled in red is the 6,142 bp polymorphic deletion in ZNF718. c) Comparison of the average unique isoforms in Iso-Seq phased to wild-type and variant haplotypes for 1,471 single SV-containing protein-coding genes. The color represents the type of SV (deletion: blue, insertion: orange) and the shape indicates where the SV occurs in relation to the canonical transcript (circle: coding sequence [CDS], square: UTR, triangle: intron). d) Proportion of genes located within 50 kbp of SV regions that show differential expression (DE) (RNA-seq) among individuals who carry the SVs (red line), compared with the distribution of DE gene proportions nearby simulated SV regions (1,000 permutations). e) Enrichments and depletions of SVs within GENCODE v45 protein-coding, long noncoding RNA (lncRNA), and pseudogene elements, subdivided into various biotypes. *empirical p<0.05 with Benjamini-Hochberg correction. ns, nonsignificant. Error bars indicate s.d. f) Enrichments and depletions of SVs within classes of ENCODE candidate cis-regulatory elements (cCREs). *empirical p<0.05 with Benjamini-Hochberg correction. ns, nonsignificant. Error bars indicate s.d. g) A differentially insulated region (DIR) in individuals with chr1–248444872-INS-63 SV, located nearby the DE gene OR2T5, suggests an SV-mediated novel chromatin domain could lead to increased gene expression. Box plots indicate first and third quartile, with whiskers extending to 1.5 times the interquartile range. h) Number of SVs per chromosome that are in high (r2>0.8) or perfect (r2=1) linkage disequilibrium (LD) with GWAS SNPs significantly associated with diseases and human traits.
Extended Data Figure 4.
Extended Data Figure 4.. Locityper genotyping accuracy across 33 genes/pseudogenes, located at the MHC locus.
Genotyping was performed for 61 Illumina short-read HGSVC datasets using three reference panels: HPRC (90 haplotypes), leave-one-out HPRC + HGSVC (LOO, 214 haplotypes), and HPRC + HGSVC (full, 216 haplotypes). Accuracy is evaluated as the number of correctly identified allele fields in the corresponding gene nomenclature.
Extended Data Figure 5.
Extended Data Figure 5.. Assembly of 1,246 human centromeres across 65 diverse human genomes show genetic and epigenetic variation.
a) Number of completely and accurately assembled centromeres across 65 diverse human genomes, colored by population group. Mean, dashed line. b,c) Examples of di-kinetochores, defined as two CDRs located >80 kbp apart from each other, on the b) HG02953 Chromosome 6 centromere and c) HG01573 Chromosome 15 centromere. Ultra-long ONT reads span both CDRs in each case, indicating that the CDRs occur on the same chromosome in the cell population. d) Differences in the ɑ-satellite HOR array organization and methylation patterns between the CHM13 and NA18989 (H1) chromosome 19 centromeres. The NA18989 (H1) chromosome 19 centromere has two CDRs, indicating the potential presence of a di-kinetochore. e) Mobile element insertions (MEIs) in the Chromosome 2 centromeric α-satellite HOR array. Most MEIs are consistent with duplications of the same element rather than distinct insertions, and all of them reside outside of the CDR.
Figure 1.
Figure 1.. Long-read sequencing, assembly, and variant calling of 65 diverse human samples.
a) Continental group (inner ring) and population group (outer ring) of the 65 diverse human samples analyzed in this study. b) Scaffold auN for haplotype 1 (H1) and haplotype 2 (H2) contigs from each genome assembly. Data points are color-coded by population and sex. Dashed lines indicate the median auN per haplotype. The dotted line indicates the unit diagonal. c) QV estimates for each genome assembly derived from variant calls or k-mer statistics (Methods). d) The number of chromosomes assembled from telomere-to-telomere (T2T) for each genome assembly, including both single contigs and scaffolds (Methods). The median (solid line) and first and third quartiles (dotted lines) are shown. e) The number of T2T chromosomes in a single contig (dark blue, T2T contig) or in a single scaffold (light blue, T2T scaffold). Incomplete chromosomes are labeled as “Not T2T” or “Missing” if missing entirely. Sex chromosomes not present in the respective haploid assembly are labeled as “N/A”. f) Cumulative nonredundant structural variants (SVs) across the diverse haplotypes in this study called with respect to the T2T-CHM13 reference genome (three trio children excluded). g) Number of SVs detected for each haplotype relative to the T2T-CHM13 reference genome, colored by population. Insertions and deletions are balanced when called against the T2T-CHM13 reference genome but imbalanced when called against the GRCh38 reference genome (Extended Data Fig. 1d).
Figure 2.
Figure 2.. An improved genomic resource for challenging loci.
a) Number of segmentally duplicated bases assembled in different regions of the genome for each sample in this study, excluding sex chromosomes. The dashed line indicates the number of segmentally duplicated bases in the T2T-CHM13 genome. b) Segmental duplication (SD) accumulation curve. Starting with T2T-CHM13, the SDs (excluding those located in acrocentric regions and chrY) of 63 samples (excluding NA19650 and NA19434) were projected onto T2T-CHM13 genome space in the continental group order of: EUR, AMR, EAS, SAS and AFR. For each bar, the SDs that are singleton, doubleton, polymorphic (>2) and shared (>90%) are indicated. c) Structure of a human Y chromosome on the basis of T2T-CHM13 chromosome Y reference sequence, including the centromere (CEN; top). On the bottom, repeat composition of four contiguously assembled Yq12 heterochromatic regions with their phylogenetic relationships shown on the left. The size of the region and the number of DYZ1 and DYZ2 repeat array blocks are shown on the right. Locations of four inserted and subsequently amplified Alu elements on Yq12 are shown as triangles. d) Comparison of total Iso-Seq reads that failed to align at ≥99% accuracy for T2T-CHM13 vs. the assemblies in this study (left), and comparison of total bases aligned to T2T-CHM13 vs. the assemblies in this study among reads that aligned to both at ≥99% accuracy (right). e) Expressed isoforms of ZNF718 identified in NA19317. This individual is heterozygous for a deletion that impacts the exon-intron structure of ZNF718 (deleting exons 2 and 3 and part of the alternate first exon 1b). Repeat classes are annotated by color at the bottom. The wild-type allele harbors a single, previously unreported isoform consisting of a canonical first exon and second exon that is typically reported as alternate first exon 1b (yellow, wild-type). The presence of the 6,142 bp long deletion on chr4:127,125–133,267 is associated with four isoforms not previously annotated in RefSeq, GENCODE, or CHESS (variant, yellow). All four novel isoforms begin at the canonical transcription start site, contain part of exon 1b, and lack canonical exons 2 and 3.
Figure 3.
Figure 3.. Genotyping from short-read sequencing data.
a) Number of rare SVs, defined as those with an allele frequency of <1%, in each callset. We compared the HPRC genotyped callset (gray), the Illumina-based 1kGP-HC SV callset (orange), the combined HPRC and HGSVC genotyped callset (blue) for both non-African (non-AFR) and African (AFR) samples (n=3,202). The boxes inside the violins represent the first and third quartiles of the data, white dots represent the medians, and black lines mark minima and maxima of the data. b) Estimated QV for a subset of 60 haplotypes (Supplementary Methods) from the 1kGP-HC phased set (GRCh38-based), HGSVC phased genotypes (T2T-CHM13-based), and all HGSVC genome assemblies. To allow comparison between the GRCh38- and T2T-CHM13-based sets, we additionally restricted our QV analysis to “syntenic” regions of T2T-CHM13, i.e., excluding regions unique to T2T-CHM13. The red dotted line corresponds to the baseline QV that we estimated by randomizing sample labels (i.e., using PanGenie-based consensus haplotypes and reads from different samples). The median is marked in yellow and the lower and upper limits of each box represent lower and upper quartiles (Q1 and Q3). Lower and upper whiskers are defined as Q1 − 1.5(Q3–Q1) and Q3 + 1.5(Q3–Q1), and dots mark the outliers. c) Completeness statistics for haplotypes produced from the 1kGP-HC phased set (GRCh38-based) and the HGSVC phased genotypes (T2T-CHM13–based). To allow for comparison between the GRCh38- and T2T-CHM13-based callsets, we additionally restricted our analysis to “syntenic” regions of T2T-CHM13, i.e., excluding regions unique to T2T-CHM13. For both phased sets, completeness was computed on a subset of 30 samples. d) Haplotype availability, Locityper genotyping accuracy, and trio concordance across 347 polymorphic loci. Availability and accuracy are calculated for 61 HGSVC samples, while trio concordance is calculated for 602 trios. Results are grouped by the reference panel [HPRC-only, HPRC + HGSVC leave-one-out (LOO), and HPRC + HGSVC]. e) Locityper genotyping accuracy for 10 target loci with the highest average QV improvement.
Figure 4.
Figure 4.. Structurally variable regions of the MHC locus.
a) Overview of the organization of the MHC locus into class I, class II, and class III regions and the genes contained therein. Structurally variable regions are indicated by dashed lines. Colored stripes show the approximate location of the regions analyzed in panels b-d. b) Gene content and locations of solitary HLA-DRB exon 1 and intron 1 sequences in the HLA-DR region of the MHC locus by DR group, an established system for classifying haplotypes in the HLA-DR region according to their gene/pseudogene structure and their HLA-DRB1 allele. Also shown is the number of analyzed MHC haplotypes per DR group. c) High-resolution repeat maps and locations of gene/pseudogene exons for different DR group haplotypes in the HLA-DR region, highlighting sequence homology between the DR1 and DR4/7/9 and DR2, and between the DR8 and DR3/5/6, haplotype groups, respectively. d) Visualization of common and notable RCCX haplotype structures observed in the HGSVC MHC haplotypes, showing variation in gene and pseudogene content as well as the modular structure of RCCX (S, STK19; black C, nonfunctional CYP21A2; white C, functional CYP21A2; C4L/S, long [(HERV-K insertion)/short(no HERV-K insertion)]. e) Visualization of a PGR-TK analysis of 55 MHC samples and T2T-CHM13 for 111 haplotypes in total. Colors indicate the relative proportion of distinct DR group haplotypes flowing through the visualized elements.
Figure 5.
Figure 5.. Complex SVs in human populations.
a) An SD-mediated CSV inverts NBPF8 and deletes two genes. Inverted SD pairs (orange and yellow bands) each mediate a template switch (dashed lines “1” and “2”). The resulting CSV inverts NBPF8 and deletes NOTCH2NLR and NBPF26. The single recombined copy of each SD is aligned to both reference copies, obscuring the structure of the complex event by eliminating one deletion and changing the size of the inversion and the larger deletion. PAV recognizes these artifacts and refines alignments to obtain a more accurate representation of complex structures. The complex allele shown is HG00171 haplotype1–0000011. b) Fraction of all assemblies having complete and accurate sequence over the SMN region, stratified by study (HGSVC, HPRC-yr1). c) Copy number (full and partial gene alignments) of each multi-copy gene (SMN1/2- red, SERF1A/B - green, NAIP - gold, and GTF2H2/C - blue) across all human haplotypes (n=101). d) Visualization of DupMasker duplicons defined in 11 diverse human haplotypes spanning the SMN region. Panel depicts data from this study, the HPRC (HG02486), and one Pongo pygmaeus haplotype (top) used as an outgroup. e) Summary of SMN1 (yellow) and SMN2 (red) gene copies genotyped across human haplotypes (n=101). Yellow and red bars show a unique copy number of SMN1 and SMN2 while pie charts show proportions of continental groups carrying a given haplotype. Haplotypes that carry only the SMN2 gene copy are highlighted by the asterisks. f) The amylase locus of the human genome is depicted. The H3r.4 haplotype represents the most common haplotype, H5.15 and H7.2 are haplotypes previously unresolved at the base-pair level, and H11.1 is a novel, previously undetected haplotype. Amylase gene annotations are displayed above each haplotype structure. The structure of each amylase haplotype, composed of amylase segments, is indicated by colored arrows. Sequence similarity between haplotypes ranges from 99% to 100%. The alignments highlight differences between the amylase haplotypes.
Figure 6.
Figure 6.. Variation in the sequence, structure, and methylation pattern among 1,246 human centromeres.
a) Length of the ɑ-satellite higher-order repeat (HOR) array(s) for each complete and accurately assembled centromere from each genome. Each data point indicates an active ɑ-satellite HOR array and is colored by population. The median length of all α-satellite HOR arrays is shown as a dashed line. For each chromosome, the median (solid line) and first and third quartiles (dashed lines) are shown. b) Sequence, structure, and methylation map of centromeres from the CHM13, CHM1, and a subset of 65 diverse human genomes. The α-satellite HORs are colored by the number of α-satellite monomers within them, and the site of the putative kinetochore, known as the “centromere dip region” or “CDR”, is shown. c) Differences in the ɑ-satellite HOR array organization and methylation patterns between the CHM13 and HG00513 (H1) chromosome 10 centromeres. The CDRs are located on highly identical sequences in both centromeres, despite their differing locations. d) Mobile element insertions (MEIs) in the chromosome 2 centromeric α-satellite HOR array. Most MEIs are consistent with duplications of the same element rather than distinct insertions, and all of them reside outside of the CDR.

References

    1. Liao W-W, Asri M, Ebler J, Doerr D, Haukness M, Hickey G, Lu S, Lucas JK, Monlong J, Abel HJ, Buonaiuto S, Chang XH, Cheng H, Chu J, Colonna V, Eizenga JM, Feng X, Fischer C, Fulton RS, Garg S, Groza C, Guarracino A, Harvey WT, Heumos S, Howe K, Jain M, Lu T-Y, Markello C, Martin FJ, Mitchell MW, Munson KM, Mwaniki MN, Novak AM, Olsen HE, Pesout T, Porubsky D, Prins P, Sibbesen JA, Sirén J, Tomlinson C, Villani F, Vollger MR, Antonacci-Fulton LL, Baid G, Baker CA, Belyaeva A, Billis K, Carroll A, Chang P-C, Cody S, Cook DE, Cook-Deegan RM, Cornejo OE, Diekhans M, Ebert P, Fairley S, Fedrigo O, Felsenfeld AL, Formenti G, Frankish A, Gao Y, Garrison NA, Giron CG, Green RE, Haggerty L, Hoekzema K, Hourlier T, Ji HP, Kenny EE, Koenig BA, Kolesnikov A, Korbel JO, Kordosky J, Koren S, Lee H, Lewis AP, Magalhães H, Marco-Sola S, Marijon P, McCartney A, McDaniel J, Mountcastle J, Nattestad M, Nurk S, Olson ND, Popejoy AB, Puiu D, Rautiainen M, Regier AA, Rhie A, Sacco S, Sanders AD, Schneider VA, Schultz BI, Shafin K, Smith MW, Sofia HJ, Abou Tayoun AN, et al. A draft human pangenome reference. Nature. 2023;617:312–324. - PMC - PubMed
    1. Porubsky D, Vollger MR, Harvey WT, Rozanski AN, Ebert P, Hickey G, Hasenfeld P, Sanders AD, Stober C, Human Pangenome Reference Consortium, Korbel JO, Paten B, Marschall T, Eichler EE. Gaps and complex structurally variant loci in phased genome assemblies. Genome Res. 2023;33:496–510. - PMC - PubMed
    1. Ebler J, Ebert P, Clarke WE, Rausch T, Audano PA, Houwaart T, Mao Y, Korbel JO, Eichler EE, Zody MC, Dilthey AT, Marschall T. Pangenome-based genome inference allows efficient and accurate genotyping across a wide spectrum of variant classes. Nat Genet. 2022;54:518–525. - PMC - PubMed
    1. Cheng H, Concepcion GT, Feng X, Zhang H, Li H. Haplotype-resolved de novo assembly using phased assembly graphs with hifiasm. Nat Methods. 2021;18:170–175. - PMC - PubMed
    1. Jarvis ED, Formenti G, Rhie A, Guarracino A, Yang C, Wood J, Tracey A, Thibaud-Nissen F, Vollger MR, Porubsky D, Cheng H, Asri M, Logsdon GA, Carnevali P, Chaisson MJP, Chin C-S, Cody S, Collins J, Ebert P, Escalona M, Fedrigo O, Fulton RS, Fulton LL, Garg S, Gerton JL, Ghurye J, Granat A, Green RE, Harvey W, Hasenfeld P, Hastie A, Haukness M, Jaeger EB, Jain M, Kirsche M, Kolmogorov M, Korbel JO, Koren S, Korlach J, Lee J, Li D, Lindsay T, Lucas J, Luo F, Marschall T, Mitchell MW, McDaniel J, Nie F, Olsen HE, Olson ND, Pesout T, Potapova T, Puiu D, Regier A, Ruan J, Salzberg SL, Sanders AD, Schatz MC, Schmitt A, Schneider VA, Selvaraj S, Shafin K, Shumate A, Stitziel NO, Stober C, Torrance J, Wagner J, Wang J, Wenger A, Xiao C, Zimin AV, Zhang G, Wang T, Li H, Garrison E, Haussler D, Hall I, Zook JM, Eichler EE, Phillippy AM, Paten B, Howe K, Miga KH, Human Pangenome Reference Consortium. Semi-automated assembly of high-quality diploid human reference genomes. Nature. 2022;611:519–531. - PMC - PubMed

Publication types