. 2023 Dec:2:100030.
doi: 10.1016/j.vesic.2023.100030. Epub 2023 Oct 10.

Exomap1 mouse: A transgenic model for in vivo studies of exosome biology

Affiliations

Exomap1 mouse: A transgenic model for in vivo studies of exosome biology

Francis K Fordjour et al. Extracell Vesicle. 2023 Dec.

Abstract

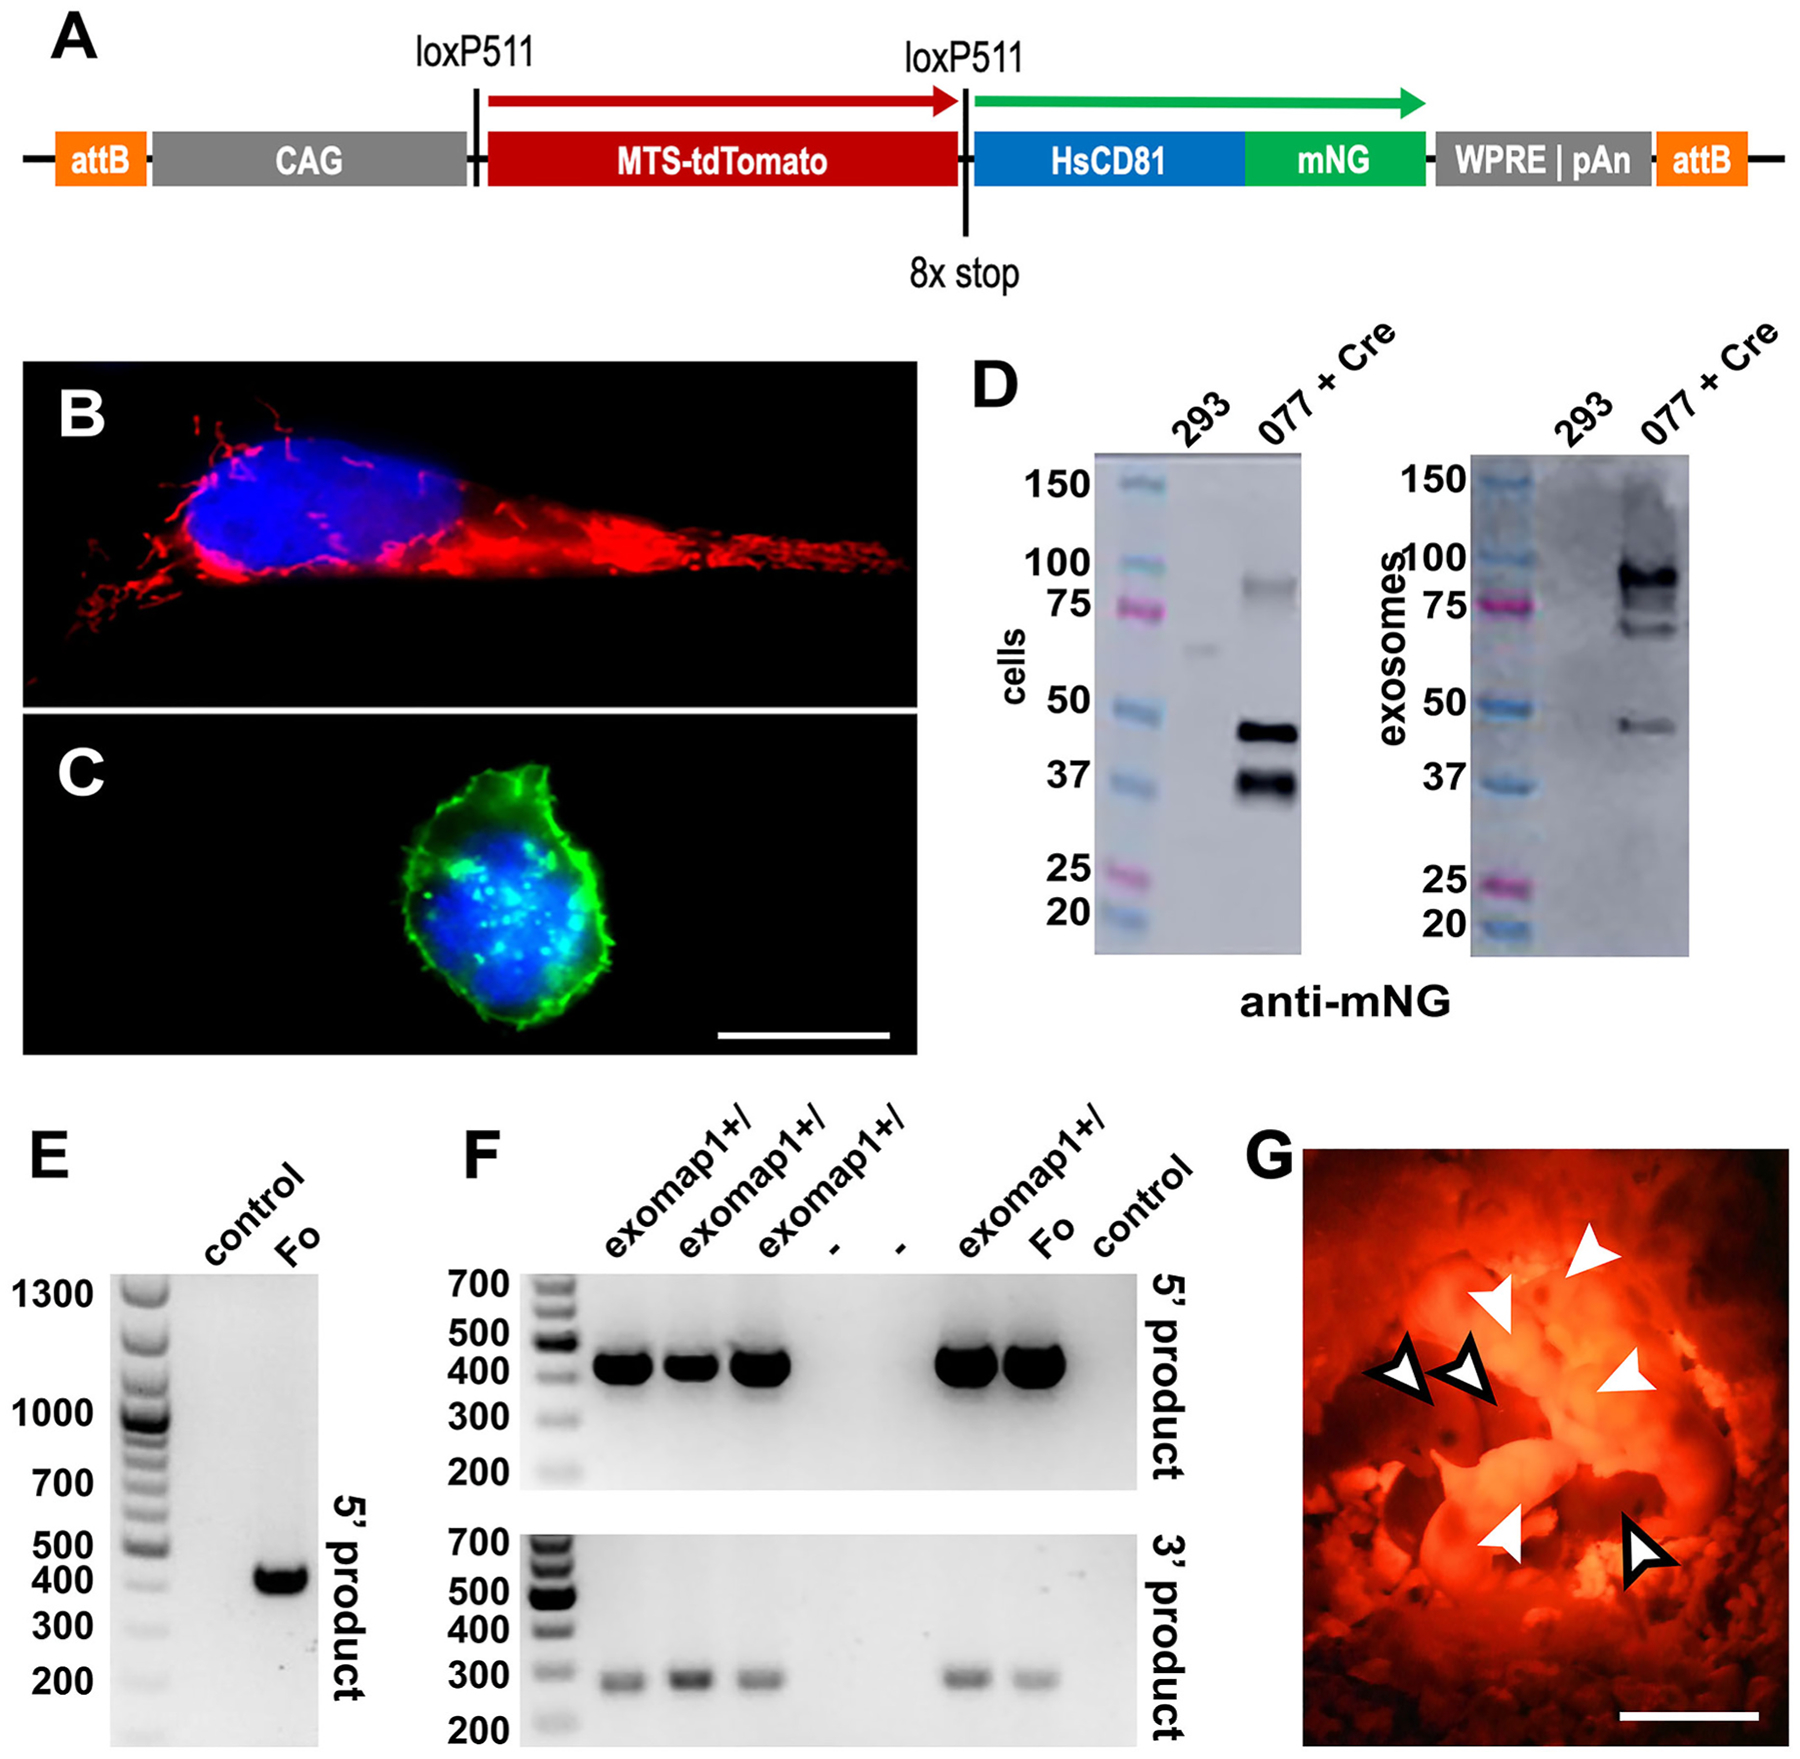
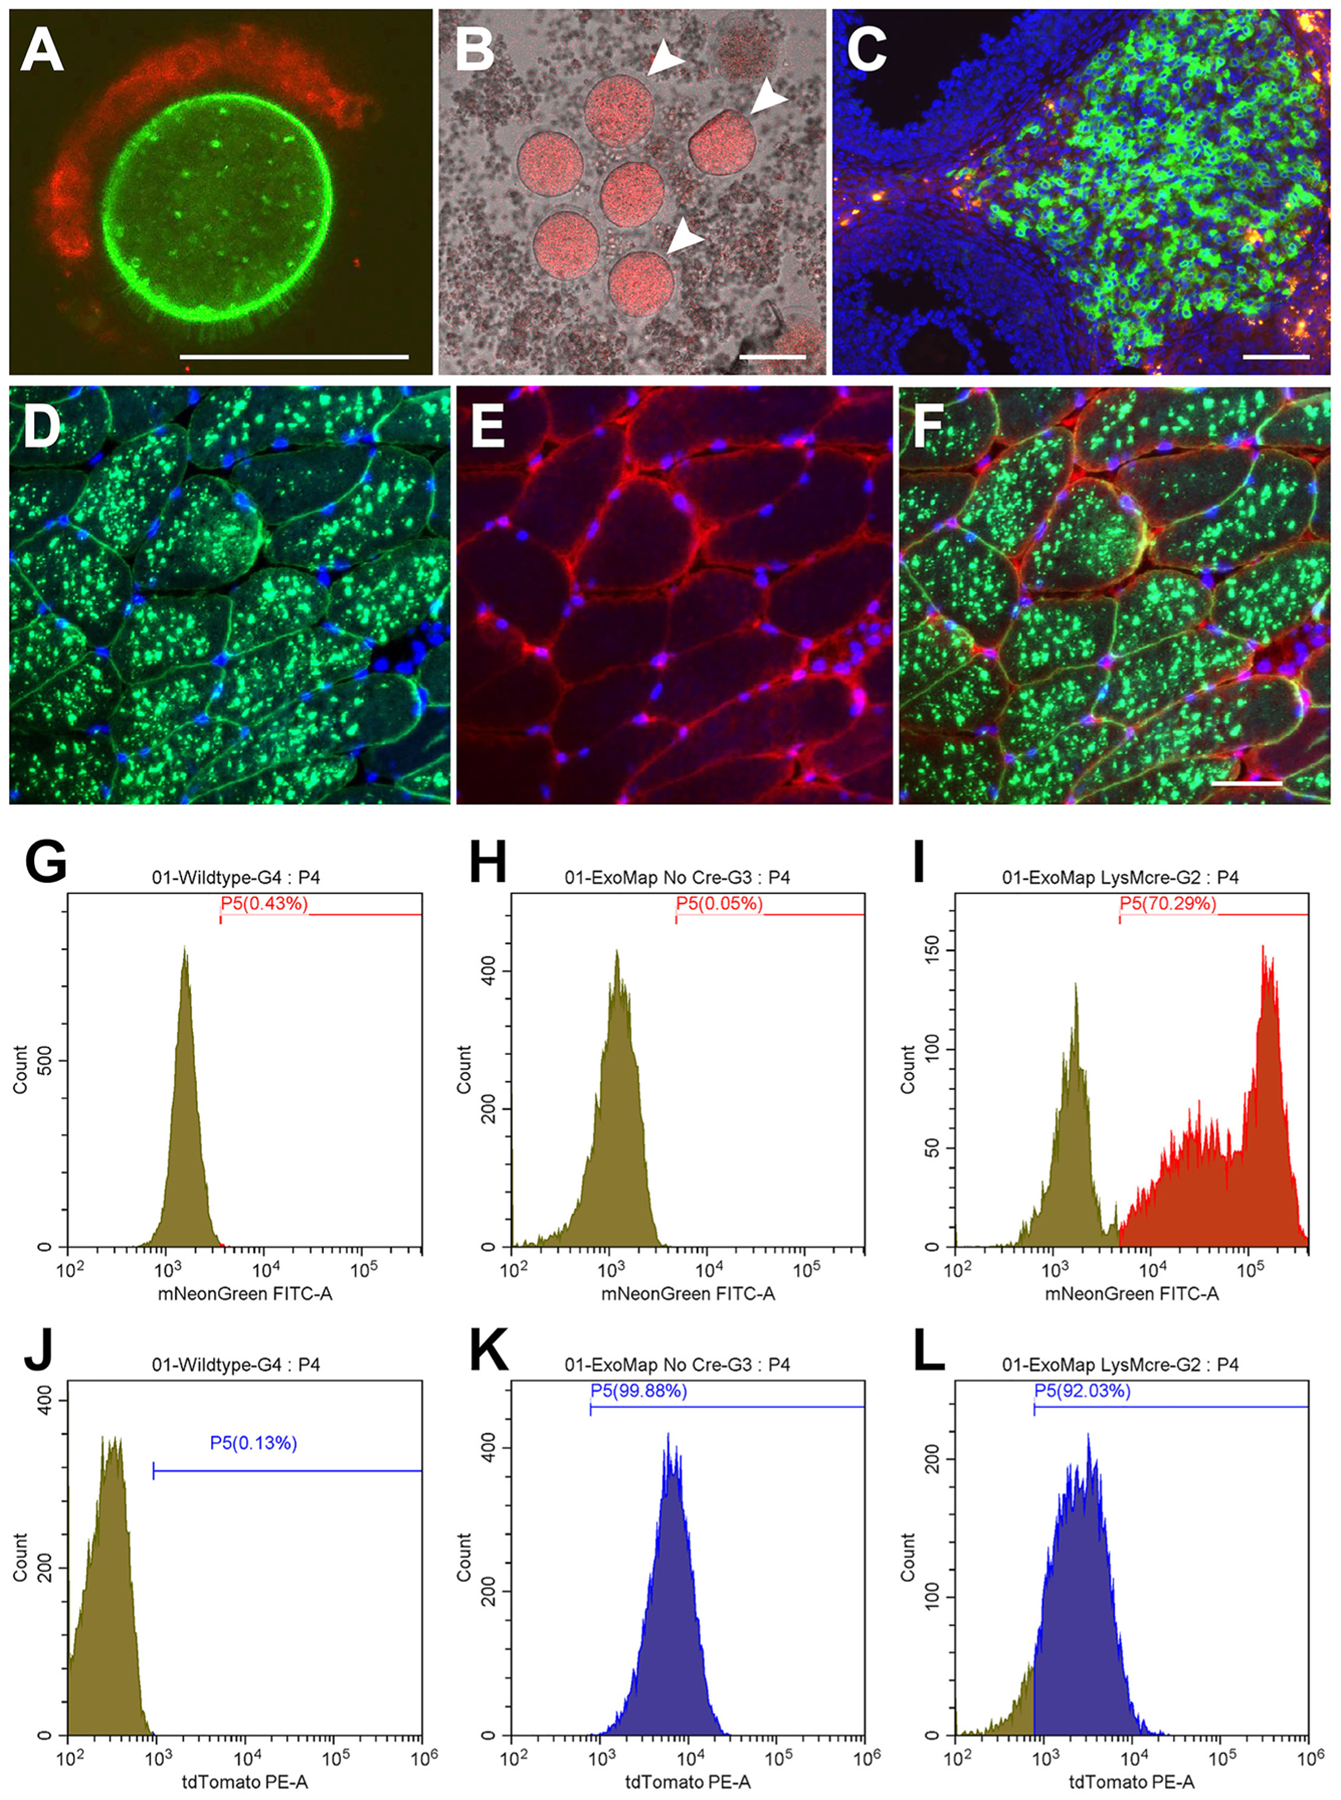
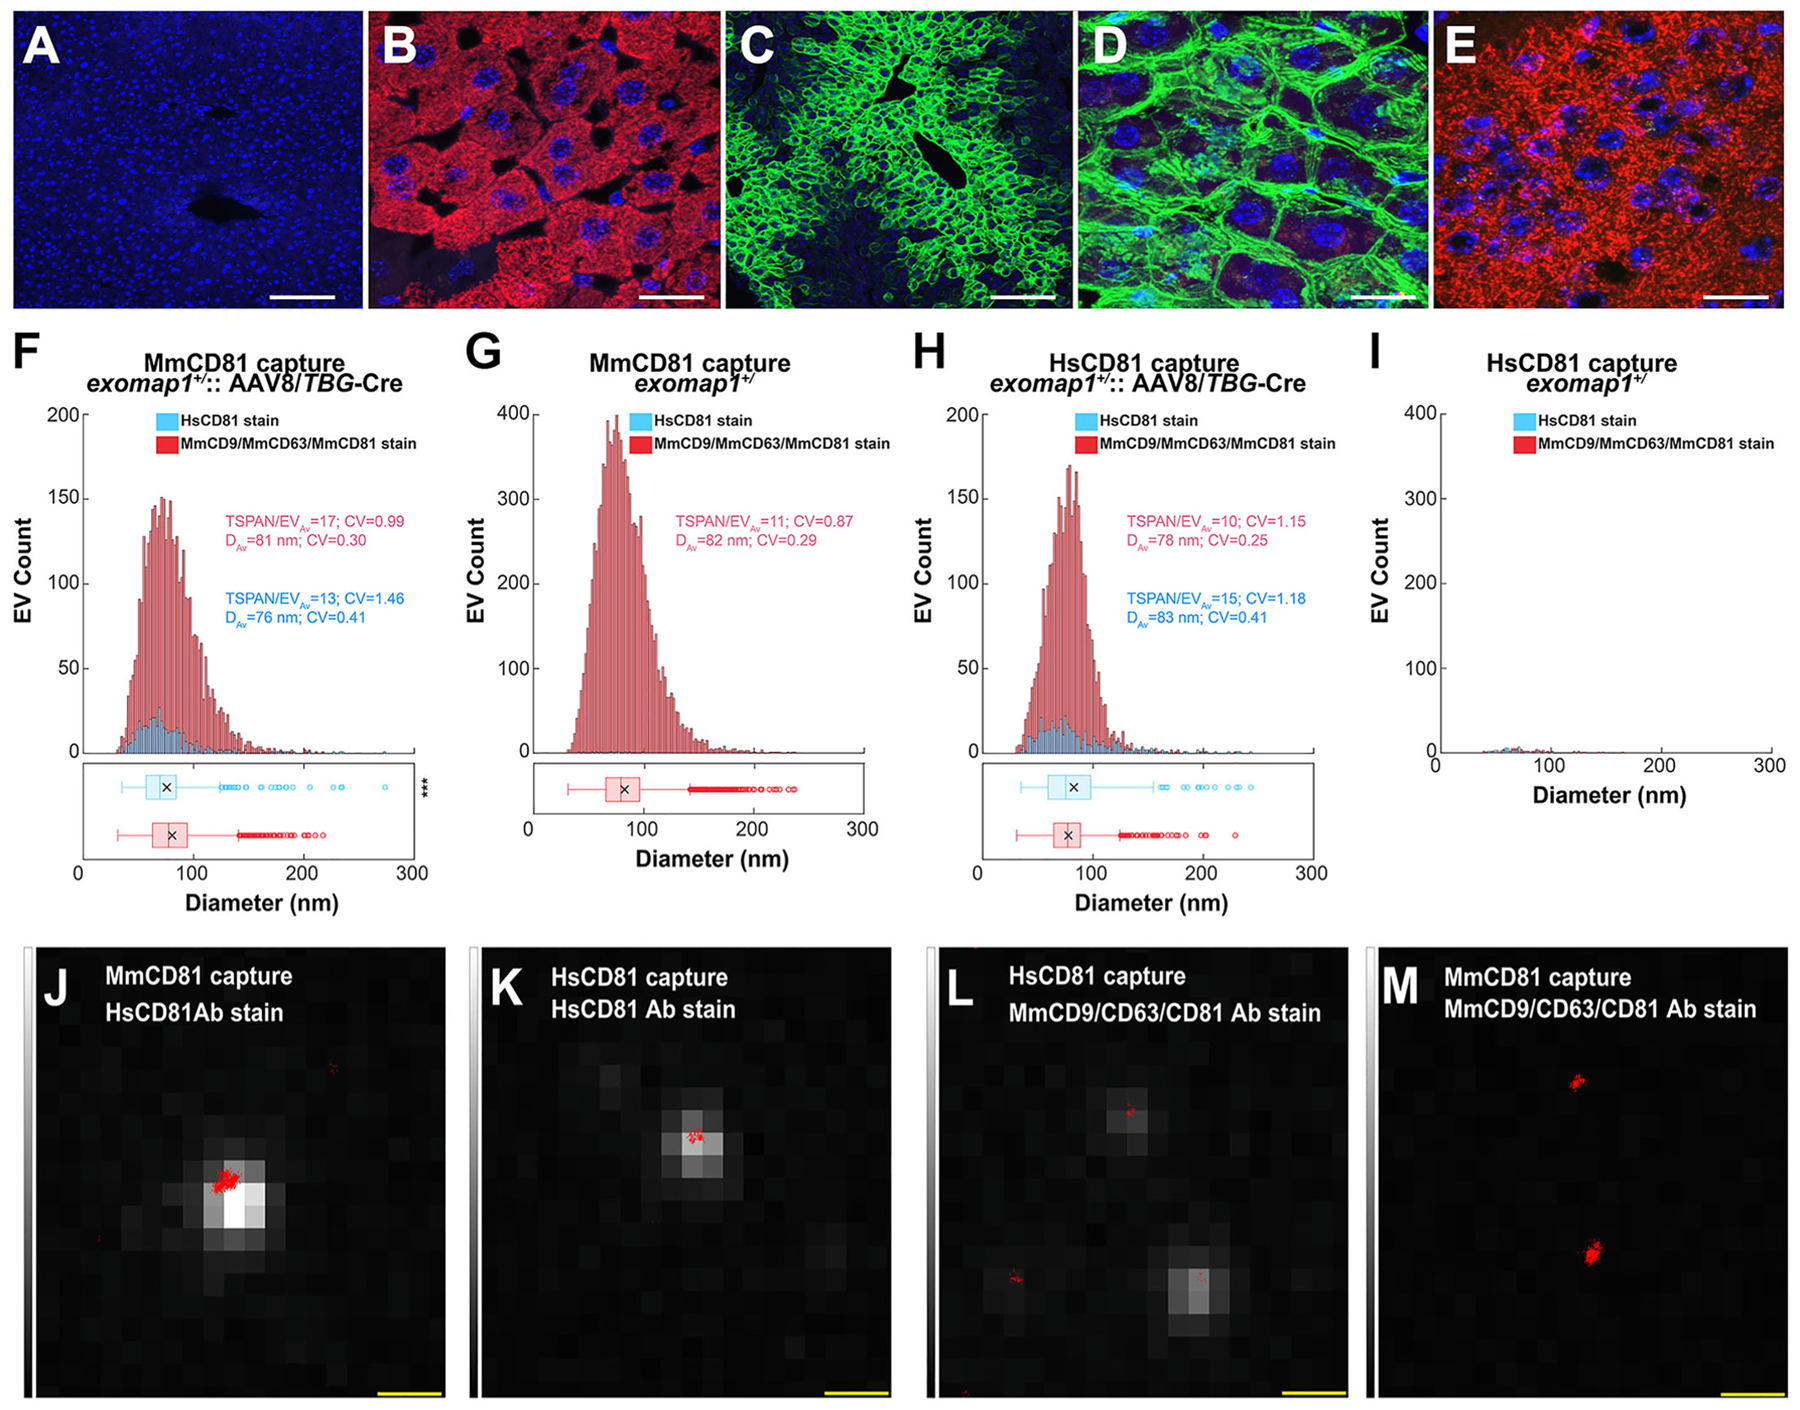
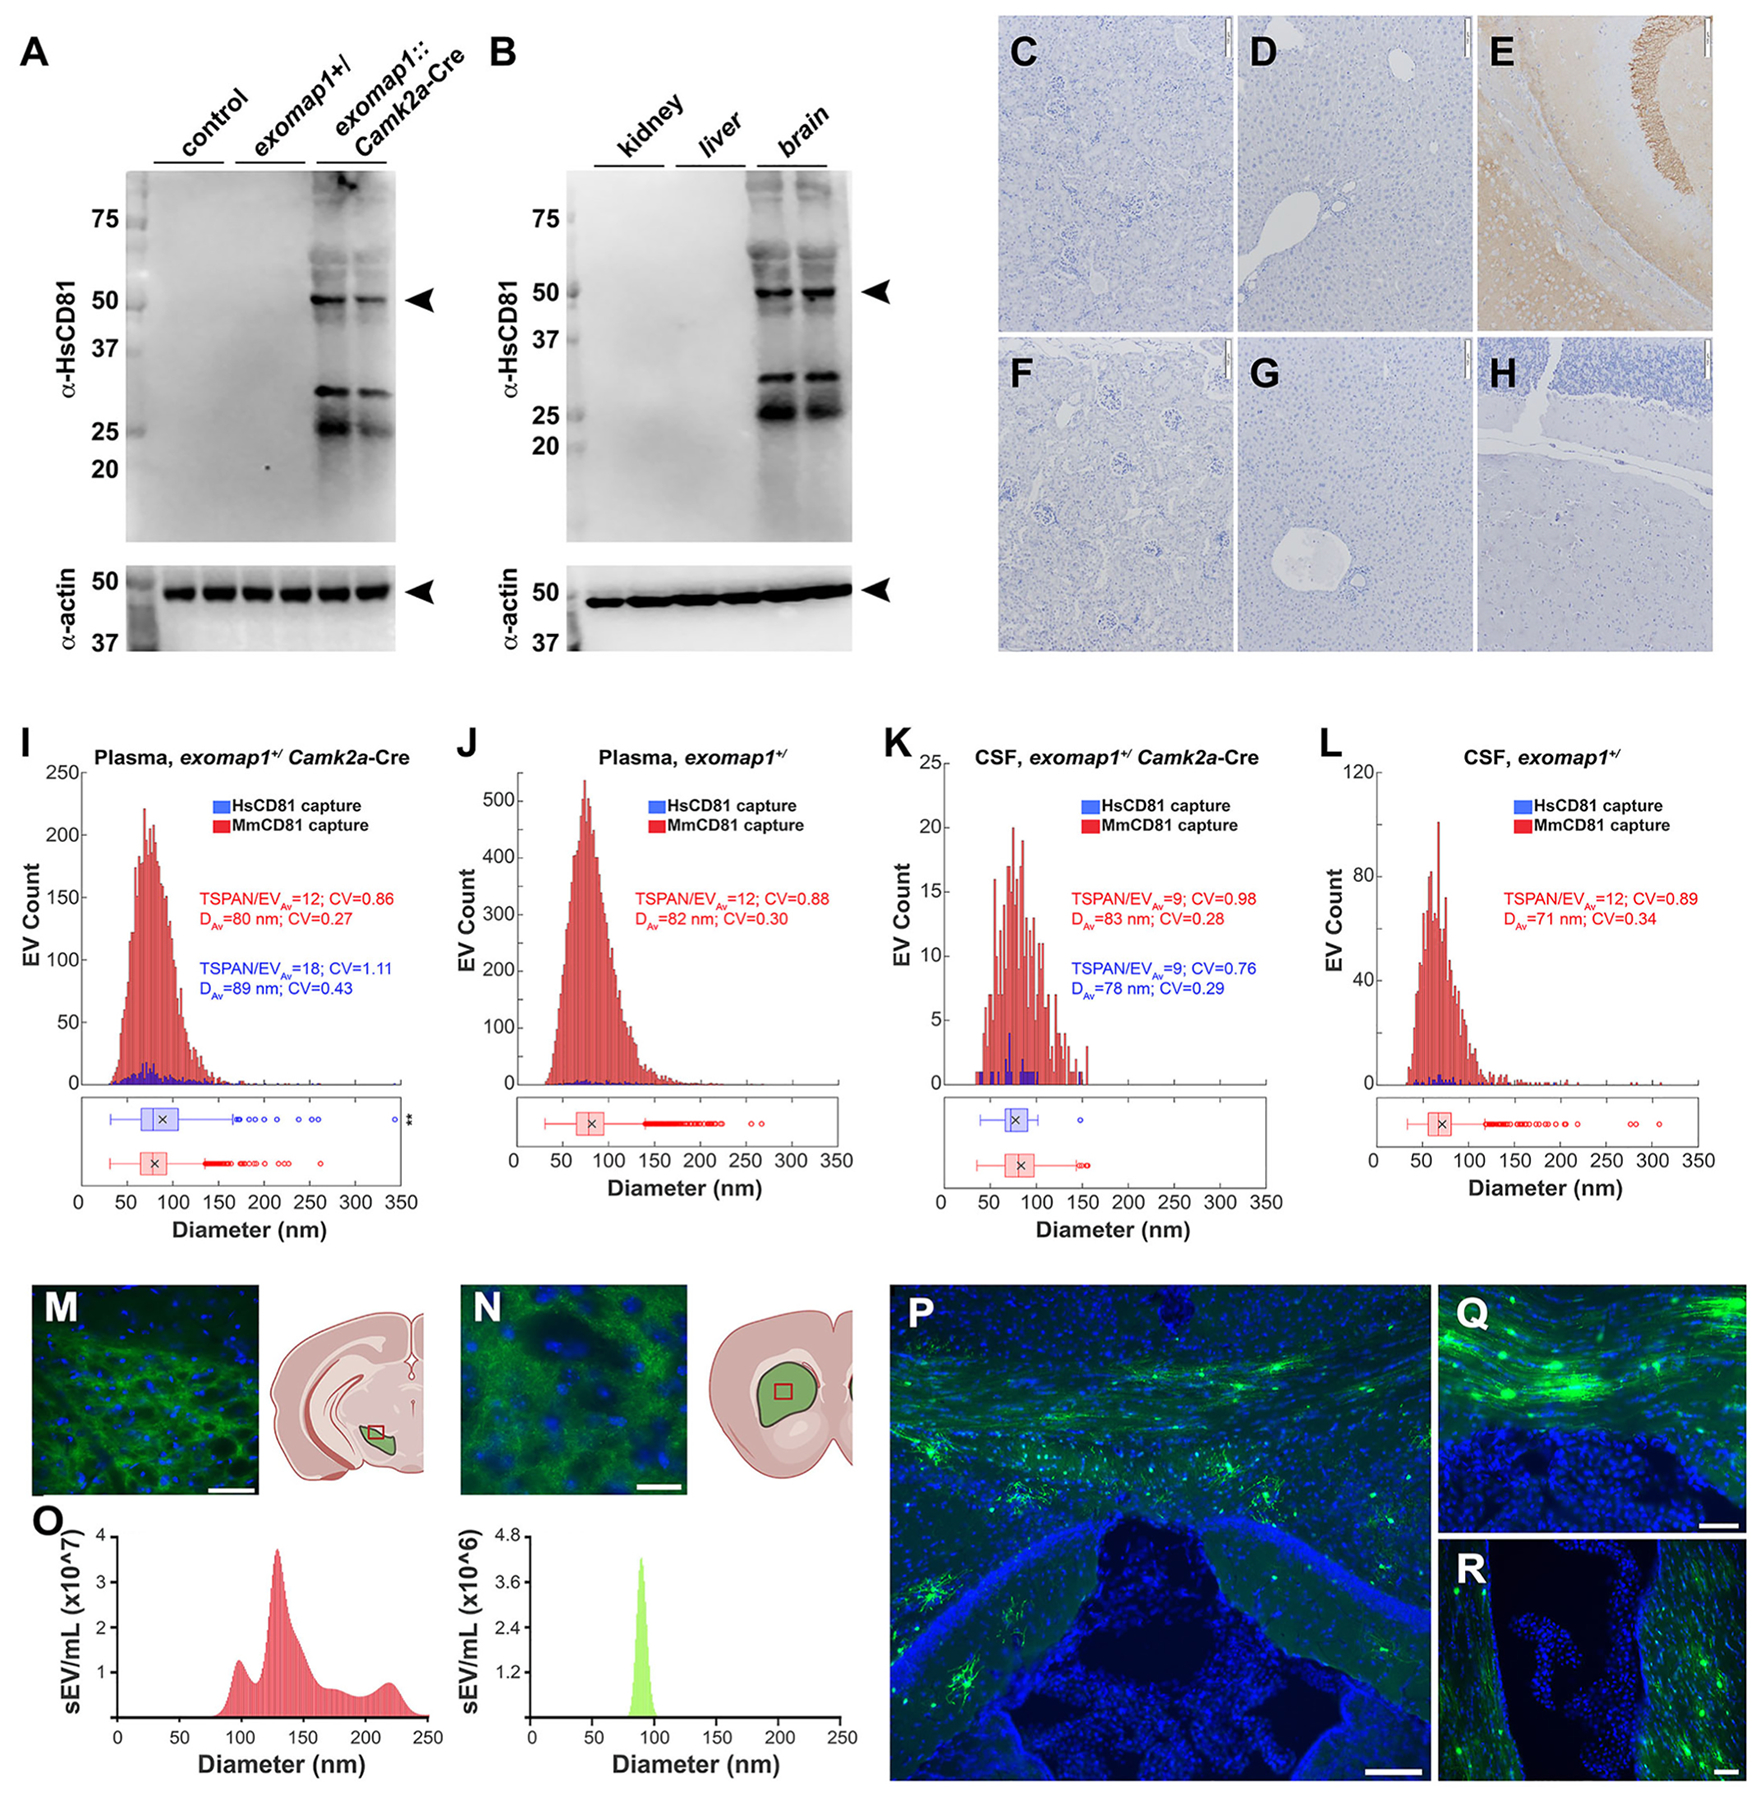
Exosomes are small extracellular vesicles (sEVs) of ~30-150 nm in diameter that are enriched in exosome marker proteins and play important roles in health and disease. To address large unanswered questions regarding exosome biology in vivo, we created the Exomap1 transgenic mouse, which in response to Cre recombinase expresses the most highly enriched exosomal marker protein known, human CD81, fused to mNeonGreen (HsCD81mNG), and prior to Cre expresses a mitochondrial red fluorescent protein. Validation of the exomap1 mouse with eight distinct Cre drivers demonstrated that HsCD81mNG was expressed only in response to Cre, that murine cells correctly localized HsCD81mNG to the plasma membrane, and that this led to the secretion of HsCD81mNG in EVs that had the size (~70-80 nm), topology, and composition of exosomes. Furthermore, cell type-specific activation of the exomap1 transgene allowed us to use quantitative single molecule localization microscopy to calculate the cell type-specific contribution to biofluid exosome populations. Specifically, we show that neurons contribute ~1% to plasma and cerebrospinal fluid exosome populations whereas hepatocytes contribute ~15% to plasma exosome populations, numbers that reflect the known vascular permeabilities of brain and liver. These observations validate the use of Exomap1 mouse models for in vivo studies of exosome biology.

Keywords: CD81; Cre recombinase; EV; Exosome biogenesis; Exosome reporter; Extracellular vesicle.


Figures

Fig. 1.
Fig. 1.. Design, genetics, and red fluorescence of exomap1+/− mice.
(A) Line diagram of the exomap1 transfer vector. (B, C) Fluorescence micrographs of DAPI-stained HEK293 cells transfected with (B) pFF077 or (C) pFF077 + pJM776 that had been fixed and stained with DAPI. Bar, 10 μm. (D) Anti-CD81 immunoblot of cell and exosome fractions of (left lanes) HEK293 cells and (right lanes) HEK293 cells expressing HsCD81mNG. MW size standards are in kDa. (E) Ethidium bromide-stained agarose gel electropherogram of genomic DNA (gDNA) PCR products generated using gDNAs extracted from (control) non-transgenic mouse and the (Fo) exomap1+/ founder mouse using the H11 locus 5′ primer and the CAG promoter 3′ primer, showing the 447 bp product that is diagnostic for the exomap1 transgene. MW size markers are in bp. (F) Ethidium bromide-stained agarose gel electropherograms of PCR reaction carried out with gDNAs extracted from the tails of six F1 progeny from a cross between the (Fo) founder mouse and a non-transgenic control mouse, as well as gDNAs from the founder mouse and a non-transgenic control mouse. Upper panel shows products obtained using the H11 locus 5′primer and the CAG promoter 3′ primer. Lower panel shows products obtained using the bGH-pA 5′ primer and the FRTR2 3′ primer, with an expected exomap1 transgene-specific product of 311 bp. MW size markers are in bp. (G) Fluorescence micrograph of pups from a cross of a control mouse with an exomap1+/, mouse, illuminated with green light and imaged with a red filtered camera. White arrows point to heads of four exomap1+/ carrier mice, readily identifiable by their red fluorescent ears, feet, and tails. Black bordered arrows point to the heads of three non-transgenic littermates. Bar, 1 cm.
Fig. 2.
Fig. 2.. Cre-triggered expression of HsCD81mNG from the exomap1 transgene.
(A) Fluorescence micrograph of an oocyte and a cluster of attached cumulus cells from an exomap1:Zp3-Cre mouse. Bar, 100 μm (B) Fluorescence micrograph of dispersed oocytes and granulosa cells from mechanically-disrupted small follicles of exomap1: Cyp19a1-Cre mice showing MTS-tdTomato expression in oocytes and only weak MTS-tdTomato expression in granulosa cells. White arrowheads point to oocytes. Bar, 100 μm. (C) Fluorescence micrograph of DAPI-stained section through an exomap1:Cyp19a1-Cre mouse ovary, showing strong exomap1 transgene expression in cells of the corpus luteum, most of which expressed HsCD81mNG while some expressed MTS-tdTomato. At this exposure, the low level of MTS-tdTomato expression in DAPI-stained granulosa cells is not visible. Bar, 100 μm. (D-F) Fluorescence micrographs of a DAPI-stained cross section of quadriceps muscle from a tamoxifen-induced exomap1:HSA-MCM mouse, showing images of (D) HsCD81mNG fluorescence and DAPI, (E) MTS-tdTomato fluorescence and DAPI, and (F) HsCD81mNG, MTS-tdTomato, and DAPI. Bar, 100 μm. (G-L) Flow cytometry histograms (cell number vs fluorescence intensity) showing (G–I) green fluorescence and (J–L) red fluorescence of CD45+, CD11b + cells collected from the blood of (G, J) control mice, (H, K) exomap1+/ mice, and (I, L) exomap1:LysM-Cre mice.
Fig. 3.
Fig. 3.. Hepatocytes cells load HsCD81mNG into mouse exosomes.
(A, B) Fluorescence micrographs of liver sections from (A) a non-transgenic control mouse and (B) an exomap1+/− mouse, stained with DAPI and imaged for (blue) DAPI and for (red) MTS-tdTomato fluorescence. Bar, 100 μm in A and 20 μm in B. (C) Fluorescence micrograph of a liver section obtained from an exomap1+/ mouse infected i. v. with AAV8/TBG-Cre virus, stained with DAPI, and imaged for (blue) DAPI and (green) HsCD81mNG. Bar, 100 μm. (D) Fluorescence micrograph of a liver section obtained from an exomap1+/ mouse infected i. v. with AAV8/TBG-Cre virus, stained with DAPI, and imaged for (blue) DAPI, (green) HsCD81mNG fluorescence, and (red) MTS-tdTomato fluorescence. Bar, 20 μm. (E) Fluorescence micrograph of a brain section obtained from an exomap1+/ mouse infected i. v. with AAV8/TBG-Cre virus, stained with DAPI, and imaged for (blue) DAPI and (green) HsCD81mNG fluorescence. Bar, 20 nm. (F–I) Histograms of qSMLM data collected for plasma-derived exosomes immunopurified on coverslips derivatized with antibodies specific for (F, G) MmCD81 or (H, I) HsCD81, from (F, H) an exomap1+/ mouse infected i. v. with AAV8/TBG-Cre virus or (G, I) an exomap1+/ mouse. Exosomes were stained with either (red) AF647-labeled anti-mouse tetraspanins (CD9, CD63, and CD81) or (blue) AF647-labeled anti-HsCD81. TSPAN/EVAv denotes the average number of detected target proteins per vesicle, CV denotes the coefficient of variation, and DAv denotes the mean diameter. The box and whisker plots below the histograms denote the mean (x), median (line), interquartile range (box), and and data points beyond 1.5-times the interquartile range (hollow dots). P values are included elsewhere (Table S1). (J-M) Fluorescence micrographs of individual exosomes interrogated by TIRF and by qSMLM, showing (greyscale) mNG fluorescence and (red dots) positions of vesicle-surface tetraspanins. These exosomes were collected from the plasma of an AAV8/TBG-Cre-infected exomap1+/− mouse by immunoaffinity purification on (J, M) anti-MmCD81 or (K, L) anti-HsCD81 antibodies and stained with (J, K) AF647-labeled anti-HsCD81 antibody or (L, M) AF647-labeled antibodies to mouse exosomal tetraspanins. Bar, 500 nm.
Fig. 4.
Fig. 4.. Neurons contribute ~1% of plasma exosomes.
(A) Immunoblots of brain protein extracts from control mice, exomap1+/− mice, exomap1:Camk2a-Cre mice probed with antibodies specific for (upper panel) HsCD81 and (lower panel) actin. MW size standards are in kDa. (B) Immunoblots of kidney, liver, and brain protein extracts exomap1:Camk2a-Cre mice probed with antibodies specific for (upper panel) HsCD81 and (lower panel) actin. MW size standards are in kDa. (C–H) Light micrographs of anti-HsCD81-stained tissues from exomap1:Camk2a-Cre mice and exomap1+/ mice, including (C, F) kidney, (D, G) liver, and (E, H) brain. Bar, 100 μm. (I, J) Histograms of single exosome immunophenotyping data collected by qSMLM, for raw plasma from (I) exomap1:Camk2a-Cre mouse and (J) exomap1+/ mouse. Exosomes were immunopurified on coverslips functionalized with (red bars) anti-MmCD81 antibody or (blue bars) anti-HsCD81 antibody, then stained with a cocktail of AF647-labeled antibodies to exosomal tetraspanins. TSPAN/EVAv denotes the average number of detected target markers per vesicle, CV denotes the coefficient of variation, and DAv denotes the mean diameter. The box and whisker plot below the histograms denote the mean (x), median (line), interquartile range (box), and point beyond 1.5-times the interquartile range (hollow dots). (K, L) Histograms of qSMLM data for raw CSF samples collected from (K) exomap1:Camk2a-Cre mouse and (L) exomap1+/− mouse, immunopurified on coverslips functionalized with (red bars) anti-MmCD81 antibody or (blue bars) anti-HsCD81 antibody, then stained with a cocktail of AF647-labeled antibodies to exosomal tetraspanins. TSPAN/EVAv denotes the average number of detected target markers per vesicle, CV denotes the coefficient of variation, and DAv denotes the mean diameter. The box and whisker plot below histograms denote the mean (x), median (line), interquartile range (box), and point beyond 1.5-times the interquartile range (hollow dots). P values are included elsewhere (Table S1). (M, N) Fluorescence micrographs of DAPI-stained brain sections of exomap1:Dat-Cre mice showing HsCD81mNG fluorescence in (M) cells of the ventral tegmental area and (N) the axons in the striatum. Bar in A, 50 μm; bar in B, 25 μm. Cartoons to the right of each micrograph depict the brain location of these sections, and were generated in BioRender. (O) NTA histograms of raw CSF samples that had been passed through a 200 nm pore diameter size filter, showing (left histogram) the size distribution profile of all CSF sEVs and (right histogram) the size distribution profile of mNeonGreen-positive sEVs. (P–R) Blue/green fluorescence micrographs of DAPI-stained brain sections of exomap1+/− mice injected with AAV5/Rpe65-Cre virus, showing HsCD81mNG fluorescence in cells of (P) the corpus callosum and hippocampus, (Q) posterior commissure, and (R) lateral ventricle. Bar in A, 100 μm; Bar in B and C, 50 μm.

Update of

References

    1. Pegtel DM, Gould SJ. Exosomes. Annu Rev Biochem. 2019;88:487–514. - PubMed
    1. Yang JM, Gould SJ. The cis-acting signals that target proteins to exosomes and microvesicles. Biochem Soc Trans. 2013;41:277–282. - PubMed
    1. Kalluri R, LeBleu VS. The biology, function, and biomedical applications of exosomes. Science. 2020;367. - PMC - PubMed
    1. Trams EG, Lauter CJ, Salem N Jr, Heine U. Exfoliation of membrane ecto-enzymes in the form of micro-vesicles. Biochim Biophys Acta. 1981;645:63–70. - PubMed
    1. Fordjour FK, Guo C, Ai Y, Daaboul GG, Gould SJ. A shared, stochastic pathway mediates exosome protein budding along plasma and endosome membranes. J Biol Chem. 2022, 102394. - PMC - PubMed