[Preprint]. 2024 Sep 17:rs.3.rs-5033901.
doi: 10.21203/rs.3.rs-5033901/v1.

α-Synuclein Conformations in Plasma Distinguish Parkinson's Disease from Dementia with Lewy Bodies

Affiliations

α-Synuclein Conformations in Plasma Distinguish Parkinson's Disease from Dementia with Lewy Bodies

George T Kannarkat et al. Res Sq. .

Abstract

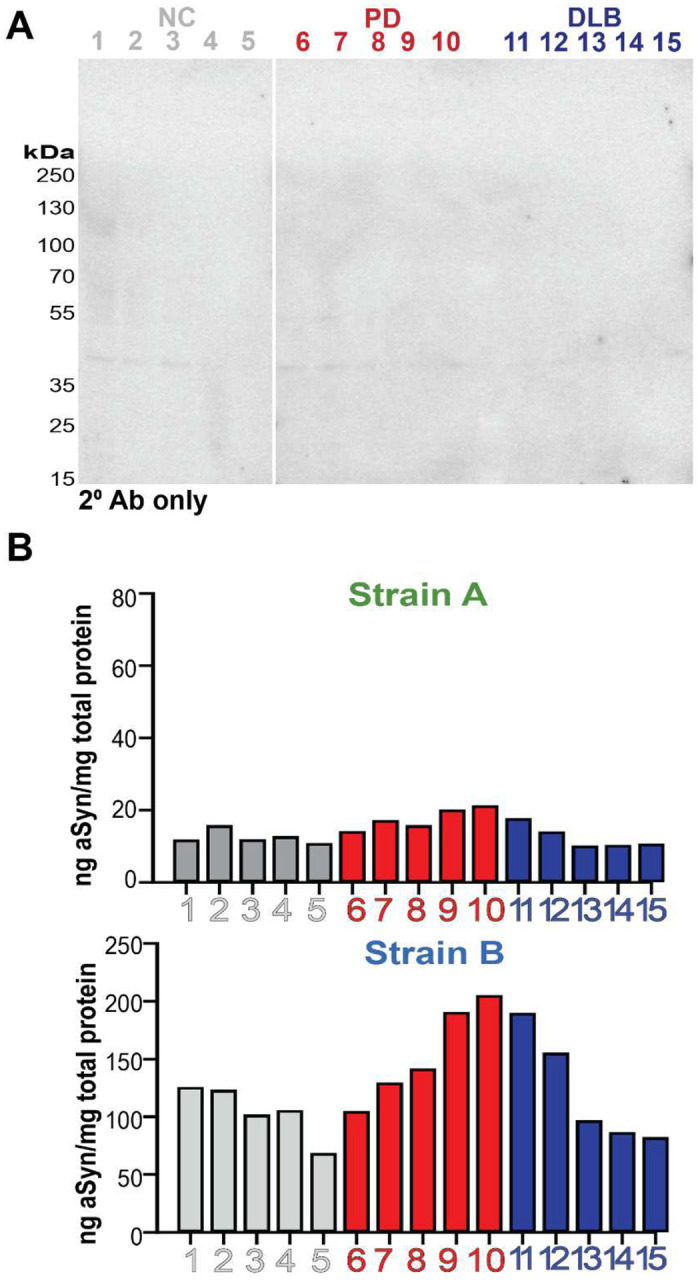
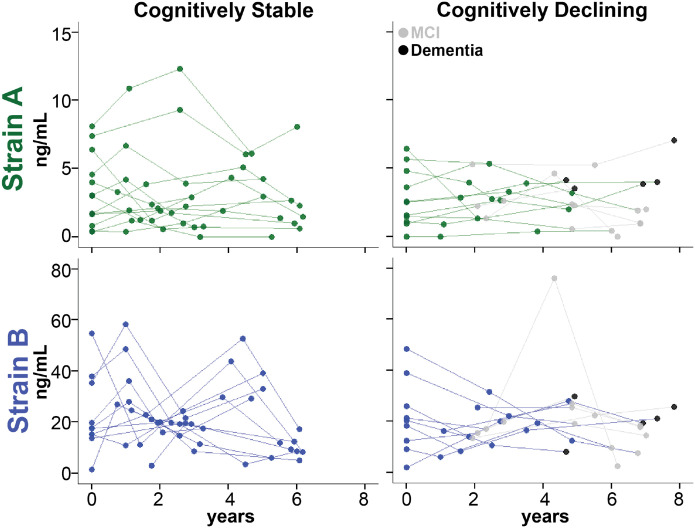
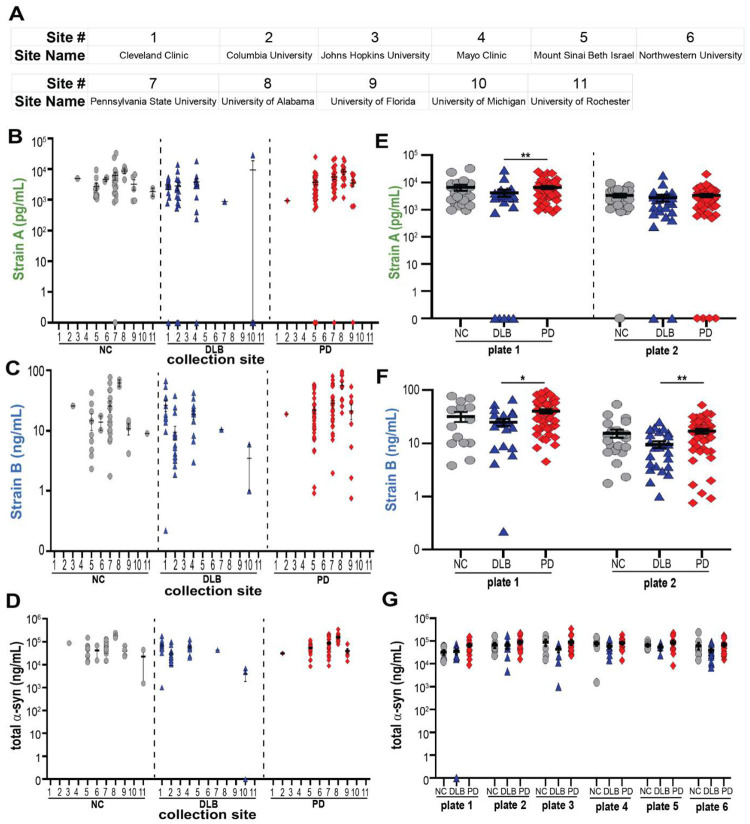
Aggregation of misfolded α-synuclein (aSyn) within the brain is the pathologic hallmark of Lewy body diseases (LBD), including Parkinson's disease (PD) and dementia with Lewy bodies (DLB). Evidence exists for aSyn "strains" - conformations with distinct biological properties. However, biomarkers for PD vs. DLB, including potential aSyn strain differences, are lacking. Here, we used two monoclonal antibodies selective for different in vitro aSyn species - termed Strain A and B - to evaluate human brain tissue, cerebrospinal fluid (CSF), and plasma. Surprisingly, levels of Strain A and B aSyn species differed in plasma from individuals with PD vs. DLB in two independent cohorts. Lower plasma aSyn Strain A species also predicted subsequent PD cognitive decline. Strain A and Strain B aSyn species were undetectable in CSF, but plasma aSyn species could template aSyn fibrillization, particularly in PD. Our findings suggest that aSyn strains may impact LBD clinical presentation and originate outside the brain.


Conflict of interest statement

Competing interests: Dr Tropea has received consulting fees and honoraria from Sanofi Genzyme, Bial, and the Parkinson Foundation. The following authors declare that they have no competing interests: GTK, SA, RSA JFM, ACP, DJI, RTS, RDR, KD, VL.

Figures

Extended Data Figure 1.
Extended Data Figure 1.. Epitope map for monoclonal 9027 antibody generated against strain B.
Immunoblotting against full-length human wildtype (HuWT) aSyn and indicated peptide fragments demonstrate that the 9027 antibody detects a continuous region on aSyn between residues 120–140. ΔNAC = NAC domain deletion mutant.
Extended Data Figure 2.
Extended Data Figure 2.. Strain-selective antibodies detect overlapping but distinct subsets of pathology across PD, DLB, and MSA brains.
Representative images of strain A (A) and strain B (B) immunohistochemical staining are shown for PD (A) and DLB from the set of 10 individuals with LBD in Fig 1. Representative images of strain A, strain B, and p-aSyn immunohistochemical staining are shown from a set of 10 individuals with MSA (C). aSyn strain staining correlates strongly with p-aSyn in MSA brains but not with Ab or p-tau staining in both striatum (black) and cerebellum (red, D). AO = area occupied, DLB = dementia with Lewy bodies, PD = Parkinson’s disease, PDD = PD dementia, SMTC = superior middle temporal cortex.
Extended Data Figure 3.
Extended Data Figure 3.. aSyn strain ELISAs detect pathologic forms of aSyn.
Western blot of caudate brain lysates from healthy controls (NC), individuals with Parkinson’s disease (PD), and individuals with dementia with Lewy bodies (DLB) with secondary antibody only does not show significant off-target binding (A). Levels of aSyn strain levels in cerebellum brain lysates in individuals with PD or DLB were lower than detected in caudate (Fig. 2E–F), a region relatively enriched for aSyn pathology.
Extended Data Figure 4.
Extended Data Figure 4.. Strain and total aSyn plasma levels do not correlate with brain levels.
For individuals with plasma collected within two years of autopsy (n = 10), plasma strain aSyn levels do not correlate with levels in brain caudate lysates extracted in 2% SDS buffer in regions associated with diffuse cortical spread of Lewy pathology (A). Total plasma aSyn levels also do not correlate with brain lysate levels in RIPA or SDS fractions (B). SDS = sodium dodecyl sulfate, SMTC = superior middle temporal cortex.
Extended Data Figure 5.
Extended Data Figure 5.. Plasma aSyn strain levels do not differ between individuals with Parkinson’s disease (PD) and multiple systems atrophy (MSA) and total plasma aSyn levels do not robustly differentiate PD and dementia with Lewy bodies (DLB).
Measurement of aSyn strain levels (n = 101) by ELISA reproduced the decrease previously observed in plasma from dementia with Lewy bodies relative to PD but levels were similar between PD and MSA plasma (A, B). Total plasma aSyn levels were measured by a commercially available ELISA in the UPenn (C) and PDBP cohorts (D). ROC curves were used to differentiate PD vs. NC (E) or PD vs. DLB (F) incorporating age, sex, and plate with or without plasma total aSyn strain levels, as predictors. In all cases, incorporation of total aSyn plasma measures minimally improved discrimination. Thresholds generated by the Youden method. Error bars represent SEM. For differences among groups, p-values (corrected for multiple comparisons for Kruskal-Wallis post-hoc test) for one-way ANOVA are reported in A and B. Significance testing for differences between ROC curves was performed using the DeLong method. AU = arbitrary units, NC (grey circles) = normal controls, DLB (blue triangles) = dementia with Lewy bodies, PD (red diamonds) = Parkinson’s disease.
Extended Data Figure 6.
Extended Data Figure 6.. aSyn strain plasma levels do not significantly change over time and do not mirror changes in cognition at the individual level.
Strain A and Strain B plasma levels were measured in 22 individuals with longitudinal plasma sampling. No differences were observed between individuals who did (n=11) vs. did not (n=11) develop cognitive decline. Groups were compared using a linear mixed-effects model adjusting for disease duration, baseline age, baseline cognition, and sex.
Extended Data Figure 7.
Extended Data Figure 7.. aSyn is detectabIe after immunoprecipitation with strain-selective antibodies.
Strain A, Strain B, or total aSyn (syn211) species were isolated by IP from pooled PD plasma or pooled PD brain caudate lysates. Western blot (WB) with HuA, a non-selective anti-human aSyn antibody, demonstrates robust signal at expected molecular weight of monomeric aSyn (~17 kDa) in Strain B and syn211 plasma IP with weak detection in Strain A plasma IP (A). WB with MJFR14, an anti-human aSyn antibody that prefers oligomeric species, demonstrates a ~175 kDa band (asterisk) that is enriched in the strain A IP (C) and not seen when probing with secondary antibody alone (B, D). These blots are representative of 5 and 3 independent plasma pools for HuA and MJFR14, respectively. aSyn was detected by mass spectrometry in both strain A and B IPs from brain but only in Strain B IP from plasma. Peptide sequences detected in Strain B plasma IP (E) and normalized spectra counts for 2D gel regions isolated and sent for proteomics identification are indicated (F).
Extended Data Figure 8.
Extended Data Figure 8.. aSyn amplification curves from seed aggregation assays (SAA) using aSyn plasma and brain species in Parkinson’s disease from all performed runs.
A total of 4 SAA replicates with aSyn species immunoprecipitated with strain-selective and total aSyn (syn211) antibodies from plasma (n = 2 pools) and caudate brain lysates (n = 3 pools) with PFF, monomer, and buffer only controls were performed. C50 (cycle number at which half of maximum relative fluorescence is reached) was significantly lower with strain A seed compared to total aSyn only in plasma (A). In plasma, quantification of fluorescence by normalization to PFF maximum fluorescence demonstrated significantly increased fibrillization of aSyn with plasma aSyn species enriched by both Strain A and B antibodies (B). In brain, aSyn species enriched by syn211 (total) aSyn antibody significantly increased fibrillization and species enriched by Strain B antibody trended to significantly increased fibrillization (p = 0.052, C). SAA curves for additional replicates are also displayed (D, E). Background fluorescence based on buffer only condition was subtracted from all values. Error bars represent SEM. PFF = pre-formed fibrils. * p < 0.05, ** p < 0.01, *** p < 0.001.
Extended Data Figure 9.
Extended Data Figure 9.. aSyn amplification curves from seed aggregation assays (SAA) using aSyn plasma species in normal controls (NC), dementia with Lewy bodies (DLB), and Parkinson’s disease (PD) from all performed runs.
A total of 3 SAA replicates with aSyn species immunoprecipitated with strain-selective and total aSyn (syn211) antibodies from plasma (n = 3 pools per disease group) with preformed fibril, monomer, and buffer only controls were performed. SAA curves for additional replicates are displayed (A-C). Strain A aSyn species significantly induced aggregation in SAA relative to Ig control when quantified by normalizing fluorescence at cycle 60 to maximum PFF fluorescence (D). Strain A aSyn species from PD plasma induced more significant aggregation relative to species from NC or DLB plasma. C50 (cycle number at which half of maximum relative fluorescence is reached) was unchanged across strain or disease group (E). Background fluorescence based on buffer only condition was subtracted from all values. Error bars represent SEM. * p < 0.05.
Extended Data Figure 10.
Extended Data Figure 10.. PDBP cohort measures show site-to-site and plate-to-plate variability, demonstrating need for normalization.
The Parkinson’s Disease Biomarker Project (PDBP) cohort (n = 200) had plasma collected at 11 sites (A). Among sites, there was considerable site-to-site variability in plasma strain and total aSyn measurements (B-D). While each plate showed the same trends for PD vs. DLB, plate-to-plate variability was noted (E-G). For differences among groups, p-values (corrected for multiple comparisons for Kruskal-Wallis post-hoc test) for one-way ANOVA are reported in E and F. Error bars represent SEM. *p < 0.05, **p < 0.01. NC (grey circles) = normal controls, DLB (blue triangles) = dementia with Lewy bodies, PD (red diamonds) = Parkinson’s disease.
Figure 1.
Figure 1.. Strain A (7015) and Strain B (9027) antibodies selectively and differentially recognize aSyn pathology in human brain tissue.
Mice were immunized with two different in vitro generated strains of aSyn to produce 7015 (Strain A) and 9027 (Strain B) monoclonal antibodies (A). Brain regions (B) known to associate with diffuse spread of Lewy pathology from ten NC and ten individuals with LBD were immunostained with Strain A (C) and Strain B (D) antibodies with representative images showing preferential recognition of thread-like, “neuritic”, (arrowheads) vs. dot-like, “aggregate”, pathology (arrows), respectively. Compared to Strain A-associated pathology (E), Strain B-associated aSyn pathology (F) more strongly correlated with p-aSyn, amyloid, and p-tau staining across all three examined brain regions. P-value and r statistic for Pearson correlation reported in E-F. AO = area occupied, PDD = Parkinson’s disease dementia, NC = normal control, p-aSyn = phosphorylated aSyn, p-tau = phosphorylated tau, SMTC = superior middle temporal cortex.
Figure 2.
Figure 2.. aSyn strains can be detected by ELISA and are uniquely enriched in plasma over cerebrospinal fluid.
Sandwich ELISAs using MJFR1 (total aSyn) antibody for capture and Strain A or Strain B biotinylated antibodies for detection show differential selectivity for recombinant a-syn preformed fibrils (PFF) vs. monomer (A). Western blot (WB) with Strain A (B) and with Strain B (C) antibodies detect high molecular weight (HMW, arrows) aSyn species only in individuals with PD or DLB. GAPDH is displayed as a loading control (D). Strain A aSyn levels measured by ELISA (E) correspond at the individual level with levels of HMW aSyn species detected by immunoblot with Strain A antibody (B), while Strain B aSyn levels measured by ELISA (F) show less individual-level correspondence to quantities detected by immunoblot (C). Strain A and B aSyn species are not readily detectable in CSF (n = 44 individuals tested), but robustly detected in plasma (G). For matched brain and plasma samples (plasma collected within two years of autopsy for n=10 individuals), plasma aSyn Strain levels do not correlate with brain aSyn levels (RIPA extracts shown, H). NC = normal controls, PD = Parkinson’s disease, RIPA = radioimmunoprecipitation assay, SMTC = superior middle temporal cortex.
Figure 3.
Figure 3.. Plasma levels of aSyn strains differentiate individuals with DLB from iwPD.
Both aSyn Strain A and Strain B levels are significantly elevated in PD plasma (red diamonds) compared to DLB (blue triangles), NC (grey circles), and AD (grey squares) in the UPenn cohort, n = 235 (A), while only Strain B levels are significantly elevated in PD relative to DLB in the PDBP cohort, n = 200. (B). Differentiation of PD vs. DLB (C) but not PD vs. NC (D) in both cohorts is significantly improved (as captured in the Area Under the ROC Curve, AUC) when plasma aSyn strain levels are incorporated into predictors, compared to predictors using only age, sex, and plate to predict disease class. Thresholds, sensitivity, specificity, are established using Youden’s method. Error bars represent SEM. For differences among groups, p-values (corrected for multiple comparisons for Kruskal-Wallis post-hoc tests) for one-way ANOVA and for LME model are shown in A and B, respectively. Significance testing for differences between ROC curves was performed using the DeLong method. **p < 0.01, ***p < 0.001. AD = Alzheimer’s disease, AU = arbitrary units for plate and batch normalized measures, AUC = area under the curve, DLB = dementia with Lewy bodies, NC = normal control, PD = Parkinson’s disease, ROC = receiver-operator characteristic, Sens. = sensitivity, Spec. = specificity.
Figure 4.
Figure 4.. Strain A levels predict the rate of cognitive decline in Parkinson’s disease (PD).
Plasma measures of Strain A and Strain B aSyn species were used to predict subsequent cognitive and motor course over 10 years for 95 longitudinally-followed iwPD in LME models. Disease trajectory for iwPD with different levels of Strain A levels at baseline are shown in Panels A (cognitive disease course) and B (motor disease course). Disease trajectory for iwPD with different levels of Strain B levels at baseline are shown in Panels C (cognitive disease course) and D (motor disease course). For all panels, colors indicate the modeled disease course for each tertile of aSyn strain measure, from highest (red), to middle (green), to lowest (blue), with bands representing 95% confidence intervals. Cognitive performance is reflected in the age-adjusted DRS score, where higher values represent better performance, and motor impairment is reflected in the Unified Parkinson’s Disease Rating Scale (UDPRS) Part III score, where higher values represent greater impairment.
Figure 5.
Figure 5.. aSyn species isolated from plasma by strain-selective antibodies can seed aSyn fibrillization by seed amplification assay (SAA).
A. 0.05 ug/mL of protein isolated by immunoprecipitation (IP) using Strain A, Strain B, or total aSyn (syn211) antibodies, or negative control isotype antibody, from plasma or brain lysates (caudate) was tested for ability to seed fibrillization of aSyn monomer substrate in SAA. B. In control conditions, addition of aSyn pre-formed fibrils (PFFs) readily induced aSyn fibrillization, while addition of monomeric aSyn did not. C and D. Representative SAA curves from plasma (C) and brain (D) IPs in material from PD individuals. E and F. Representative SAA curves from plasma IPs in material from PD (E), compared to DLB (F) individuals. G. Quantification of area under the curve (AUC), normalized to PFF-seeded condition, for n=4 replicate SAAs seeded with 2 different plasma and 3 different brain lysate pools from PD individuals. For plasma, Strain A aSyn (green) was significantly more potent in inducing aSyn fibrillization, compared to the isotype control IP condition (yellow). For brain, total aSyn IP (purple) was significantly more potent in inducing aSyn fibrillization, compared to the isotype control IP condition (yellow). One-way ANOVA (factor: IP seed) with post-hoc Tukey test was used to assess whether AUC was significantly different from isotype versus aSyn seed IPs. H. Quantification of AUC, normalized to PFF-seeded condition, for n=3 replicate SAAs seeded with 3 PD, 3 NC, and 3 DLB plasma pools. Plasma aSyn IP’d with Strain A antibody (green) from PD was significantly more potent in inducing aSyn fibrillization, compared to plasma aSyn IP’d with Strain A antibody from DLB or NC. Two-way ANOVA (factors: IP seed and disease group) with post-hoc Tukey test was used to assess for significant differences between SAA conditions. *p<0.05, error bars represent SEM.

References

    1. Hogan D. B., Fiest K. M., Roberts J. I., Maxwell C. J., Dykeman J., Pringsheim T., Steeves T., Smith E. E., Pearson D., Jetté N., The Prevalence and Incidence of Dementia with Lewy Bodies: a Systematic Review. Canadian Journal of Neurological Sciences 43, S83–S95 (2016). - PubMed
    1. Marras C., Beck J. C., Bower J. H., Roberts E., Ritz B., Ross G. W., Abbott R. D., Savica R., Van Den Eeden S. K., Willis A. W., Tanner C. M., Prevalence of Parkinson’s disease across North America. npj Parkinson’s Disease 4, 1–7 (2018). - PMC - PubMed
    1. Dorsey E. R., Sherer T., Okun M. S., Bloem B. R., The Emerging Evidence of the Parkinson Pandemic. J Parkinsons Dis 8, S3–S8. - PMC - PubMed
    1. Outeiro T. F., Koss D. J., Erskine D., Walker L., Kurzawa-Akanbi M., Burn D., Donaghy P., Morris C., Taylor J.-P., Thomas A., Attems J., McKeith I., Dementia with Lewy bodies: an update and outlook. Molecular Neurodegeneration 14, 5 (2019). - PMC - PubMed
    1. Uemura N., Uemura M. T., Luk K. C., Lee V. M.-Y., Trojanowski J. Q., Cell-to-Cell Transmission of Tau and α-Synuclein. Trends Mol Med 26, 936–952 (2020). - PMC - PubMed

Publication types

LinkOut - more resources