. 2025 Feb 10;27(2):398-414.
doi: 10.1093/neuonc/noae206.

EZH2 functional dichotomy in reactive oxygen species-stratified glioblastoma

Affiliations

EZH2 functional dichotomy in reactive oxygen species-stratified glioblastoma

Lynnette Wei Hsien Koh et al. Neuro Oncol. .

Abstract

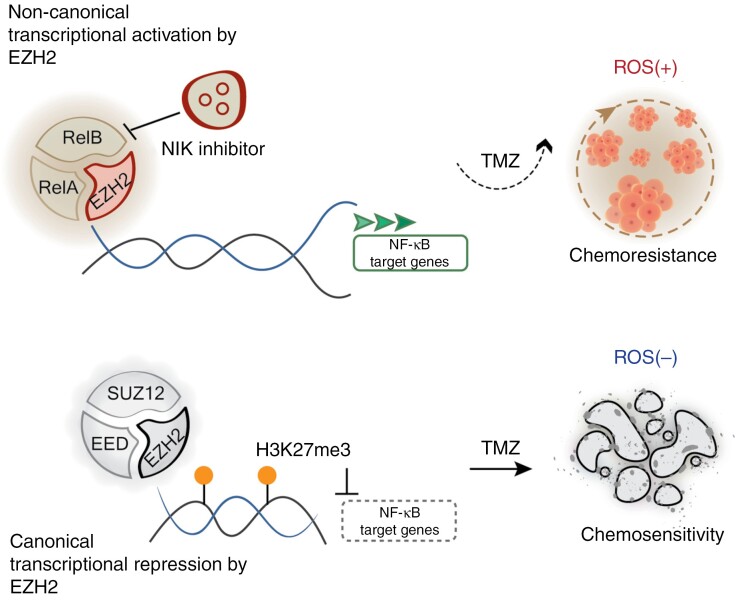
Background: Enhancer of zeste homolog 2 (EZH2), well known for its canonical methyltransferase activity in transcriptional repression in many cancers including glioblastoma (GBM), has an understudied noncanonical function critical for sustained tumor growth. Recent GBM consortial efforts reveal complex molecular heterogeneity for which therapeutic vulnerabilities correlated with subtype stratification remain relatively unexplored. Current enzymatic EZH2 inhibitors (EZH2inh) targeting its canonical su(var)3-9, enhancer-of-zeste and trithorax domain show limited efficacy and lack durable response, suggesting that underlying differences in the noncanonical pathway may yield new knowledge. Here, we unveiled dual roles of the EZH2 CXC domain in therapeutically distinct, reactive oxygen species (ROS)-stratified tumors.

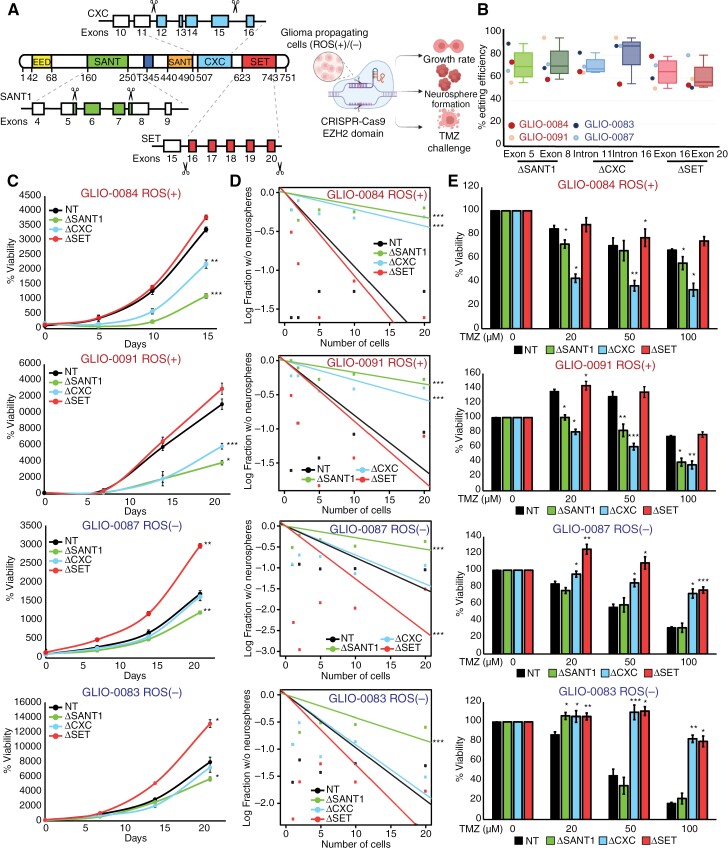
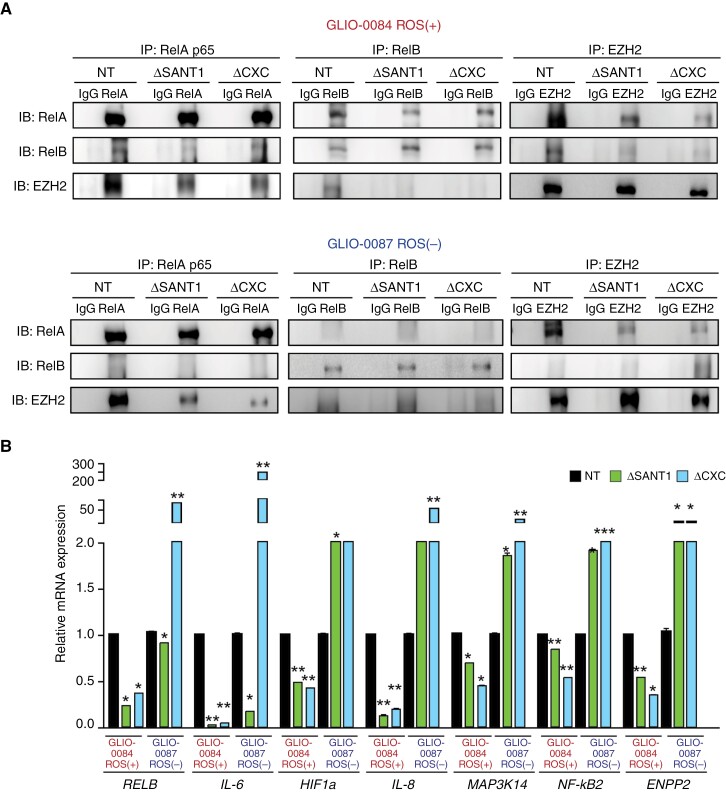
Methods: We analyzed differentially expressed genes between ROS classes by examining cis-regulatory elements as well as clustering of activities and pathways to identify EZH2 as the key mediator in ROS-stratified cohorts. Pull-down assays and CRISPR knockout of EZH2 domains were used to dissect the distinct functions of EZH2 in ROS-stratified GBM cells. The efficacy of NF-κB-inducing kinase inhibitor (NIKinh) and standard-of-care temozolomide was evaluated using orthotopic patient-derived GBM xenografts.

Results: In ROS(+) tumors, CXC-mediated co-interaction with RelB drives constitutive activation of noncanonical NF-κB2 signaling, sustaining the ROS(+) chemoresistant phenotype. In contrast, in ROS(-) subtypes, Polycomb Repressive Complex 2 methyltransferase activity represses canonical NF-κB. Addressing the lack of EZH2inh targeting its nonmethyltransferase roles, we utilized a brain-penetrant NIKinh that disrupts EZH2-RelB binding, consequently prolonging survival in orthotopic ROS(+)-implanted mice.

Conclusions: Our findings highlight the functional dichotomy of the EZH2 CXC domain in governing ROS-stratified therapeutic resistance, thereby advocating for the development of therapeutic approaches targeting its noncanonical activities and underscoring the significance of patient stratification methodologies.

Keywords: EZH2; brain cancer; glioblastoma; patient stratification; precision medicine.


Conflict of interest statement

The authors have no conflicts of interest to declare.

Figures

Graphical Abstract
Graphical Abstract
Figure 1.
Figure 1.
Multiomic analysis implicates the role of epigenetic regulator enhancer of zeste homolog 2 (EZH2) in mediating the chemoresistance profiles in reactive oxygen species (ROS)-stratified glioblastoma (GBM) tumors. (A) Schematic of the derivation of ROS transcriptomic signature obtained from differentially regulated genes defined by the union of GBM CD133-stemness populations and increased superoxide-to-hydrogen peroxide ratio (diethyldithiocarbamate [DDC] vs. diphenyleneiodonium [DPI]-treated glioma-propagating cells). (B) ROS transcriptomic signature stratified isocitrate dehydrogenase (IDH) wild-type GBM patient survival in the Glioma Longitudinal AnalySiS (GLASS) consortium database (P = .0141). (C) A combination of ROS transcriptomic signature and O6-methylguanine-DNA methyltransferase (MGMT) promoter methylation status presented the most favorable statistical model to account for variability in patient survival, using the Bayesian Information Criterion (BIC) method. (D) In GLASS clinical database, ROS subclasses were analyzed for enrichment of proneural (PN), classical (CL), and mesenchymal (MES) glioma-intrinsic (GI) subtypes, as well as the MGMT promoter methylation status. (E) Gene regulator enrichment analysis between ROS-stratified tumors. (F) Normalized enrichment scores (NES) for gene sets enriched in differential genes between ROS-stratified The Cancer Genome Atlas (TCGA) primary patient tumors. NES = enrichment score normalized to mean enrichment of random samples of the same size; adjusted P-value = Benjamini–Hochberg (BH)-adjusted enrichment P-value. (G) Gene Set Enrichment Analysis (GSEA) of EZH2, PRC2, EED, and SUZ12 pathway activation in ROS-stratified TCGA primary patient tumors.
Figure 2.
Figure 2.
Enhancer of zeste homolog 2 (EZH2) differentially regulates NF-κB activity and target gene expression in reactive oxygen species (ROS)-stratified glioma-propagating cells (GPCs). (A) Combination Index (CI)-Fraction-affected (Fa, indicating fraction of cell viability affected) plots of GPCs treated with different doses of EPZ-6438 in the presence of temozolomide (TMZ). (B) Gene Set Enrichment Analysis (GSEA) of “Gilmore Lab_NF-κB target genes” pathway activation in ROS-stratified The Cancer Genome Atlas (TCGA) primary patient tumors. (C) H3K27ac distribution signals and statistical comparison across transcriptional start sites (TSSs; ±1 kb) of NF-κB leading-edge genes (n = 72) from leading-edge analysis. (D) H3K27me3 profiles and statistical comparison across TSS (±1 kb) of NF-κB leading-edge genes (n = 72) from leading-edge analysis. (E) (Left panel) Immunoblot demonstrating positive regulation of NF-κB in GLIO-0091 ROS(+) GPCs following EZH2 depletion. (Right panel) Immunoblot demonstrating negative regulation of NF-κB in GLIO-0087 ROS(−) GPCs following knockdown of EZH2. (F) NF-κB luciferase reporter activity in both GLIO-0091 and GLIO-0087 GPCs following EZH2 lentiviral knockdown. *P < .05; **P < .01; ***P < .001 versus +DOX shGFP nontargeting (NT) control. For statistical analysis, two-sided Student’s t-test was used. Error bars represent SD of the mean. (G) qRT-PCR of NF-κB target genes IL-6 and IL-8 in GLIO-0091, GLIO-0084, GLIO-0087, and GLIO-0083 GPCs after EZH2 depletion. *P < .05; **P < .01; ***P < .001 versus +DOX shGFP nontargeting (NT) control. For statistical analysis, 2-sided Student’s t-test was used. Error bars represent SD of the mean. (H) (Top panel) Domain architecture of EZH2 (Bottom panel) NF-κB luciferase reporter activity in both GLIO-0091 and GLIO-0087 GPCs following ectopic expression of EZH2 WT and SETΔdel. *P < .05; **P < .01; ***P < .001 versus vector only control. +P < .05; ++P < .01; +++P < .001 versus EZH2 WT. For statistical analysis, 2-sided Student’s t-test was used. Error bars represent SD of the mean. Results are mean of triplicate experiments. (I) qRT-PCR of NF-κB target genes in GLIO-0091 and GLIO-0087 GPCs after lentiviral overexpression of EZH2 WT and SETΔdel. Diagonal lines represent fold-change values of SETΔdel over WT. *P < .05; **P < .01; ***P < .001 versus vector only control. +P < .05; ++P < .01; +++P < .001 versus EZH2 WT. For statistical analysis, 2-sided Student’s t-test was used. Error bars represent SD of the mean. Results are mean of triplicate experiments.
Figure 3.
Figure 3.
Enhancer of zeste homolog 2 (EZH2) interacts with RelA and RelB to confer Polycomb Repressive Complex 2 (PRC2)-independent mechanisms in reactive oxygen species (ROS)(+) glioma-propagating cells (GPCs). (A) Co-immunoprecipitation of ROS-stratified GPCs. (B) Illustration of primer pairs spanning each 500 bp region upstream of NF-κB target gene promoters and chromatin immunoprecipitation (ChIP) analysis of RelA, RelB, EZH2, and H3K27me3 binding on various promoter vicinities of IL-6, IL-8, PTX3, and CXCL3 in (Top panel) GLIO-0091 ROS(+) GPCs and in (Bottom panel) GLIO-0087 ROS(−) GPCs. *P < .05; **P < .01; ***P < .001 versus respective IgG controls. For statistical analysis, 2-sided Student’s t-test was used. Error bars represent SD of the mean. (C) (Top panel) Mapping of interacting glutathione S-transferase (GST)-fused EZH2 protein domains. (Bottom panel) In vitro GST pull-down assay indicating a putative interaction between in-vitro–translated RelA, RelB, and various GST-fused protein domains of EZH2. Coomassie blue-stained gel provides molecular weight verification of truncated EZH2 domains.
Figure 4.
Figure 4.
Enhancer of zeste homolog 2 (EZH2) CXC domain regulates Polycomb Repressive Complex 2 (PRC2)-independent mechanisms in reactive oxygen species (ROS)(+) glioma-propagating cells (GPCs) and PRC2-dependent functions in ROS(−) GPCs. (A) Design schematic of both CRISPR-Cas9 EZH2 domain constructs targeting (Top panel) CXC, (Bottom panel) SANT1 and SET domains (image created with BioRender.com). (B) Synthego’s Inference of CRISPR Edits (ICE) analysis of editing efficiencies of EZH2 CRISPR clones across ROS-stratified GPC lines. (C) Proliferation of 2 ROS(+) and 2 ROS(−) GPCs transduced with CRISPR-Cas9 Nontargeting (NT), EZH2-∆SANT1, −∆CXC, and −∆SET domains measured by CellTiter-Glo assay. Quantitative data from 6 technical replicates are shown as mean ± SD (error bars). Statistical analysis was performed using 2-way ANOVA. *P < .05; **P < .01; ***P < .001 versus CRISPR-Cas9 nontargeting (NT) controls. (D) In vitro extreme limiting dilution assay in 2 ROS(+) and 2 ROS(−) GPCs following transduction with CRISPR-Cas9 NT, EZH2-∆SANT1, −∆CXC, and −∆SET domains. Statistical analysis was performed using chi-squared (χ2) test for pairwise differences. *P < .05; **P < .01; ***P < .001 versus CRISPR-Cas9 NT controls. (E) Viability of 2 ROS(+) and 2 ROS(−) GPCs transduced with CRISPR-Cas9 EZH2 domains treated with dose-dependent concentrations of temozolomide (TMZ). *P < .05; **P < .01; ***P < .001 versus respective treated CRISPR-Cas9 nontargeting (NT) controls.
Figure 5.
Figure 5.
Enhancer of zeste homolog 2 (EZH2) CXC domain binding to RelB governs NF-κB target gene expression in reactive oxygen species (ROS)-stratified glioma-propagating cells (GPCs). (A) (Top panel) Co-immunoprecipitation of GLIO-0084 ROS(+) GPCs. (Bottom panel) Co-immunoprecipitation of GLIO-0087 ROS(−) GPCs with a distinct absence in interaction between RelB and EZH2 in CRISPR-Cas9 nontargeting (NT) controls. (B) mRNA expression levels of CRISPR-Cas9 NT, EZH2-∆SANT1, and −∆CXC domains in GLIO-0084 ROS(+) and GLIO-0087 ROS(−) GPCs for the noncanonical pathway genes (RELB, NF-κB2) and target genes (HIF1-α, ENPP2, IL-6, IL-8). *P < .05; **P < .01; ***P < .001 versus respective CRISPR-Cas9 NT controls.
Figure 6.
Figure 6.
NIK inhibitor (NIKinh) synergizes with temozolomide (TMZ) to suppress reactive oxygen species (ROS)(+) tumor growth. (A) (Left panel) IC50 curves of ROS-stratified glioma-propagating cells (GPCs) following NIK inhibition. (Right panel) Mean IC50 values across ROS-stratified GPCs. *P = .0379. (B) Combination index (CI)-Fraction-affected (Fa, indicating fraction of cell viability affected) plots of GPCs treated with increasing doses of NIKinh in the presence of 20, 50, and 100 μM TMZ. (C) mRNA expression levels in ROS(+) and ROS(−) GPCs for the noncanonical pathway genes (RELB, NF-κB2) and target genes (HIF1-α, ENPP2). *P < .05; **P < .01; ***P < .001 versus respective DMSO solvent controls. For statistical analysis, 2-sided Student’s t-test was used. Error bars represent SD of the mean. (D) Co-immunoprecipitation of NIKinh-treated ROS(+) GPCs. (E) Viability of ROS-stratified GPCs transduced with CRISPR-Cas9 nontargeting (NT) and −∆CXC domain upon exposure to 100 µM NIKinh. **P < .01; ***P < .001 vs respective CRISPR-Cas9 NT controls. (F) Kaplan–Meier survival curves of GLIO-0084 ROS(+) xenografts with oral administration of Vehicle, NIKinh, TMZ, and NIKinh + TMZ (log-rank P-value <.0001). (G) H&E staining (scale bar, 1 mm), (H) NF-κB2 p100/p52 immunohistochemical staining (scale bar, 100 µm), and (I) Ki-67 immunohistochemical staining (scale bar, 100 µm) of representative brain sections from GLIO-0084 ROS(+) mice injected as in (F). (J) Kaplan–Meier survival curves of GLIO-0087 ROS(–) xenografts with oral administration of Vehicle, NIKinh, TMZ, and NIKinh + TMZ (log-rank P-value <.0001). (K) H&E staining (scale bar, 1 mm), (L) NF-κB2 p100/p52 immunohistochemical staining (scale bar, 100 µm), and (M) Ki-67 immunohistochemical staining (scale bar, 100 µm) of representative brain sections from GLIO-0087 ROS(−) mice injected as in (J).

References

    1. Louis DN, Perry A, Wesseling P, et al.The 2021 WHO classification of tumors of the central nervous system: a summary. Neuro-Oncol. 2021;23(8):1231–1251. - PMC - PubMed
    1. Cancer Genome Atlas Research Network. Comprehensive genomic characterization defines human glioblastoma genes and core pathways. Nature. 2008;455(7216):1061–1068. - PMC - PubMed
    1. Wang Q, Hu B, Hu X, et al.Tumor evolution of glioma-intrinsic gene expression subtypes associates with immunological changes in the microenvironment. Cancer Cell. 2017;32(1):42–56.e6. - PMC - PubMed
    1. Varn FS, Johnson KC, GLASS Consortium, et al.Glioma progression is shaped by genetic evolution and microenvironment interactions. Cell. 2022;185(12):2184–2199.e16. - PMC - PubMed
    1. Wang LB, Karpova A, Clinical Proteomic Tumor Analysis Consortium, et al.Proteogenomic and metabolomic characterization of human glioblastoma. Cancer Cell. 2021;39(4):509–528.e20. - PMC - PubMed

MeSH terms

Substances

LinkOut - more resources