. 2024 Oct 18;13(10):3389-3399.
doi: 10.1021/acssynbio.4c00471. Epub 2024 Oct 7.

An Automated Cell-Free Workflow for Transcription Factor Engineering

Affiliations

An Automated Cell-Free Workflow for Transcription Factor Engineering

Holly M Ekas et al. ACS Synth Biol. .

Abstract

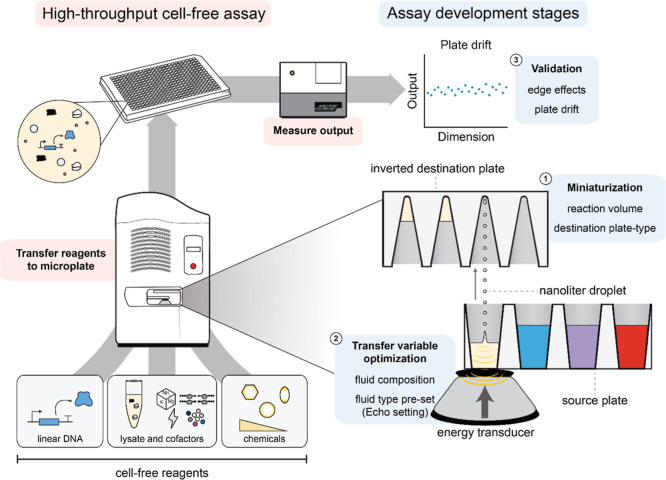
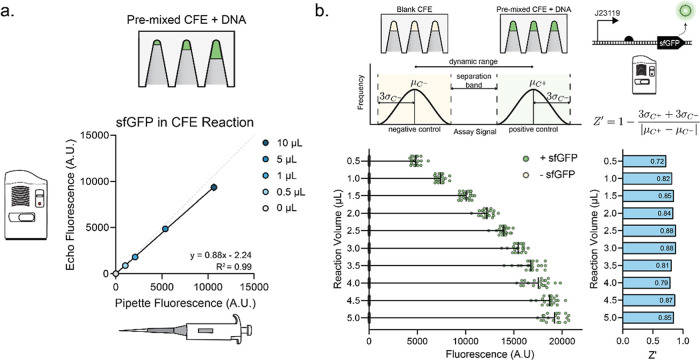
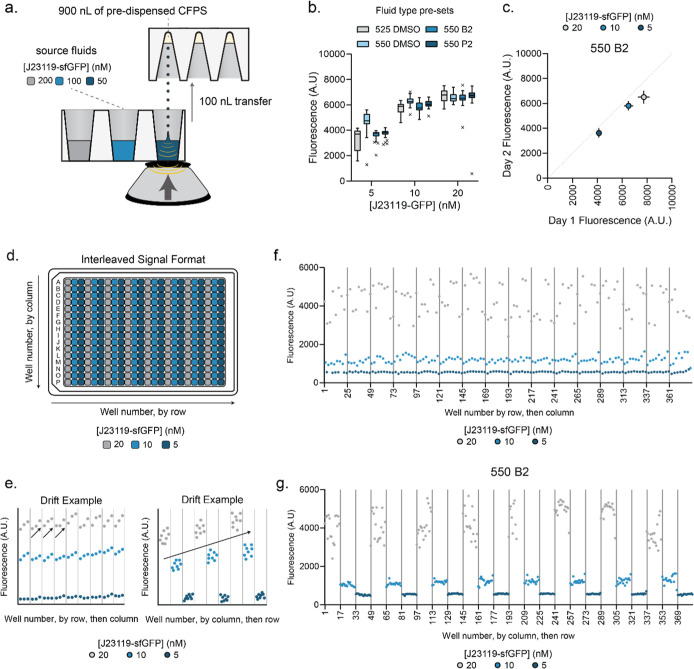
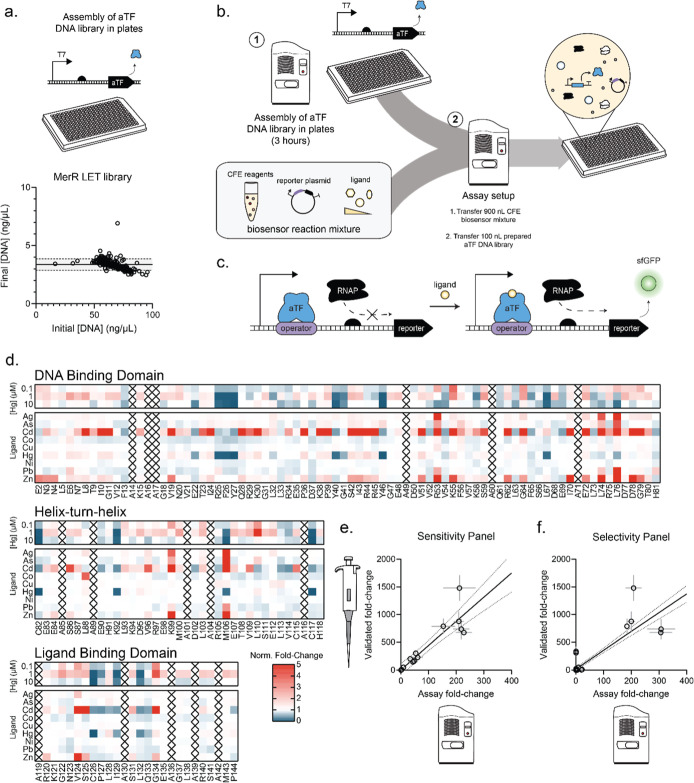
The design and optimization of metabolic pathways, genetic systems, and engineered proteins rely on high-throughput assays to streamline design-build-test-learn cycles. However, assay development is a time-consuming and laborious process. Here, we create a generalizable approach for the tailored optimization of automated cell-free gene expression (CFE)-based workflows, which offers distinct advantages over in vivo assays in reaction flexibility, control, and time to data. Centered around designing highly accurate and precise transfers on the Echo Acoustic Liquid Handler, we introduce pilot assays and validation strategies for each stage of protocol development. We then demonstrate the efficacy of our platform by engineering transcription factor-based biosensors. As a model, we rapidly generate and assay libraries of 127 MerR and 134 CadR transcription factor variants in 3682 unique CFE reactions in less than 48 h to improve limit of detection, selectivity, and dynamic range for mercury and cadmium detection. This was achieved by assessing a panel of ligand conditions for sensitivity (to 0.1, 1, 10 μM Hg and 0, 1, 10, 100 μM Cd for MerR and CadR, respectively) and selectivity (against Ag, As, Cd, Co, Cu, Hg, Ni, Pb, and Zn). We anticipate that our Echo-based, cell-free approach can be used to accelerate multiple design workflows in synthetic biology.

Keywords: cell-free gene expression; high-throughput; protein engineering; robotic liquid handling; synthetic biology; transcription factor.


Conflict of interest statement

The authors declare the following competing financial interest(s): M.C.J. is a co-founder and has financial interest in Stemloop, Inc., Pearl Bio, Gauntlet Bio, and Synolo Therapeutics; J.B.L. is a co-founder and has financial interest in Stemloop. Inc. These interests are reviewed and managed by Northwestern University and Stanford University in accordance with their conflict-of-interest policies. All other authors report no competing interests.

Figures

Figure 1
Figure 1
Robotic liquid handling enables the efficient setup of miniaturized cell-free reactions. Schematic describing an Echo-based assay workflow. The Echo Acoustic Liquid Handler uses acoustic energy to transfer nanoliter-sized droplets from source plates to destination plates. Miniaturized CFE reactions can be constructed by combining nanoliter-volume transfers of cell-free reaction components in plates. Then, CFE reactions can be incubated or read directly on a plate reader. Assay workflows are individualized to the application, requiring the optimization of (i) final reaction format, (ii) transfer variables, and (iii) validation via pilot assays.
Figure 2
Figure 2
Miniaturization of cell-free reactions. (A) Echo transfer volume correlates with pipet volume standard. J23119-sfGFP DNA was combined into a single mixture and either transferred using the Echo or pipetted by hand for 0, 0.5, 1, 5, and 10 μL reaction. Plotted data represents average with standard deviation of three technical replicates (n = 3). Solid black line represents simple linear regression with equation and R2 shown on graph. Gray dotted line represents line of identity. (B) Schematic design and data for Z′ factor assay. Positive and negative assay controls, defined as CFE with and without J23119-sfGFP DNA, are selected to represent ideal assay range. Z′ factor is calculated as shown from the average and standard deviation of the controls, representing dynamic range and separation between signals. (Left graph) positive and negative controls were dispensed using the Echo 525 at volumes spanning 0.5–5 μL in 0.5 μL increments. Plotted data represent each experimental replicate. Ten reactions for each condition were set up on two separate days and plotted together. (Right graph) Z′ factor was calculated using the provided equation for all volumes. The Z′ factor is displayed on each bar, with 0.5 μL displaying the lowest Z′ factor. Z′ > 0.5 is acceptable for high-throughput screens.
Figure 3
Figure 3
Optimization of DNA library transfer variables. (A) Schematic showing Echo transfer variable optimization for a 100 nL transfer of DNA. 100 nL of J23119-DNA at 200, 100, and 50 nM is transferred to 1 μL of CFE to yield ∼20, 10, and 5 nM final concentration of DNA in reaction. Different concentrations are used in subsequent precision assays to represent the concentration dependence of the allosteric transcription factor library. (B) Comparison of fluid type presets for 100 nL transfers on both Echo 525 and Echo 550. Reactions are graphed with the Tukey method. Data represent 32 technical replicates for each concentration/preset pair. (C) Echo 550 B2 preset shows consistent precision and accuracy when dispensing 100 nL of DNA between 2 days. Points represent average, and error bars show standard deviation of 32 technical replicates. Dotted gray line is line of identity. (D) Schematic of interleaved plate assay to identify drift and edge effects. 20, 10, and 5 nM J23119-sfGFP reactions are set up in alternating columns on a plate as a pilot assay. (E) Examples of column and row drift from interleaved plate assay. Trends from left to right or top to bottom can indicate drift. Differences between trends in the middle of the plate and edges can also indicate drift. (F) Cell-free pilot assay results graphing well number by row, then by column. Data points depict individual 1 μL of CFE reactions dispensed via Echo with 100 nL 200, 100, and 50 nM J23119-sfGFP dispensed in alternating columns using the 550 B2 setting. Gray dots represent 20 nM, blue represent 10 nM, and dark blue represent 5 nM. Gray lines denote groupings of rows. No material drift or edge effects were seen. (G) Cell-free pilot assay results graphing well number by column, then by row. Data points are the same as seen in (F) but graphed differently. Gray lines denote groupings of columns. No material drift or edge effects were observed.
Figure 4
Figure 4
High-throughput cell-free platform for screening transcription factor variants. (A) Schematic of aTF activator mechanism and engineering workflow. MerR activators bind a specific operator site and activate transcription via endogenous RNA polymerase upon ligand binding. (B) Our workflow starts with a semiautomated DNA assembly method for preparing normalized concentrations of aTF variants. Then, 900 nL of CFE biosensor mixture (bulk CFE + ligand of interest) is dispensed using the Echo 525, and 100 nL of the normalized aTF library is dispensed on top. (C) MerR DNA library is prepared and normalized in plates. Alanine scanning mutagenesis libraries consisting of 127 aTFs are prepared according to the workflow described in Figure S5. The initial DNA concentration is displayed on the x-axis, and the final DNA concentration is displayed on the y axis. Concentrations were determined via QuantiFluor fluorescence. Solid line represents the final average concentration and dotted lines represent one standard deviation from the mean. The shaded region represents the region between one standard deviation above the mean and one standard deviation below the mean. (D) Alanine scanning mutagenesis throughout MerR protein assayed against a panel of ligand conditions for sensitivity (0.1, 1, and 10 μM Hg) and selectivity (Ag, As, Cd, Co, Cu, Hg, Ni, Pb, and Zn). All selectivity ligands were used at 100 μM except for 20 μM zinc and 10 μM mercury. Protein structure is divided into functional domains. Color bar represents variant fold-change normalized to wild type fold-change for the same ligand condition. Each replicate consists of a plate of all MerR variants assayed against all ligand conditions once. Each replicate contains six wild type MerR reactions per ligand condition as controls. Replicates were set up on different days. Data represents normalized fold-change calculated for each day and averaged together. A black X represents a variant that had alanine as wild type residue. (E) Manual validations show correlation with Echo assay for sensitivity ligand panel. Five variants were randomly selected (E2A, I10A, V19A, F26A, and R105A) and assayed against 0, 0.1, 1, and 10 μM Hg alongside wild type. Assay fold-change is graphed on the x-axis, with error bar representing standard deviation between single replicate fold-change over 2 days. Hand validated fold-change is graphed on the y-axis. Average and standard deviation from technical triplicates were calculated for each condition. Fold-change was then calculated with error bars representing propagated error from dividing average fluorescence in the presence of ligand by average fluorescence for the no ligand condition. Two technical replicates were set up for each reaction. (F) Manual validations show high correlation with Echo assay for selectivity panel of ligands. The same 5 variants and wild type from (B) were assayed against Ag, As, Cd, Co, Cu, Hg, Ni, Pb, Zn, and no ligand by hand and compared to assay fold-change. Assay and hand-validated fold-change and error were calculated the way described in (B).

Similar articles

Cited by

References

    1. Kwok R. Five hard truths for synthetic biology. Nature 2010, 463, 288–290. 10.1038/463288a. - DOI - PubMed
    1. Carlson E. D.; Gan R.; Hodgman C. E.; Jewett M. C. Cell-free protein synthesis: Applications come of age. Biotechnol. Adv. 2012, 30, 1185–1194. 10.1016/j.biotechadv.2011.09.016. - DOI - PMC - PubMed
    1. Silverman A. D.; Karim A. S.; Jewett M. C. Cell-free gene expression: an expanded repertoire of applications. Nat. Rev. Genet. 2020, 21, 151–170. 10.1038/s41576-019-0186-3. - DOI - PubMed
    1. Garenne D.; Haines M. C.; Romantseva E. F.; Freemont P.; Strychalski E. A.; Noireaux V. Cell-free gene expression. Nat. Rev. Methods Primer 2021, 1, 49.10.1038/s43586-021-00046-x. - DOI
    1. Martin R. W.; Des Soye B. J.; Kwon Y.-C.; Kay J.; Davis R. G.; Thomas P. M.; Majewska N. I.; Chen C. X.; Marcum R. D.; Weiss M. G.; Stoddart A. E.; Amiram M.; Ranji Charna A. K.; Patel J. R.; Isaacs F. J.; Kelleher N. L.; Hong S. H.; Jewett M. C. Cell-free protein synthesis from genomically recoded bacteria enables multisite incorporation of noncanonical amino acids. Nat. Commun. 2018, 9, 1203.10.1038/s41467-018-03469-5. - DOI - PMC - PubMed

Publication types

LinkOut - more resources