. 2024 Dec;11(45):e2404067.
doi: 10.1002/advs.202404067. Epub 2024 Oct 7.

CYLD Maintains Retinal Homeostasis by Deubiquitinating ENKD1 and Promoting the Phagocytosis of Photoreceptor Outer Segments

Affiliations

CYLD Maintains Retinal Homeostasis by Deubiquitinating ENKD1 and Promoting the Phagocytosis of Photoreceptor Outer Segments

Song Yang et al. Adv Sci (Weinh). 2024 Dec.

Abstract

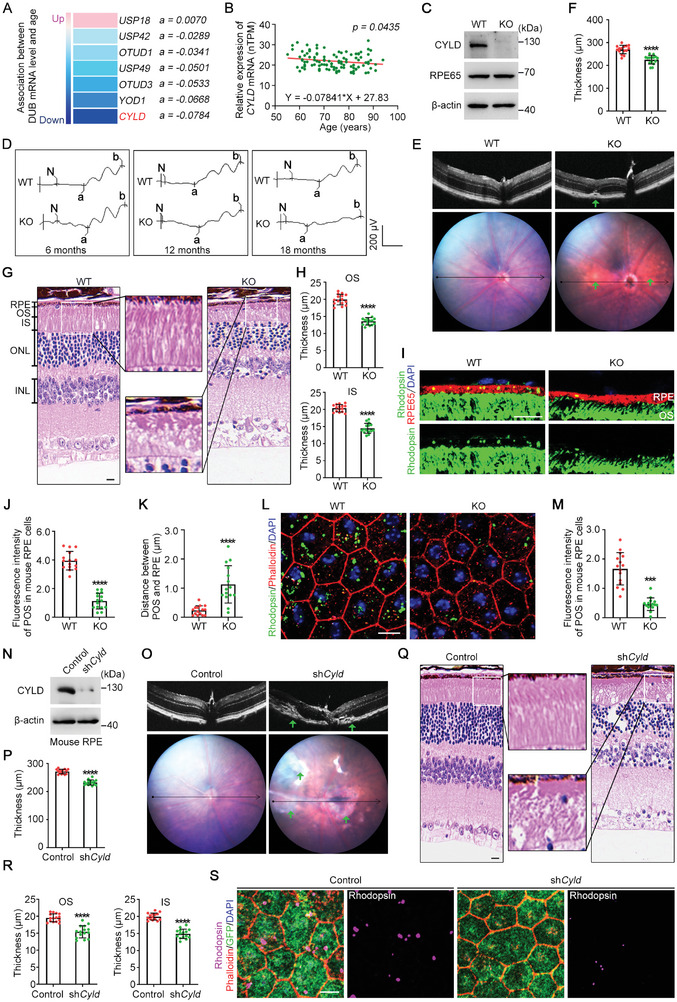
Phagocytosis of shed photoreceptor outer segments by the retinal pigment epithelium (RPE) is essential for retinal homeostasis. Dysregulation of the phagocytotic process is associated with irreversible retinal degenerative diseases. However, the molecular mechanisms underlying the phagocytic activity of RPE cells remain elusive. In an effort to uncover proteins orchestrating retinal function, the cylindromatosis (CYLD) deubiquitinase is identified as a critical regulator of photoreceptor outer segment phagocytosis. CYLD-deficient mice exhibit abnormal retinal structure and function. Mechanistically, CYLD interacts with enkurin domain containing protein 1 (ENKD1) and deubiquitinates ENKD1 at lysine residues K141 and K242. Deubiquitinated ENKD1 interacts with Ezrin, a membrane-cytoskeleton linker, and stimulates the microvillar localization of Ezrin, which is essential for the phagocytic activity of RPE cells. These findings thus reveal a crucial role for the CYLD-ENKD1-Ezrin axis in regulating retinal homeostasis and may have important implications for the prevention and treatment of retinal degenerative diseases.

Keywords: CYLD; ENKD1; deubiquitination; phagocytosis; photoreceptor; retinal pigment epithelium.


Conflict of interest statement

The authors declare no conflict of interest.

Figures

Figure 1
Figure 1
Loss of CYLD causes retinal degeneration and impairs POS phagocytosis. A) Association between deubiquitinatase (DUB) mRNA level and age. DUB transcriptional levels in human retina were obtained from the Human Protein Atlas. The “a” is slope value of the standard curve Y (DUB mRNA level) = aX (age) +b, indicating the degree of change. B) Association between Cyld mRNA level and age. C) Immunoblotting of WT and Cyld KO mouse eyes. D) WT and Cyld KO mice (6‐, 12‐, and 18‐month‐old) were examined by electroretinography. E,F) WT and Cyld KO mice were examined with a Micron IV retinal imaging microscope (E), and the retinal thickness was measured (F, n = 15 fields from 5 mice). The green arrow indicates a possible site of retinopathy. G) Retinal structures of WT and Cyld KO mice examined by H&E staining. Scale bar, 20 µm. H) The thicknesses of OS (top) and IS (bottom) layers (n = 15 fields from 5 mice). I‐K) Immunofluorescence microscopy of frozen sections of WT and Cyld KO mouse retinas to determine the phagocytic function of RPE cells (M). Scale bar, 10 µm. The fluorescence intensity of the engulfed POS in RPE cell (N) and the distance from the RPE layer to POS (O) were quantified (n = 15 fields from 5 mice). L, M) Horizontal views of the RPE layer of WT and Cyld KO mouse retinas to show the phagocytic function of RPE cells (P). The fluorescence intensity of the engulfed POS was quantified (Q, n = 15 fields from 5 mice). Scale bar, 10 µm. N Immunoblotting of the RPE in mice injected with control or shCyld AAVs. O, P) Mice injected with control or shCyld AAVs were examined with a retinal imaging microscope (O), and the retinal thickness was measured (P, n = 15 fields from 5 mice). Q,R) Retinal structures of mice injected with control or shCyld AAVs were examined by H&E staining (Q, Scale bar, 20 µm). The thickness of OS (top) and IS (bottom) layers is shown in R (n = 15 fields from 5 mice). S) Horizontal views of the RPE layer to show the phagocytic function of RPE cells in mice injected with control or shCyld AAVs. Scale bar, 10 µm. ns, not significant, *** p < 0.001, **** p < 0.0001.
Figure 2
Figure 2
CYLD promotes the phagocytic function of RPE cells through its deubiquitinase activity. A, B) Immunofluorescence microscopy of POS phagocytosis by primary RPE cells isolated from WT and Cyld KO mice (A). The fluorescence intensity of engulfed POS in RPE cells was quantified (B, n = 3 fields, from three independent experiments). Scale bar, 10 µm. C) Immunoblotting of POS phagocytosis by primary RPE cells isolated from WT and Cyld KO mice. D, E) Immunofluorescence images of control or CYLD siRNA‐treated ARPE‐19 cells phagocytizing POS (D). The fluorescence intensity of engulfed POS was quantified (E, n = 8 fields, from three independent experiments). Scale bar, 10 µm. F) Immunoblotting‐based analysis of POS phagocytosis by control or CYLD siRNA‐treated ARPE‐19 cells. G, H) Immunofluorescence‐based analysis of POS phagocytosis by control or CYLD siRNA‐treated ARPE‐19 cells. ARPE‐19 cells were transfected with siRNAs for 48 h and incubated with POS‐LB for indicated periods. Cells were subjected to immunofluorescence microscopy (G), and the fluorescence intensity of engulfed POS‐LB was quantified (H, n = 9 fields, from three independent experiments). Scale bar, 10 µm. I‐K) Flow cytometry‐based analysis of POS phagocytosis in control or CYLD siRNA‐treated ARPE‐19 cells. The fluorescence intensity of engulfed POS‐LB in each cell was detected by flow cytometry (I). Weak fluorescence (W) represents cells with weak phagocytic activity. Strong fluorescence (S) represents cells with strong phagocytic activity. POS‐LB‐positive cells (J) and cells with strong fluorescence (K) were quantified. L–O) Immunofluorescence‐based analysis of POS phagocytosis by ARPE‐19 cells treated with control or CYLD siRNAs for 24 h and then overexpressed with GFP, GFP‐CYLD, or GFP‐CYLD C/S. Cells were incubated with POS for 12 h and then subjected to immunofluorescence microscopy (L) and immunoblotting (N). The fluorescence intensity of engulfed POS was quantified (M, n = 9 cells). The intensity of rhodopsin signal was quantified (O). Scale bar, 10 µm. ns, not significant, **p < 0.01, ****p < 0.0001.
Figure 3
Figure 3
CYLD interacts with ENKD1. A,B) Immunoprecipitation (IP) of K63‐linked polyubiquitinated proteins in ARPE‐19 cells treated with control or CYLD siRNAs. Silver staining (A) and mass spectrometry (B) were used for protein analysis. C, D) IP analysis of K63‐linked polyubiquitinated proteins in HEK293T cells overexpressed with GFP or GFP‐CYLD for 24 h. Coomassie blue staining (C) and mass spectrometry (D) were used for protein analysis. E, F) IP analysis to detect the interaction between endogenous CYLD and ENKD1 in mouse RPE tissues. G, H) IP analysis to detect the interaction between endogenous CYLD and ENKD1 in ARPE‐19 cells. I, J) IP analysis to detect the interaction between exogenous CYLD and ENKD1 in HEK293T cells. K) IP analysis to detect the interaction between endogenous CYLD and exogenous ENKD1 in HEK293T cells. L) GST‐pulldown to detect the interaction between purified CYLD and ENKD1. M, N) Fragments and domains of human ENKD1 (M) and CYLD (N) used for this study. O) IP analysis mapping domains of CYLD for ENKD1 binding. P, Q) IP analysis mapping domains of ENKD1 for exogenous (P) and endogenous (Q) CYLD binding.
Figure 4
Figure 4
CYLD deubiquitinates ENKD1 at K141 and K242. A) IP analysis of HA‐ENKD1 polyubiquitination in HEK293T cells transfected with control or CYLD siRNAs. B) IP analysis of HA‐ENKD1 polyubiquitination in HEK293T cells overexpressed with GFP, GFP‐CYLD, or GFP‐CYLD C/S. C) IP analysis of HA‐ENKD1 polyubiquitination in HEK293T cells transfected with control or CYLD siRNAs and then overexpressed with GFP, GFP‐CYLD, or GFP‐CYLD C/S. D) IP analysis of the polyubiquitination level of ENKD1 truncations. E) Potential ubiquitination sites on exogenously expressed GFP‐ENKD1 (91‐250 aa) identified by mass spectrometry. F) Localization of potential ubiquitination sites on ENKD1. The structure of ENKD1 was generated by AlphaFold2. G) IP analysis of the polyubiquitination levels of ENKD1 and ENKD1 mutants in HEK293T cells overexpressed with GFP‐CYLD or GFP‐CYLD C/S. H) IP analysis of the polyubiquitination levels of HA‐ENKD1 and the HA‐ENKD1 K141R/K242R (KK/RR) mutant in HEK293T cells.
Figure 5
Figure 5
CYLD promotes the formation of RPE microvilli. A‐C) Live‐cell images showing the engulfment of POS‐LB by ARPE‐19 cells treated with control or CYLD siRNAs. Cell boundaries are highlighted with red lines. Selected POS‐LB were labeled with colored arrows (A). Engulfed POS‐LB number and movement distance of POS‐LB were quantified (B, n = 9 cells). The movement paths of selected POS‐LB were plotted using ImageJ (C). D) Transmission electron microscopy showing the microvillar structure in 18‐month‐old WT and Cyld KO mouse retinas. Scale bar, 1 µm. E) Transmission electron microscopy showing the microvillar structure on ARPE‐19 cells treated with control or CYLD siRNA. Scale bar, 1 µm. F,G) Immunoblotting (F) and quantification (G) of Ezrin expression in WT and Cyld KO mouse retinas. H,I) Immunoblotting (H) and quantification (I) of Ezrin expression in cultured ARPE‐19 cells treated with control or CYLD siRNA. J, K) Immunofluorescence images of WT and Cyld KO mouse retinas showing the localization of ENKD1 (green) and Ezrin (red) (J). The colocalization of ENKD1 and Ezrin (along the white arrow) was analyzed (K). Yellow arrows indicate the apical surface of RPE. Purple arrows indicate the basal surface of RPE. Scale bar, 10 µm. L,M) Immunofluorescence images of RPE‐19 cells transfected with control or CYLD siRNAs (L). The colocalization of ENKD1 (green) and Ezrin (red) at the cell cortex (along the white arrow) was analyzed (M). Scale bar, 10 µm. ns, not significant, ****p < 0.0001.
Figure 6
Figure 6
CYLD promotes the ENKD1‐Ezrin interaction by deubiquitinating ENKD1. A, B) IP analysis to detect the interaction between endogenous ENKD1 and Ezrin in ARPE‐19 cells. C) IP analysis to detect the interaction between endogenous ENKD1 and Ezrin in mouse RPE tissues. D, E) IP analysis to detect the interaction between exogenous ENKD1 and Ezrin in HEK293T cells. F) IP analysis to map domains of ENKD1 for Ezrin binding. G) IP analysis of ENKD1‐Ezrin binding affinity in HEK293T cells transfected with control or CYLD siRNAs. H) IP analysis of ENKD1‐Ezrin binding affinity in RPE cells from WT and Cyld KO mouse retinas. I) IP analysis of ENKD1‐Ezrin interaction in HEK293T cells transfected with control or CYLD siRNAs and then overexpressed with GFP, GFP‐CYLD, or GFP‐CYLD C/S. J) IP analysis (I) and quantification (J) of Ezrin binding to ENKD1 and ENKD1 KK/RR. K, L) Immunofluorescence images of ARPE‐19 cells transfected with control or CYLD siRNAs and then overexpressed with HA‐ENKD1 or HA‐ENKD1 KK/RR (K). The fluorescence intensity of Ezrin at the cell cortex (along the red arrow) was quantified (L). Scale bar, 10 µm. M, N) Immunofluorescence‐based analysis of POS phagocytosis by ARPE‐19 cells transfected with control or CYLD siRNA and then overexpressed with HA‐ENKD1 or HA‐ENKD1 KK/RR (M). The fluorescence intensity of engulfed POS‐LB was quantified (N, n = 15 cells). Cells were incubated with POS‐LB for 24 h before analysis. Scale bar, 10 µm. ns, not significant; ****p < 0.0001.
Figure 7
Figure 7
Molecular model for the function of CYLD in regulating the phagocytic activity of RPE cells. CYLD interacts with and deubiquitinates ENKD1, strengthening its interaction with Ezrin and promoting Ezrin localization to the microvilli of RPE cells. Loss of CYLD disrupts the above pathway and impairs the microvillar structure and the phagocytic activity of RPE cells, ultimately driving retinal degeneration.

Similar articles

Cited by

References

    1. a) van Lookeren Campagne M., LeCouter J., Yaspan B. L., Ye W., J. Pathol. 2014, 232, 151; - PubMed
    2. b) George S. M., Lu F., Rao M., Leach L. L., Gross J. M., Prog. Retin Eye Res. 2021, 85, 100969. - PMC - PubMed
    1. a) Holmes D., Nature 2018, 561, S2; - PubMed
    2. b) Yang S., Zhou J., Li D., Front. Pharmacol. 2021, 12, 727870; - PMC - PubMed
    3. c) Ran J., Liu M., Feng J., Li H., Ma H., Song T., Cao Y., Zhou P., Wu Y., Yang Y., Yang Y., Yu F., Guo H., Zhang L., Xie S., Li D., Gao J., Zhang X., Zhu X., Zhou J., Dev. Cell 2020, 53, 287; - PubMed
    4. d) Ran J., Guo G., Zhang S., Zhang Y., Zhang L., Li D., Wu S., Cong Y., Wang X., Xie S., Zhao H., Liu H., Ou G., Zhu X., Zhou J., Liu M., Adv. Sci. 2024, 11, e2400569. - PMC - PubMed
    1. Lewandowski D., Sander C. L., Tworak A., Gao F., Xu Q., Skowronska‐Krawczyk D., Prog. Retin Eye Res. 2022, 89, 101037. - PMC - PubMed
    1. Kaarniranta K., Blasiak J., Liton P., Boulton M., Klionsky D. J., Sinha D., Autophagy 2023, 19, 388. - PMC - PubMed
    1. a) Strauss O., Physiol. Rev. 2005, 85, 845; - PubMed
    2. b) Bertolotti E., Neri A., Camparini M., Macaluso C., Marigo V., Prog Retin Eye Res. 2014, 42, 130; - PubMed
    3. c) Flores‐Bellver M., Mighty J., Aparicio‐Domingo S., Li K. V., Shi C., Zhou J., Cobb H., McGrath P., Michelis G., Lenhart P., Bilousova G., Heissel S., Rudy M. J., Coughlan C., Goodspeed A. E., Becerra S. P., Redenti S., Canto‐Soler M. V., J. Extracell Vesicles 2021, 10, e12165. - PMC - PubMed

MeSH terms

Substances

LinkOut - more resources