. 2024 Nov;11(44):e2408093.
doi: 10.1002/advs.202408093. Epub 2024 Oct 7.

A Novel Superparamagnetic-Responsive Hydrogel Facilitates Disc Regeneration by Orchestrating Cell Recruitment, Proliferation, and Differentiation within Hostile Inflammatory Niche

Affiliations

A Novel Superparamagnetic-Responsive Hydrogel Facilitates Disc Regeneration by Orchestrating Cell Recruitment, Proliferation, and Differentiation within Hostile Inflammatory Niche

Borui Xue et al. Adv Sci (Weinh). 2024 Nov.

Abstract

In situ disc regeneration is a meticulously orchestrated process, which involves cell recruitment, proliferation and differentiation within a local inflammatory niche. Thus far, it remains a challenge to establish a multi-staged regulatory framework for coordinating these cellular events, therefore leading to unsatisfactory outcome. This study constructs a super paramagnetically-responsive cellular gel, incorporating superparamagnetic iron oxide nanoparticles (SPIONs) and aptamer-modified palladium-hydrogen nanozymes (PdH-Apt) into a double-network polyacrylamide/hyaluronic acid (PAAm/HA) hydrogel. The Aptamer DB67 within magnetic hydrogel (Mag-gel) showed a high affinity for disialoganglioside (GD2), a specific membrane ligand of nucleus pulposus stem cells (NPSCs), to precisely recruit them to the injury site. The Mag-gel exhibits remarkable sensitivity to a magnetic field (MF), which exerts tunable micro/nano-scale forces on recruited NPSCs and triggers cytoskeletal remodeling, consequently boosting cell expansion in the early stage. By altering the parameters of MF, the mechanical cues within the hydrogel facilitates differentiation of NPSCs into nucleus pulposus cells to restore disc structure in the later stage. Furthermore, the PdH nanozymes within the Mag-gel mitigate the harsh inflammatory microenvironment, favoring cell survival and disc regeneration. This study presents a remote and multi-staged strategy for chronologically regulating endogenous stem cell fate, supporting disc regeneration without invasive procedures.

Keywords: intervertebral disc regeneration; mechanical stimulation; nucleus pulposus stem cells; superparamagnetic hydrogel.


Conflict of interest statement

The authors declare no conflict of interest.

Figures
Scheme 1
Scheme 1
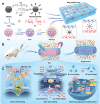
Schematic illustration of fabrication of superparamagnetic hydrogel and its role in enhancing in situ IVD regeneration. A) Fabrication of superparamagnetic hydrogel. B) Hydrogel is transplanted into degenerated IVD, and then stimulates with MF in vitro to promote NP regeneration. C) Magnetotactic hydrogel promotes NP repair by recruiting endogenous stem cells, initiating stem cell training, and suppressing ROS and inflammation.
Figure 1
Figure 1
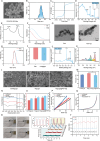
Characterization of Mag‐gel@PdH‐Apt. A) Transmission electron microscopy (TEM) visualization of synthesized PEG/PEI‐SPIONs. B) Particle size distribution of PEG/PEI‐SPIONs calculated from TEM images. C) Hysteresis behavior observed in PEG/PEI‐SPIONs at standard room conditions. D) High‐resolution XPS of PEG/PEI‐SPIONs. E) The high‐resolution XPS spectra of Fe 2p were obtained for PEG/PEI‐SPIONs. F) UV–vis–NIR spectra of Pd and PdH. G) TEM images of fabricated PdH and PdH‐Apt. H) Particle size distributions of PdH and PdH‐Apt. I) Zeta potentials of PdH and PdH‐Apt. J) High‐resolution XPS spectrum of PdH‐Apt. K) High‐resolution XPS spectrum of Pd 3d for PdH‐Apt. L) Microstructures of nonMag‐gel, Mag‐gel, and Mag‐gel@PdH‐Apt observed using SEM. M) Porosities of nonMag‐gel, Mag‐gel, and Mag‐gel@PdH‐Apt. N) FTIR spectra of nonMag‐gel, Mag‐gel, and Mag‐gel@PdH‐Apt. O) Young's moduli of nonMag‐gel, Mag‐gel, and Mag‐gel@PdH‐Apt. P) Compression stress‐strain curves of nonMag‐gel, Mag‐gel, and Mag‐gel@PdH‐Apt. Q) Tensile stress–strain curves of nonMag‐gel, Mag‐gel, and Mag‐gel@PdH‐Apt. R) Time‐lapse imaging of magnetic hydrogels attracted by permanent magnets. S) Profile of magnetic force exerted on the Mag‐gel@PdH‐Apt by a dynamic magnetic force apparatus, with the magnet moving within a range of 10 to 50 mm from the hydrogel. T) Magnetorheological characterization of Mag‐gel@PdH‐Apt. Date are presented as mean ± standard deviation (SD) (n = 3, *P < 0.05).
Figure 2
Figure 2
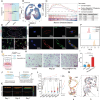
In vitro assessment of aptamer targeting and recruitment ability for NPSCs. A) Violin plots of TEK and B4GALNT genes in NPSCs and non‐NPSCs. B) Uniform manifold approximation and projection (UMAP) visualization showing gene expression level of TEK, GB4GALNT, and other cell types from NPSCs inside NP tissues. C) GSEA of NPSC marker genes. D) Immunofluorescence staining of GD2 and Tie2 expression in the IVD. E) Confocal microscopy images demonstrating colocalization of Aptamer DB67‐FAM binding on NPSCs. Cell membranes were stained with Dil. F) Flow cytometric analysis of NPSCs after incubation with Cy3‐labeled DB67. G) Schematic depiction of transwell assay for studying the impact of DB67 on NPSCs migration. H) Representative images of NPSCs migrating from each group. I) Statistical data from transwell assay (n = 3, ****P < 0.0001). J) Schematic illustration of NPSCs recruitment based on hydrogel with or without aptamer. K) Confocal observation of top‐to‐bottom cell recruitment at 1, 3, and 7 days after implantation of NPSCs on hydrogel surface. L) Statistics of maximum cell penetration depth of hydrogels and number of cells in different layers. M) Evaluation of DB67 core region for GD2 recognition and binding (a. binding complex of DB67 and GD2; b. 3D diagram of interfacial interaction between GD2 and DB67. C12, G19, A21, C22, A24, and A25 formed polar interactions). All statistical data are presented as mean ± SD.
Figure 3
Figure 3
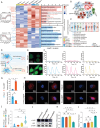
In vitro assessment of the impact of mechanical training on cellular cytoskeletal remodeling and proliferation. A) Confocal immunofluorescence and color‐mapped images of cell morphology and F‐actin polymerization in NPSCs under different culture conditions. B) Angle distribution of F‐actin. C) Violin plots depicting the spreading areas and aspect ratios of NPSCs across different conditions (n = 20, **P < 0.01; and ****P < 0.0001). D) Representative images of EdU staining. E) Quantification of EdU‐positive cell rates among various treatment groups (n = 3, **P < 0.01; ****P < 0.0001). F,G) Western blot (WB) analysis and quantitation of Ki67 protein levels among different groups (n = 3, *P < 0.05; ***P < 0.001). H) Scheme for real‐time single‐cell cyclic dynamics detection using fluorescent ubiquitination‐based cell cycle indicator (FUCCI) system. I) Fluorescence delay imaging of cell cycle alterations in Fucci‐expressing NPSCs after different treatments. J) Fluorescence multiwave scorings of red, yellow, and green cells after different treatments from three fields of view per timepoint. K) Fractions of NPSCs in different cell cycles after different treatments. All statistical data are presented as mean ± SD.
Figure 4
Figure 4
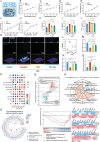
Mechanical stimulation‐regulated mechanism of NPSC proliferation. A) RNA‐seq analyses of significantly regulated pathways in Mag‐gel@MF versus Mag‐gel. Left: Number and trend of up‐regulated and down‐regulated genes in Mag‐gel@MF versus Mag‐gel. Middle: Heatmap of DEG expression levels between different groups. Right: Functional enrichment analysis and annotation for up‐ and down‐regulated genes. B) GSEA for DEGs of Mag‐gel@MF versus Mag‐gel. C) Bean plot showing expression of up‐regulated genes associated with critical pathways in Mag‐gel@MF group. D) Schematic illustration of magneto‐mechanical training directing NPSC proliferation and differentiation by opening calcium channels and promoting YAP nuclear translocation. E,F) Representative images of real‐time Ca2+ imaging and quantitative data of Ca2+ fluorescence intensity of differently treated NPSCs (n = 3). G) Comparison of number of calcium spikes and initiation calcium spikes in NPSCs under different treatments (n = 3, *P < 0.05, ****P < 0.0001). H) Immunofluorescence images of YAP. I) Quantitative assessment of YAP localization in the nucleus (n = 3, *P < 0.05). J–L) Western blot analysis and quantification of YAP and phosphorylated‐YAP levels across various treatments (n = 3, ****P < 0.0001). All statistical data are presented as mean ± SD.
Figure 5
Figure 5
Mechanical stimulation‐driven differentiation of NPSCs. A) GO enrichment analysis of DEG between Mag‐gel@MF and Mag‐gel groups. B) Heatmap of representative DEGs expression levels from GO term associated with differentiation of NPSCs. C) GSEA for DEGs of Mag‐gel@MF‐treated NPSCs. D) Immunofluorescence images of Col II. E) Quantification of fluorescence intensity of Col II in various treatment groups (n = 3, **P < 0.01, ****P < 0.0001). F) Detection of Col II, ACAN, MMP‐13, and β‐actin protein levels in nonMag‐gel, nonMag‐gel@MF, Mag‐gel, and Mag‐gel@MF groups using WB. Expression levels of G) Col II, H) ACAN, and I) MMP‐13 protein in NPSCs across various treatment at day 7 post‐treatment (n = 3; *P < 0.05, **P < 0.01, ***P < 0.001, and ****P < 0.0001). All statistical data are presented as mean ± SD.
Figure 6
Figure 6
In vitro ROS‐scavenging and anti‐inflammatory properties of PdH and PdH‐Apt. A) Schematic depiction of the multifaceted therapeutic mechanisms of PdH‐Apt on IDD, including ROS‐scavenging, anti‐inflammatory activities, and matrix synthesis activation. B) Evaluation of ABTS (2,20‐azinobis) radical scavenging capacity of PdH and PdH‐Apt at varying concentrations (n = 3). C) O2 •–‐, D) H2O2‐, and E) •OH‐scavenging capabilities of PdH and PdH‐Apt (n = 3). F) Catalase (CAT)‐ and G) Superoxide dismutase (SOD)‐like activities of PdH and PdH‐Apt (n = 3). H) IL‐1β, I) IL‐6, and J) TNF‐α in LPS‐induced NPSCs under different treatments, including control, LPS, LPS + PdH, and LPS + PdH‐Apt (n = 3, *P < 0.05, **P < 0.01, ***P < 0.001). K) Immunofluorescent imaging and L) relative fluorescence intensity quantification of TNF‐α in LPS‐induced NPSCs following different treatments. M) Col II, N) ACAN, and O) MMP‐13 mRNA expressions in different treatments (n = 3, *P < 0.05, **P < 0.01, ***P < 0.001). P) Single‐sample gene set enrichment analysis (ssGSEA) of differences in infiltration of immune cell types in LPS and LPS + PdH‐Apt treatment groups. Q) DEG volcano map comparing LPS + PdH‐Apt versus LPS treatment. Red dots signify 161 DEGs with substantial upregulation, blue dots indicate 143 DEGs with substantial downregulation, while gray dots represent unchanged genes. R) Radar plot showing GO enrichment of DEGs in LPS + PdH‐Apt versus LPS treatment. S) The expression levels of pathway signature genes. T) GSEA for DEGs of LPS + PdH‐Apt‐treated NPSCs. All statistical data are presented as mean ± SD.
Figure 7
Figure 7
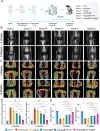
Radiological assessment of animal experiments. A) Schematic diagram of animal experimental procedures. Representative images of each group at 4‐ and 8‐weeks post‐treatment, involving B) MRI and C) micro‐computed tomography (CT) quantitative analyses of D) Pfirrmann grading score and E) height index (% DHI) in each group (n = 3; *P < 0.05, **P < 0.01, ***P < 0.001, and ****P < 0.0001). All statistical data are presented as mean ± SD.
Figure 8
Figure 8
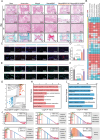
Histological assessment following various in vivo treatments. A) Representative images of Hematoxylin‐eosin (H&E) and Safranin O/fast Green (SOFG) staining of IVD tissues from different groups at 8‐weeks post‐operation. B) Histological grading of IVD from different treatment groups at 4‐ and 8‐ weeks post‐operation. C) Immunofluorescence staining of GD2. D) Quantification of the proportion of GD2+ cells (n = 3, *P < 0.05; ***P < 0.001; and ****P < 0.0001). E) Immunofluorescence staining of CD24. F) Quantification of the proportion of CD24+ cells (n = 3, *P < 0.05; ****P < 0.0001). G) DEG volcano map comparing Mag‐gel@PdH‐Apt@MF versus acupuncture treatment. Red dots signify 175 DEGs with substantial upregulation, blue dots indicate 176 DEGs with substantial downregulation, whereas gray dots represent unchanged genes. GO enrichment analysis of H) up‐ and I) down‐regulated DEGs between Mag‐gel@PdH‐Apt@MF and acupuncture treatments. J) GSEA results of DEGs. All statistical data are presented as mean ± SD.

References

    1. Knezevic N. N., Candido K. D., Vlaeyen J. W. S., Van Zundert J., Cohen S. P., Lancet 2021, 398, 78. - PubMed
    1. Kamali A., Ziadlou R., Lang G., Pfannkuche J., Cui S., Li Z., Richards R. G., Alini M., Grad S., Theranostics 2021, 11, 27. - PMC - PubMed
    1. Xin J., Wang Y., Zheng Z., Wang S., Na S., Zhang S., Orthop. Surg. 2022, 14, 1271. - PMC - PubMed
    1. Clouet J., Fusellier M., Camus A., Visage C. L.e, Guicheux J., Adv. Drug Delivery Rev. 2019, 146, 306. - PubMed
    1. Fine N., Lively S., Séguin C. A., Perruccio A. V., Kapoor M., Rampersaud R., Nat. Rev. Rheumatol. 2023, 19, 136. - PubMed

LinkOut - more resources