. 2024 Nov;11(44):e2310002.
doi: 10.1002/advs.202310002. Epub 2024 Oct 7.

Trojan-Horse Strategy Targeting the Gut-Liver Axis Modulates Gut Microbiome and Reshapes Microenvironment for Orthotopic Hepatocellular Carcinoma Therapy

Affiliations

Trojan-Horse Strategy Targeting the Gut-Liver Axis Modulates Gut Microbiome and Reshapes Microenvironment for Orthotopic Hepatocellular Carcinoma Therapy

Haochen Yao et al. Adv Sci (Weinh). 2024 Nov.

Abstract

Reversing the hepatic inflammatory and immunosuppressive microenvironment caused by gut microbiota-derived lipopolysaccharides (LPS), accumulating to the liver through the gut-liver axis, is crucial for suppressing hepatocellular carcinoma (HCC) and metastasis. However, synergistically manipulating LPS-induced inflammation and gut microbiota remains a daunting task. Herein, a Trojan-horse strategy is proposed using an oral dextran-carbenoxolone (DEX-CBX) conjugate, which combines prebiotic and glycyrrhetinic acid (GA) homologs, to targeted delivery GA to HCC through the gut-liver axis for simultaneous modulation of hepatic inflammation and gut microbiota. In the orthotopic HCC model, a 95-45% reduction in the relative abundances of LPS-associated microbiota is observed, especially Helicobacter, caused by DEX-CBX treatment over phosphate-buffered saline (PBS) treatment. Notably, a dramatic increase (37-fold over PBS) in the abundance of Akkermansia, which is known to strengthen systemic immune response, is detected. Furthermore, DEX-CBX significantly increased natural killer T cells (5.7-fold) and CD8+ T cells (3.9-fold) as well as decreased M2 macrophages (59% reduction) over PBS treatment, resulting in a tumor suppression rate of 85.4%. DEX-CBX is anticipated to offer a novel strategy to precisely modulate hepatic inflammation and the gut microbiota to address both the symptoms and root causes of LPS-induced immunosuppression in HCC.

Keywords: gut microbiota; hepatic inflammation; hepatocellular carcinoma; immunotherapy; oral nanomedicine.


Conflict of interest statement

The authors declare no conflict of interest.

Figures

Scheme 1
Scheme 1
Schematic illustration of the mechanism of orally administered DEX‐CBX for HCC therapy. GA can be released from orally administrated DEX‐CBX inside the colon in the presence of gut bacterial secreted dextranase and esterase, and suppressing LPS‐mediated TLR4 activation after arriving at HCC through the gut‐liver axis, which results in relieving of tumor immunosuppressive TME, characterized by reduced content of M2 macrophages, MDSCs and IL‐6, and increased content of CD8+ T cells, NKT cells and IFN‐γ. The structures of CBX, GA, and GL are resented in Figure S1 (Supporting Information).
Figure 1
Figure 1
Synthesis and solution behavior of DEX‐CBX. A) Synthesis routes of DEX‐CBX. B) 1H NMR spectrum of DEX, Carbenoxolone, and DEX‐CBX in DMSO‐d6. C) Representative TEM image and hydrodynamic diameters of DEX‐CBX measured by DLS. D) In vitro GA release profiles of DEX‐CBX in buffer containing 0.2% (w/v) Tween 80 at different conditions: pH 1.2, pH 7.4, pH 7.4 with dextranase and pH 7.4 with dextranase and esterase. Data are shown as means ± SD (n = 3).
Figure 2
Figure 2
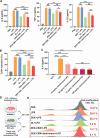
Suppression of LPS‐induced inflammation and tumor cell proliferation. A) The IL‐6, TNF‐α, and IL‐1β levels of RAW2.64.7 cells incubated with or without LPS after different treatments. B) The level of TLR4 activation of HEK‐Blue hTLR4 cells after different treatments. C) The IL‐6 levels of RAW2.64.7 cells incubated with LPS with different concentrations of DEX‐CBX. D) Schematic illustration of in vitro suppression of LPS‐induced tumor cells proliferation experiment. E) The flow cytometry results of in vitro suppression of LPS‐induced tumor cell proliferation. Data are shown as means ± SD (n = 3). * p < 0.05, ** p < 0.01, *** p < 0.001; ns, no significance.
Figure 3
Figure 3
Gastrointestinal tract distribution and pharmacokinetics study of DEX‐CBX. A) Schematic illustrations of the mouse gastrointestinal tract and the ex vivo fluorescence images of the intestinesthe captured at 1, 2, 4, and 8 h after oral administration of DEX‐CBX. B) Pharmacokinetic results of oral GL or DEX‐CBX in orthotopic HCC bearing mice. C–F) Quantitative analysis of the GA biodistribution in small intestine, large intestine, liver, and tumor at different times after oral administration of free GL or DEX‐CBX in orthotopic HCC bearing mice. Data are shown as means ± SD (n = 3).
Figure 4
Figure 4
Distinct gut microbial communities are promoted by various treatments. A) Relative abundance of gut microbiome. Phylum‐ and family‐level taxonomy are presented as a percentage of total sequences, n = 5. B) Heatmap of the relative abundance of family‐level taxa (rows) for each mouse (columns). The abundance is shown as a relative percentage, n = 5. C) Estimation of microbial community observed OTU richness and relative abundance of select taxa, n = 5. Data are shown as means ± SD (n = 5). * p < 0.05, ** p < 0.01, *** P < 0.001; ns, no significance.
Figure 5
Figure 5
Tumor inhibition in orthotopic H22 tumor model. A) Treatment regimen. Representative photos of livers B), tumor weight C), liver weight D), tumor/liver weight ratios E), and body weight changes F) after mice received different treatments. G) H&E staining images of the liver of mice after receiving different treatments. H) Overall survival time of orthotopic H22 tumor‐bearing mice after receiving different treatments. Data are shown as means ± SD (n = 5). * p < 0.05, ** p < 0.01, *** p < 0.001; ns, no significance.
Figure 6
Figure 6
Changes in the immune microenvironment after various treatments. Proportions of liver‐infiltrating CD4+ T cells A), CD8+ T cells B), and NKT cells C) after mice received different treatments. (n = 5). Tumoral CD4+ T cells D), CD8+ T cells E), NKT cells F), MDSCs cells G), and M2 macrophages H) after mice received different treatments. (n = 5) I) Western blot images of NF‐κB expression in orthotopic HCC tissues after various treatments. J) Relative NF‐κB expressions in tumors of different groups compared to the PBS group; n = 3. K) The level of cytokines IL‐6 in tumors after mice received different treatments. (n = 4) Data are shown as means ± SD; * p < 0.05, ** p < 0.01, *** p < 0.001; ns, no significance.

References

    1. a) Filliol A., Schwabe R. F., Semin. Liver Dis. 2019, 39, 315; - PubMed
    2. b) Singal A. G., El‐Serag H. B., Clin. Gastroenterol. Hepatol. 2015, 13, 2140; - PMC - PubMed
    3. c) Ji G., Ma L., Yao H., Ma S., Si X., Wang Y., Bao X., Ma L., Chen F., Ma C., Huang L., Fang X., Song W., Acta Pharm. Sin. B 2020, 10, 2171. - PMC - PubMed
    1. Robinson M. W., Harmon C., O'Farrelly C., Cell Mol. Immunol. 2016, 13, 267. - PMC - PubMed
    1. Prieto J., Melero I., Sangro B., Nat. Rev. Gastroenterol. Hepatol. 2015, 12, 681. - PubMed
    1. a) Schwabe R. F., Greten T. F., J. Hepatol. 2020, 72, 230; - PubMed
    2. b) Yu L. X., Schwabe R. F., Nat. Rev. Gastroenterol. Hepatol. 2017, 14, 527. - PMC - PubMed
    1. Liu Z., Lin Y., Zhang J., Zhang Y., Li Y., Liu Z., Li Q., Luo M., Liang R., Ye J., J. Exp. Clin. Cancer Res. 2019, 38, 447. - PMC - PubMed

MeSH terms

Substances

LinkOut - more resources