. 2024 Oct;11(10):2530-2547.
doi: 10.1002/acn3.52156. Epub 2024 Oct 7.

Overlap of spike and ripple propagation onset predicts surgical outcome in epilepsy

Affiliations

Overlap of spike and ripple propagation onset predicts surgical outcome in epilepsy

Saeed Jahromi et al. Ann Clin Transl Neurol. 2024 Oct.

Abstract

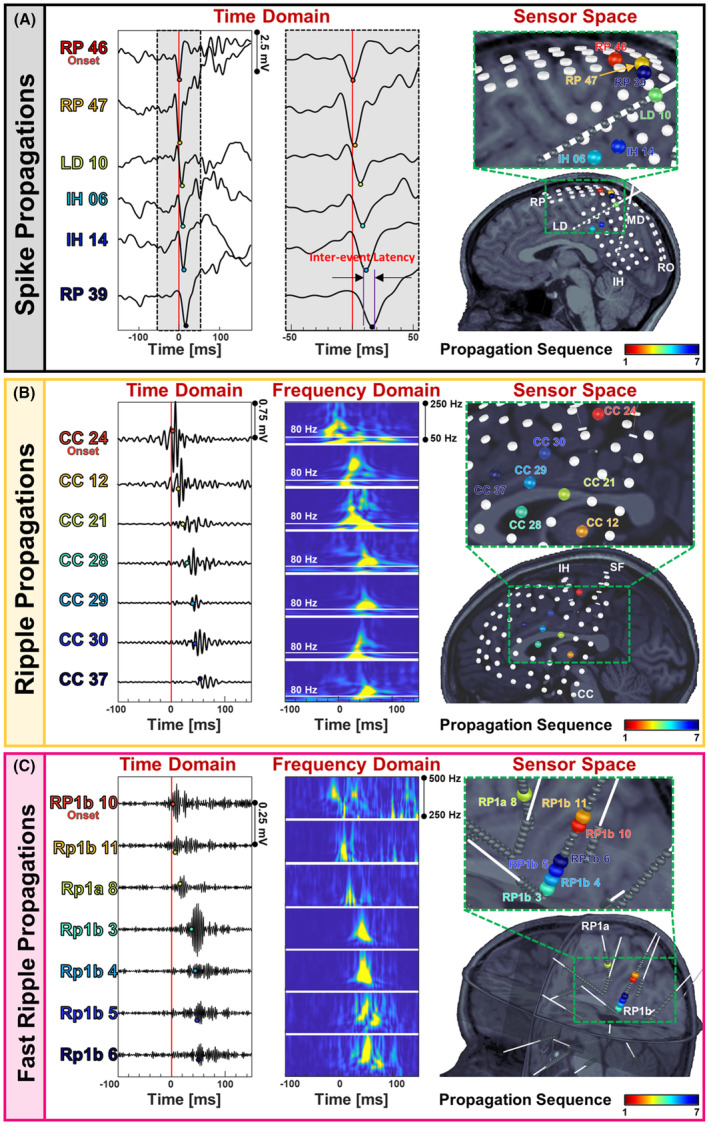
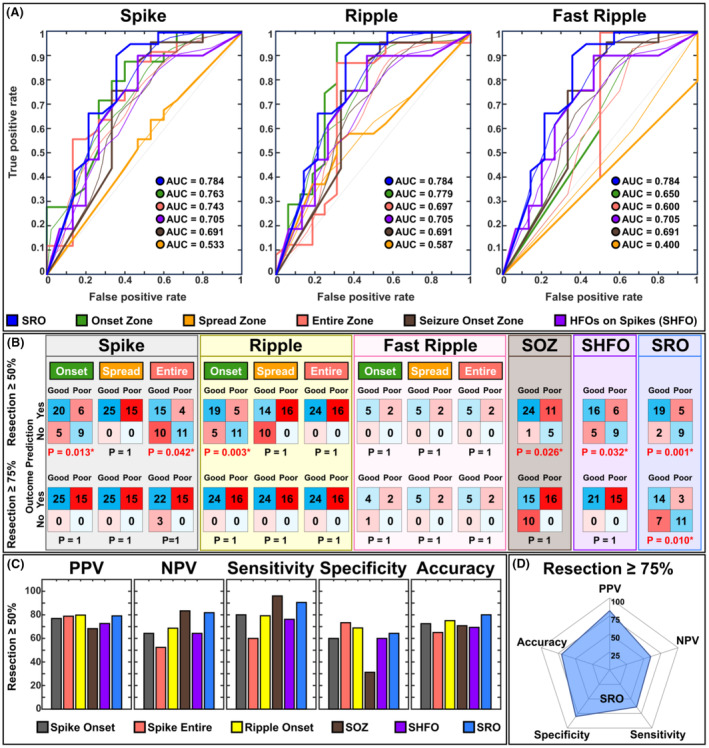
Objective: Interictal biomarkers are critical for identifying the epileptogenic focus. However, spikes and ripples lack specificity while fast ripples lack sensitivity. These biomarkers propagate from more epileptogenic onset to areas of spread. The pathophysiological mechanism of these propagations is elusive. Here, we examine zones where spikes and high frequency oscillations co-occur (SHFO), the spatiotemporal propagations of spikes, ripples, and fast ripples, and evaluate the spike-ripple onset overlap (SRO) as an epilepsy biomarker.

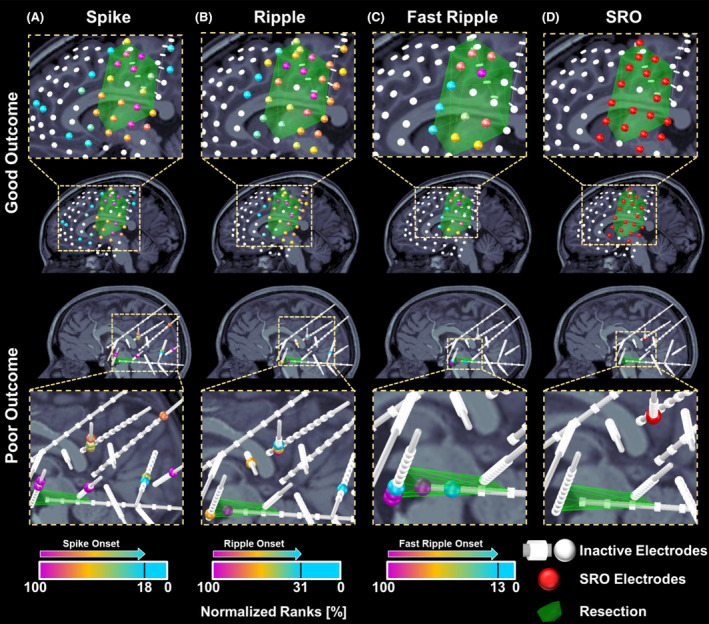
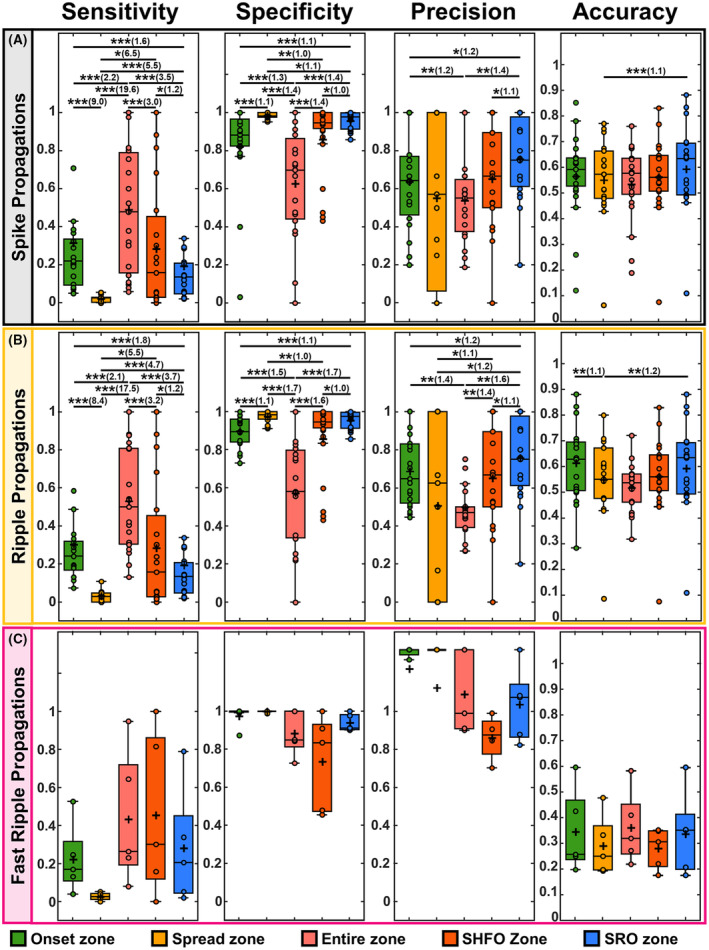
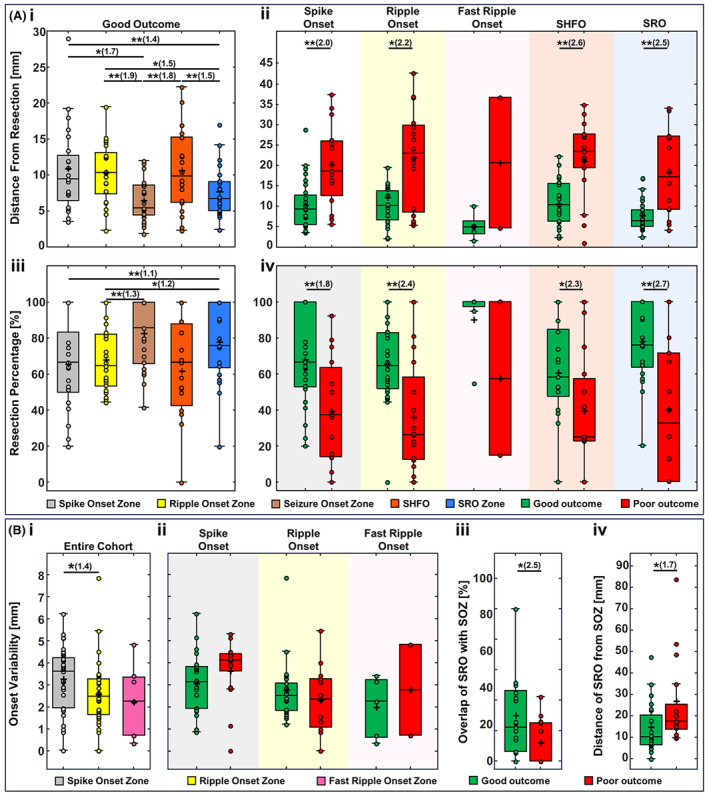
Methods: We retrospectively analyzed intracranial EEG data from 41 patients with drug-resistant epilepsy. We mapped propagations of spikes, ripples, and fast ripples, and identified their onset and spread zones, as well as SHFO and SRO. We then estimated the SRO prognostic value in predicting surgical outcome and compared it to onset and spread zones of spike, ripple, and fast ripple propagations, and SHFO.

Results: We detected spikes and ripples in all patients and fast ripples in 12 patients (29%). We observed spike and ripple propagations in 40 (98%) patients. Spike and ripple onsets overlapped in 35 (85%) patients. In good outcome patients, SRO showed higher specificity and precision (p < 0.05) in predicting resection compared to onset and zones of spikes, ripples, and SHFO. Only SRO resection predicted outcome (p = 0.01) with positive and negative predictive values of 82% and 57%, respectively.

Interpretation: SRO is a specific and precise biomarker of the epileptogenic zone whose removal predicts outcome. SRO is present in most patients with drug-resistant epilepsy. Such a biomarker may reduce prolonged intracranial monitoring and improve outcome.


Conflict of interest statement

The authors have no conflict of interest to report.

Figures

Figure 1
Figure 1
Sequences of spike, ripple, and fast ripple propagations. (A) Spike propagation in time domain (ms) across depth electrodes implanted in a 9‐year‐old female patient with drug‐resistant epilepsy (DRE) (patient #8). The first event in propagation is considered as the onset event, followed by the next events. The time window between two successive events (i.e., inter‐event interval) in a spike propagation was set to 10 ms. Electrodes that participate in propagation are color‐coded according to their order in propagation. The propagation sequence is shown color‐coded on electrodes co‐registered on patient's MRI, with the onset electrode colored in red and the last electrode in the propagation colored in blue. (B) Ripple propagation in time domain (ms) across subdural electrodes implanted on the cortex of a 11‐year‐old male patient with DRE (patient #1). The inter‐event interval for ripple propagations was set to 30 ms. Time‐frequency plots of each of the events in propagation are also displayed (50–250 Hz); the 80 Hz frequency is indicated to define the lower boundaries of the ripple frequency band. The sequence of this propagation is showed on patient's MRI. The electrodes that participate in the propagation are colored according to the order they appear in propagation. (C) Fast ripple propagation in time domain (ms) across depth electrodes implanted in a 6‐year‐old female patient (patient #23). The inter‐event interval for fast ripple propagations was set to 15 ms. The time‐frequency plot of each of the events in the propagation is plotted (250–500 Hz). The propagation sequence is shown color‐coded on electrodes co‐registered on patient's MRI. The electrodes that participate in the propagation are colored according to the order they appear in the propagation.
Figure 2
Figure 2
Electrodes ranking based on spike, ripple, and fast ripple propagations and spike–ripple onset overlap (SRO) zone in a good and a poor outcome patient. (A) Normalized ranks of electrodes contributing to spike propagations in a 9‐year‐old female patient (patient #8) with subdural and depth electrodes (good outcome) and a 10‐year‐old female patient (patient #27) with depth electrodes (poor outcome). Electrodes are depicted as color‐coded spheres; the color reflects normalized ranks from 100% (propagation onset) to 0% propagation end. Outlier electrodes or electrodes that did not contribute to propagations are depicted in white. (B) Electrodes' normalized ranks based on their participation in generating ripple propagations. (C) Electrode's normalized ranks based on fast ripple propagations. The optimal threshold to differentiate between onset and spread zones were calculated as 18.2%, 30.8%, and 13.0% for spike, ripple, and fast ripple propagations, respectively. (D) Electrodes present in both spike and ripple propagation onsets [i.e., the spike–ripple onset overlap zone (SRO)].
Figure 3
Figure 3
Statistics for prediction of resection in good outcome patients. (A) Sensitivity, specificity, precision, and accuracy of the onset and spread zone of spike propagations, the entire zone of spikes, the spikes co‐occurring with HFOs (SHFO) zone, and spike–ripple onset overlap zone (SRO) in predicting the resection zone of good outcome patients with SRO (21 patients). (B) Statistics for ripple onset and spread zones, the entire ripple zone, the SHFO, and the SRO in predicting resection zone of good outcome patients with SRO (21 patients). (C) Statistics for fast ripple onset and spread zones, the entire fast ripple zone, the SHFO, and the SRO in predicting resection zone of good outcome patients (5 patients). In the boxplots, the cross indicates the mean value, and the horizontal lines indicate the median value, lower and upper edges represent the 25th and 75th percentiles, whiskers extend to the 0th and 100th percentiles (excluding outliers) and points outside the whiskers represent the outliers (i.e., values that are at least 1.5 times the interquartile range below the 25th percentile or above the 75th percentile). The multiple comparisons issue was accounted for using the false discovery rate (FDR) correction. Pairs of significant differences are indicated by horizontal lines with asterisks above them: **p < 0.01, and ***p < 0.001. The effect size in significant comparisons is calculated as the ratio of the higher median value to the lower median value and is reported in parentheses after the asterisks.
Figure 4
Figure 4
Distance from resection, resection percentage, and onset variability of different zones in predicting the epileptogenic zone. [A(i)] Comparing the distance of spike onset, ripple onset, seizure onset zone (SOZ), spike co‐occurring with HFOs (SHFO) zone, and spike–ripple onset overlap zone (SRO) from the resection zone in good outcome patients with SRO (21 patients). (ii) The distance from resection in good versus poor outcome patients for spike onset (good: 25 patients, poor: 15 patients), ripple onset (good: 24 patients, poor: 16 patients), fast ripple onset (good: 5 patients, poor: 2 patients), SHFO (good: 21 patients, poor: 15 patients), and SRO (good: 21 patients, poor: 14 patients). (iii) Comparing the overlap with resection for spike onset, ripple onset, SOZ, SHFO, and SRO in good outcome patients with SRO. (iv) The overlap with resection for spike onset, ripple onset, fast ripple onset, SHFO, and SRO in good versus poor outcome patients. [B(i)] comparing the onset variability of spike, ripple, and fast ripple onsets in good outcome patients. (ii) The onset variability of spike onset, ripple onset, SOZ and SRO in good versus poor outcome patients. (iii) Distance of SOZ from SRO and (iv) the percentage of overlap between SRO and SOZ in good versus poor outcome patients. In the boxplots, the cross indicates the mean value, and the horizontal lines indicate the median value, lower and upper edges represent the 25th and 75th percentiles, whiskers extend to the 0th and 100th percentiles (excluding outliers) and points outside the whiskers represent the outliers (i.e., values that are at least 1.5 times the interquartile range below the 25th percentile or above the 75th percentile). The multiple comparisons issue was accounted for using the false discovery rate (FDR) correction. Pairs of significant differences are indicated by horizontal lines with asterisks above them: *p < 0.05, **p < 0.01. The effect size in significant comparisons is calculated as the ratio of the higher median value to the lower median value and is reported in parentheses after the asterisks.
Figure 5
Figure 5
Outcome prediction results. (A) From left to right: receiver operating characteristic (ROC) curve and their area under the curve (AUC) for onset, spread, and entire zones of spike (40 patients), ripple (40 patients), and fast ripple propagations (7 patients), spike co‐occurring with HFOs (SHFO) zone (36 patients), the spike–ripple onset overlap zone (SRO, 35 patients), and the seizure onset zone (SOZ, 41 patients) as predictors of postsurgical outcome. (B) Confusion matrices for each of the zones in predicting the surgical outcome at resection threshold of 50% and resection threshold of 75% using the logistic regression with leave one out cross validation method. (C) from left to right: positive predictive value (PPV), negative predictive value (NPV), sensitivity, specificity, and accuracy of each of the zones for predicting the outcome corresponding to the resection threshold of 50%. (D) Spider plot of PPV, NPV, sensitivity, specificity, and accuracy of each of the zones for predicting the outcome corresponding to the resection threshold of 75%.

References

    1. Englot DJ, Chang EF. Rates and predictors of seizure freedom in resective epilepsy surgery: an update. Neurosurg Rev. 2014;37(3):389‐404; discussion 404–405. - PMC - PubMed
    1. Papadelis C, Perry MS. Localizing the epileptogenic zone with novel biomarkers. Semin Pediatr Neurol. 2021;39:100919. - PMC - PubMed
    1. Rijal S, Corona L, Perry MS, et al. Functional connectivity discriminates epileptogenic states and predicts surgical outcome in children with drug resistant epilepsy. Sci Rep. 2023;13(1):9622. - PMC - PubMed
    1. Papadelis C, Tamilia E, Stufflebeam S, et al. Interictal high frequency oscillations detected with simultaneous magnetoencephalography and electroencephalography as biomarker of pediatric epilepsy. J Vis Exp. 2016;(118):54883. - PMC - PubMed
    1. Fujiwara H, Kadis DS, Greiner HM, et al. Clinical validation of magnetoencephalography network analysis for presurgical epilepsy evaluation. Clin Neurophysiol. 2022;142:199‐208. - PubMed

LinkOut - more resources