. 2024 Oct 7;22(10):e3002842.
doi: 10.1371/journal.pbio.3002842. eCollection 2024 Oct.

Amalgam plays a dual role in controlling the number of leg muscle progenitors and regulating their interactions with the developing Drosophila tendon

Affiliations

Amalgam plays a dual role in controlling the number of leg muscle progenitors and regulating their interactions with the developing Drosophila tendon

Blandine Moucaud et al. PLoS Biol. .

Abstract

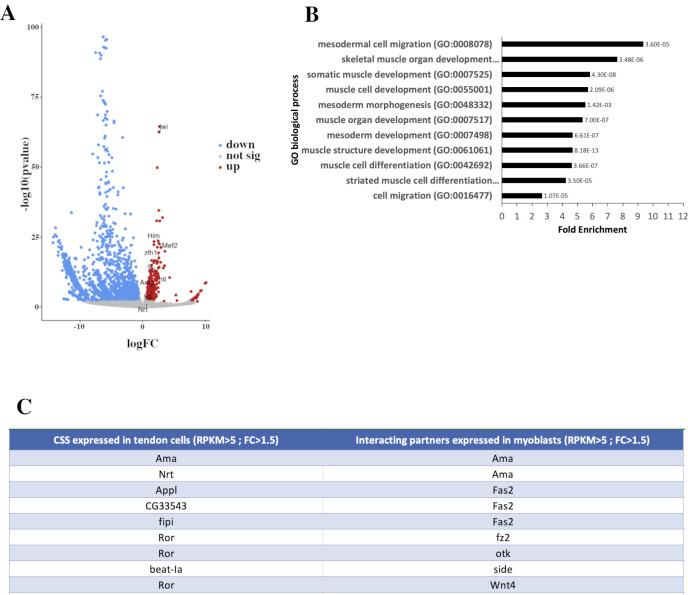
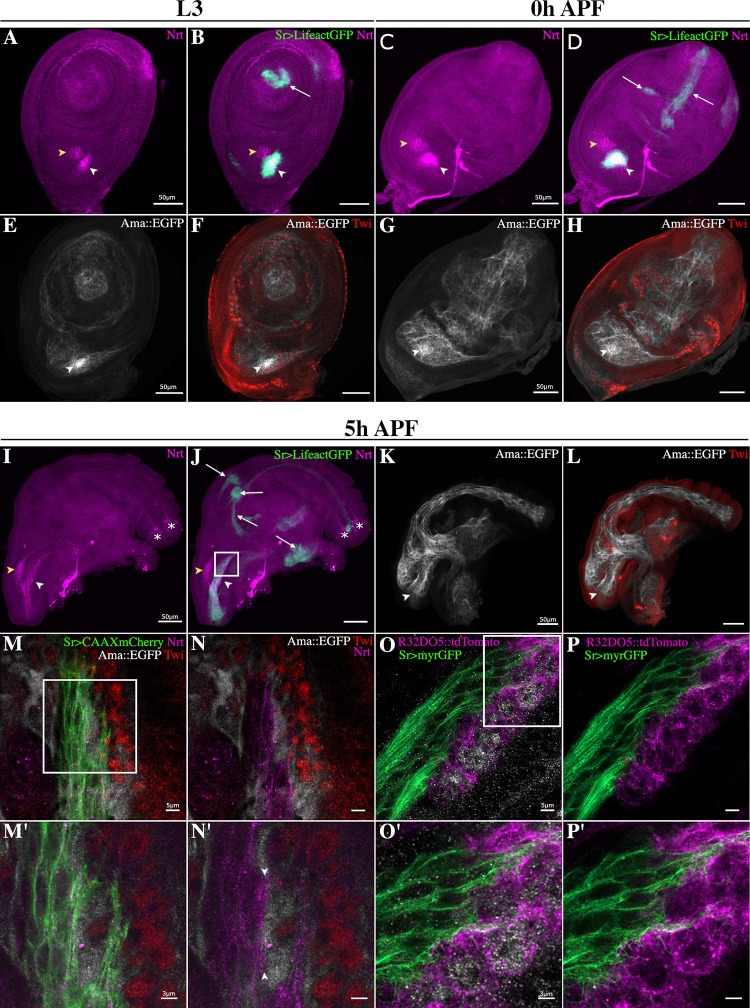
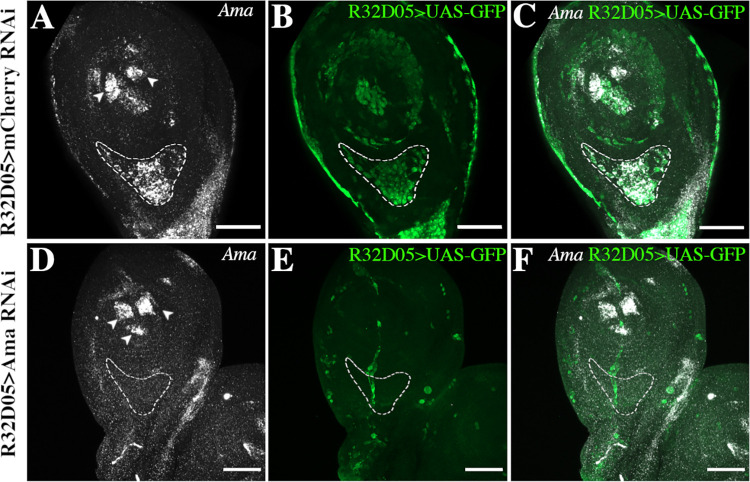
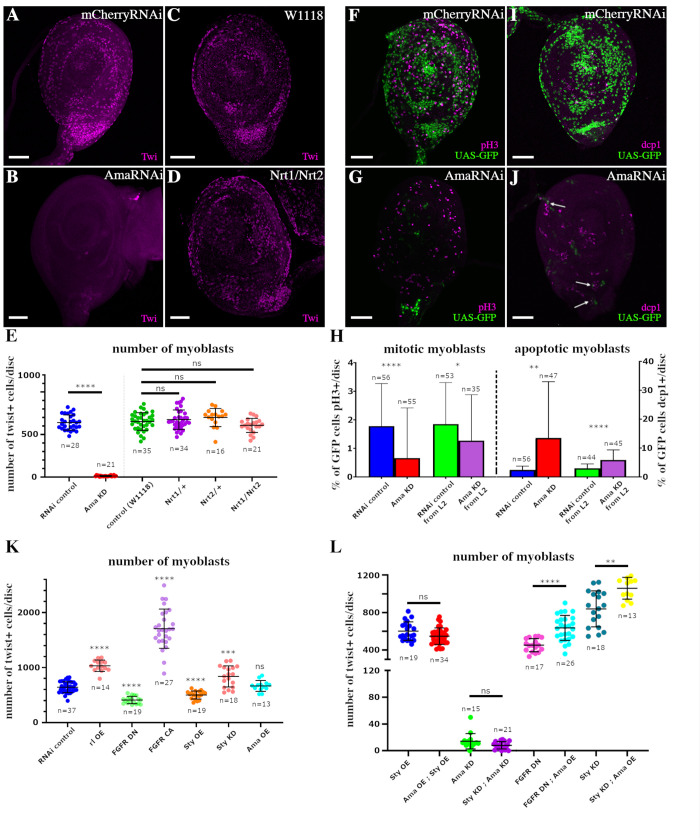
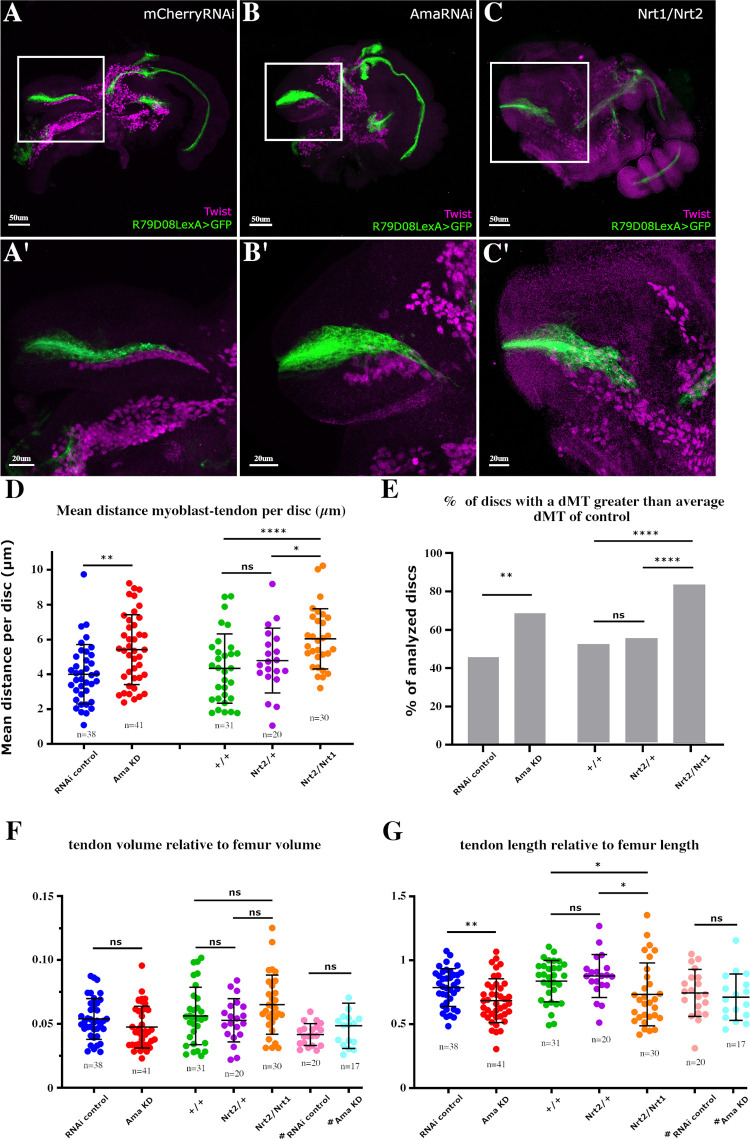
Formation of functional organs requires cell-cell communication between different cell lineages and failure in this communication can result in severe developmental defects. Hundreds of possible interacting pairs of proteins are known, but identifying the interacting partners that ensure a specific interaction between 2 given cell types remains challenging. Here, we use the Drosophila leg model and our cell type-specific transcriptomic data sets to uncover the molecular mediators of cell-cell communication between tendon and muscle precursors. Through the analysis of gene expression signatures of appendicular muscle and tendon precursor cells, we identify 2 candidates for early interactions between these 2 cell populations: Amalgam (Ama) encoding a secreted protein and Neurotactin (Nrt) known to encode a membrane-bound protein. Developmental expression and function analyses reveal that: (i) Ama is expressed in the leg myoblasts, whereas Nrt is expressed in adjacent tendon precursors; and (ii) in Ama and Nrt mutants, myoblast-tendon cell-cell association is lost, leading to tendon developmental defects. Furthermore, we demonstrate that Ama acts downstream of the FGFR pathway to maintain the myoblast population by promoting cell survival and proliferation in an Nrt-independent manner. Together, our data pinpoint Ama and Nrt as molecular actors ensuring early reciprocal communication between leg muscle and tendon precursors, a prerequisite for the coordinated development of the appendicular musculoskeletal system.


Conflict of interest statement

The authors have declared that no competing interests exist.

Figures

Fig 1
Fig 1. DE genes and interactome data in leg disc myoblasts.
(A) Volcano plot showing DE genes, including 533 enriched genes (red) and 1,703 down-regulated genes (blue). Those not significantly changed (fold change < 1.5; P > 0.05) are in gray (S1 Data). Examples of genes known to be specifically expressed in myoblasts are annotated, as are Nrt and Ama. For graphical representation, outliers (-log10 (p-value) >100 and log FC >20) were excluded. Generated using Volcano Plot tool (Galaxy V.0.0.5). (B) GO analysis of enriched genes in leg myoblasts. Graph shows selected GO terms for biological process, GO term accession numbers, fold enrichment, and p-value. Data were obtained by GO overrepresentation test using PANTHER. (C) List of identified pairs of interacting partners expressed in myoblasts and tendon cells (Flybase protein interactions browser). Among the 290 pairs of interacting genes expressed in myoblasts and tendon cells (RPKM>5), 9 of them have corresponding interacting genes with a Fold Change >1.5. DE, differentially expressed; GO, gene ontology.
Fig 2
Fig 2. Nrt and Ama are expressed in muscle and tendon precursors during leg disc development.
(A–L) Confocal optical sections of Sr-Gal4>UAS-Lifeact.GFP (green) and Ama::EGFP (gray) leg discs at different stages of development immunostained for Nrt (magenta) and for Twist (Twi—red), respectively. (A–D) In L3 and 0 h APF leg discs, Nrt is localized in the tilt tendon in the dorsal femur (white arrowhead) but not in the other tendon precursors in green (white arrows); note Nrt presence in the chordotonal organ (yellow arrow head). (E–H) In L3 and 0 h APF leg discs, Ama::EGFP protein is found surrounding most of distal myoblasts immunostained for Twi (red); but not around the most proximal ones at the periphery of leg disc. Ama::EGFP accumulates in the region of dorsal femur close to tilt tendon precursors (white arrowhead). (I, J) At 5 h APF, Nrt remains localized in the tilt that elongates in the dorsal femur (white arrowhead) and in the chordotonal organ (yellow arrowhead). Nrt is not visible in any tendons of the other segments (white arrows) but can be detected in the 2 most distal neuronal precursors projecting axons in tarsi (asterisks, Jan and colleagues). (K, L) At 5 h APF, Ama::EGFP is detected in the entire leg disc cavity where myoblasts stand, including the dorsal femur where the Nrt-expressing tilt tendon invaginates and elongates (arrowhead). (M–P’) High-resolution imaging of Nrt-expressing tilt tendon and surrounding myoblasts at 5 h APF using Zeiss Airyscan confocal technology. The imaged regions on these discs approximately correspond to the framed area of the disc shown in J. (M, N) Close up view of myoblast-tendon interface of a 5 h APF leg disc expressing Sr-Gal4>CAAXmCherry and Ama::EGFP immunostained with Twi and Nrt antibodies with higher magnifications (M’, N’) of the framed area in M. Ama::EGFP (gray) localizes all around myoblasts (red) and next to the membrane of tendon cells (green), whereas Nrt (magenta) is specifically found in tendon cells. Note the enrichment of Nrt at the tendon membrane (between arrowheads in N’) facing the myoblast where Ama::EGFP accumulates. (O, P) Close up view of myoblast-tendon interface of a 5 h APF leg disc expressing Sr-Gal4>myrGFP and R32D05::tdTomato immunostained with Twi antibody with higher magnifications (O’, P’) of the framed area in O. Labeled membranes of myoblasts (magenta) and tendon cells (green) show a closed proximity of these 2 cell types with cytoplasmic projections from tendon cells navigating between myoblasts. Note the relative short distance between the plasma membrane and the immunostaining of Twist transcription factor suggesting that in these cells nuclei occupy most of the cell volume. APF, after pupae formation.
Fig 3
Fig 3. Myoblasts are a main source of Ama in third larval instar.
Expression of Ama revealed by in situ hybridizations on L3 leg discs from R32D05-Gal4>UAS-GFP larvae. (A–C) In control leg disc expressing UAS-mCherryRNAi in the myoblasts, Ama mRNA localized in myoblasts (green) with a sustained expression in the dorsal femur (outlined area). Note the 2 additional sources of Ama mRNA in the most distal tarsus that are not GFP-positive (arrowheads in A). (D–F) In leg disc expressing UAS-AmaRNAi specifically in the myoblasts, Ama expression is nearly abolished in the region of the tilt in the dorsal femur (outlined area); confirming that, in this region, myoblasts are the main source of Ama transcripts at this stage. As an internal control, Ama remains strongly expressed in the 3 non-GFP clusters of the distal tarsus (arrowheads). Scale bar 50 μm.
Fig 4
Fig 4. Ama controls the pool of myoblast number independently of Nrt.
(A–D) L3 leg discs immunostained for Twi (magenta). (A, B) Expression of UAS-AmaRNAi in myoblasts using R32D05-Gal4 driver leads to strong depletion of myoblasts when compared to R32D05-Gal4>UAS-mCherryRNAi control. (C, D) Comparison between leg discs of w1118 control and Nrt1/Nrt2 transheterozygous show no difference in myoblast number. (E) Dot-plot graph showing the mean number of Twi-positive myoblasts per disc, in R32D05-Gal4>UAS-mCherryRNAi (control) leg disc versus R32D05-Gal4>UAS-AmaRNAi (Ama KD) leg disc, and between w1118control leg discs versus Nrt1/Nrt+ and Nrt2/Nrt+ heterozygous leg discs and Nrt1/Nrt2 transheterozygous leg discs. (F, G) R32D05-Gal4>UAS-GFP (green) leg discs immunostained for pH3 (magenta); a small portion of myoblasts are proliferating in control (F), while only few cells remained after UAS-AmaRNAi expression in the myoblasts (G); none of them are pH3-positive. (I, J) R32D05-Gal4>UAS-GFP (green) leg discs immunostained for dcp1 (magenta); several apoptotic cells can be found among the GFP-positive cells remaining after UAS-AmaRNAi expression (arrows in J). (H) Graphs showing the percentage of mitotic myoblasts (on left) and the percentage of apoptotic myoblasts (on right). Compared to UAS-mCherryRNAi (control), the percentage of mitotic myoblasts is significantly reduced when UAS-AmaRNAi is expressed in the myoblasts from early larval stages (Ama KD) and when it is expressed from the beginning of L2 stage using Gal80ts (Ama KD from L2). Compared to UAS-mCherryRNAi (control), the percentage of apoptotic myoblasts is significantly higher when UAS-AmaRNAi is expressed in the myoblasts from early larval stages (Ama KD) and when it is expressed from the beginning of L2 stage using Gal80ts (Ama KD from L2). (K) Dot-plot graph showing the mean number of Twi-positive myoblasts per disc, in R32D05-Gal4 leg discs crossed with different UAS-transgenic lines affecting the FGFR pathway. Statistical analysis reveals an increase in the total of myoblasts when overexpressing an activated ERK (rl OE), a constitutive active FGFR (FGFR OE) or when down-regulating sty expression (Sty KD), compared to control RNAi. Inversely, overexpressing sty (Sty OE) or a dominant negative FGFR (FGFR DN) reduce the number of myoblasts. Note that overexpressing Ama (Ama OE) is not sufficient to induce an increase of myoblast number. (L) Dot-plot graph showing the mean number of Twi-positive myoblasts per disc in rescue experiments using R32D05-Gal4 driver. Overexpressing UAS-Ama together with UAS-Sty (Ama OE; Sty OE) show no significant difference in myoblast number when compared to UAS-LacZ, UAS-Sty overexpression (Sty OE). Co-expressing UAS-StyRNAi with UAS-AmaRNAi (Sty KD; Ama KD) is not sufficient to rescue the loss of myoblasts after UAS-AmaRNAi; UAS-LacZ (Ama KD) expression. Co-expressing UAS-Ama with UAS-HtlDN (FGFR DN; Ama OE) partially rescues the decrease of myoblast number of UAS-HtlDN; UAS-mCherryRNAi (FGFR DN) expression. Co-expression of UAS-Ama and UAS-StyRNAi (Sty KD; Ama OE) together enhances the phenotype of UAS-StyRNAi (Sty KD). In all graphs, error bars represent SD; *p < 0.05, **p < 0.01, ***p < 0.001, and ****p < 0.0001, ns: not significant, (Mann–Whitney test). n = number of discs (S2 Data). Scale bars = 50 μm.
Fig 5
Fig 5. Myoblast positioning and tendon morphogenesis require Ama and Nrt.
(A–C) Confocal optical sections of 5 h APF leg disc immunostained for Twi from (A) R79D08-lexA>lexAop-mCD8::GFP; R15B04-Gal4>UAS-mCherryRNAi, from (B) R79D08-lexA>lexAop-mCD8::GFP; R15B04-Gal4>UAS-AmaRNAi and from (C) R79D08-lexA>lexAop-mCD8::GFP; Nrt1/Nrt2 transheterozygous. (A’–C’) Higher magnifications of the dorsal femur regions from (A), (B), and (C), respectively. (A, A’) In control leg discs expressing UAS-mCherryRNAi using R15B03-Gal4 late myoblast driver, the tilt (green) has elongated within the dorsal femur cavity to form a long internal structure along which the myoblasts (magenta) are aligned. (B, B’) When UAS-AmaRNAi is expressed in the myoblasts, they lose their adhesion with the tilt; the tilt itself appears wider and shorter compared to control. (C, C’) The same observations can be made in Nrt1/Nrt2 transheterozygous leg discs, with a misdistribution of the myoblasts along the tilt and an elongation default of the tilt. (D) Dot-plot graph showing the mean distance between myoblasts and the tilt surface; each dot corresponds to the mean distance between the tilt and all the myoblasts for one disc. The average of mean distance for R79D08-lexA>lexAop-mCD8::GFP; R15B04-Gal4>UAS-AmaRNAi (Ama KD) leg discs is statistically higher compared to R79D08-lexA>lexAop-mCD8::GFP; R15B04-Gal4>UAS-mCherryRNAi (control RNAi) leg disc (p < 0.0016). This average is also higher when comparing R79D08-lexA>lexAop-mCD8::GFP; Nrt1/Nrt2 transheterozygous leg discs with both R79D08-lexA>lexAop-mCD8::GFP (+/+) (p < 0.0008) and R79D08-lexA>lexAop-mCD8::GFP; Nrt2/Nrt+ (p < 0.0201) control leg discs. (E) Graphs showing the percentage of discs for which the mean distance between the myoblasts and the tilt is higher than the average mean distance of the controls UAS-mCherryRNAi and +/+, respectively. (F) Dot-plot graph showing the volume of the tilt, each dot corresponds to one disc. No statistically significant difference is observed between the control lines and the lines expressing AmaRNAi, as well as the mutant lines for Nrt. (G) Dot-plot graph showing the lengths of the tilt, each dot corresponds to one disc. UAS-AmaRNAi (Ama KD) myoblast late expression leads to shortening of the tilt length compared to UAS-mCherryRNAi control (p < 0,0042). This shortening is also evident in transheterozygous mutants Nrt1/Nrt2 compared to wild-type Nrt homozygous (p < 0,025) and Nrt2/ Nrt+ (p < 0,011). #Tendon-specific AmaKD in R79D08-lexA>lexAop-mCD8::GFP; Sr-Gal4>UAS-AmaRNAi discs does not significantly affect either the volume or length of tendons. In all graphs, error bars represent SD; *p < 0.05, **p < 0.01, ***p < 0.001, and ****p < 0.0001, ns: not significant, Mann–Whitney test (D) and (G), Fisher’s exact test (E). n = number of discs; (S4 Data). APF, after pupae formation.

References

    1. Mattes B, Scholpp S. Emerging role of contact-mediated cell communication in tissue development and diseases. Histochem Cell Biol. 2018;150:431–442. doi: 10.1007/s00418-018-1732-3 - DOI - PMC - PubMed
    1. Becker S, Pasca G, Strumpf D, Min L, Volk T. Reciprocal signaling between Drosophila epidermal muscle attachment cells and their corresponding muscles. Development. 1997;124:2615–2622. doi: 10.1242/dev.124.13.2615 - DOI - PubMed
    1. Soler C, Daczewska M, Da Ponte JP, Dastugue B, Jagla K. Coordinated development of muscles and tendons of the Drosophila leg. Development. 2004;131:6041–6051. doi: 10.1242/dev.01527 - DOI - PubMed
    1. Soler C, Laddada L, Jagla K. Coordinated Development of Muscles and Tendon-Like Structures: Early Interactions in the Drosophila Leg. Front Physiol. 2016:7. doi: 10.3389/fphys.2016.00022 - DOI - PMC - PubMed
    1. Hasson P. “Soft” tissue patterning: Muscles and tendons of the limb take their form. Developmental Dynamics. 2011;240:1100–1107. doi: 10.1002/dvdy.22608 - DOI - PubMed

MeSH terms

Substances