. 2024 Oct 7;20(10):e1012621.
doi: 10.1371/journal.ppat.1012621. eCollection 2024 Oct.

The HSV-1 encoded CCCTC-binding factor, CTRL2, impacts the nature of viral chromatin during HSV-1 lytic infection

Affiliations

The HSV-1 encoded CCCTC-binding factor, CTRL2, impacts the nature of viral chromatin during HSV-1 lytic infection

Pankaj Singh et al. PLoS Pathog. .

Abstract

HSV-1 genomes are rapidly heterochromatinized following entry by host cells to limit viral gene expression. Efficient HSV-1 genome replication requires mechanisms that de-repress chromatin associated with the viral genome. CCCTC-binding factors, or CTCF insulators play both silencing and activating roles in cellular transcriptional regulation. Importantly, the HSV-1 genome encodes several CTCF insulators that flank IE genes, implying that individual HSV-1 encoded CTCF insulators regulate IE transcription during all stages of the HSV-1 life cycle. We previously reported that the HSV-1 encoded CTCF insulator located downstream of the LAT (CTRL2) controlled IE gene silencing during latency. To further characterize the role of this insulator during the lytic infection we leveraged a ΔCTRL2 recombinant virus to show that there was a genome replication defect that stemmed from decreased IE gene expression in fibroblasts and epithelial cells at early times following initiation of infection. Further experiments indicated that the defect in gene expression resulted from chromatin inaccessibility in the absence of the insulator. To elucidate how chromatin accessibility was altered in the absence of the CTRL2 insulator, we showed that enrichment of Alpha-thalassemia/mental retardation, X-linked chromatin remodeler (ATRX), and the histone variant H3.3, both of which are known for their roles in maintaining repressive histone markers on the HSV-1 viral genome were increased on IE regions of HSV-1. Finally, both H3K27me3 and H3K9me3 repressive histone marks remained enriched by 4 hours post infection in the absence of the CTRL2 insulator, confirming that the CTRL2 insulator is required for de-repression of IE genes of viral genomes. To our knowledge these are the first data that show that a specific CTCF insulator in the HSV-1 genome (CTRL2) regulates chromatin accessibility during the lytic infection.


Conflict of interest statement

The authors have declared that no competing interests exist.

Figures

Fig 1
Fig 1. Schematic representation of previously identified CTCF insulators in the HSV-1 genome.
Nucleotide positions map to previously reported CTCF sites. The CTRL2 insulator is located downstream from the 5’exon region of LAT (nt 120,503–120,635) [25]. Figure created with BioRender.com.
Fig 2
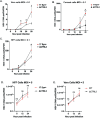
Fig 2. Multi-step growth curves identified defects in genome replication across cell types in the absence of the CTRL2 insulator.
Confluent monolayers of Vero, HFF and corneal epithelial cells were infected with either wt 17Syn+ or ΔCTRL2 at an MOI of 0.1. Cells were harvested and DNA isolated at the specified time points in each graph. Genome replication curves were determined using qPCR for HSV-1 DNA polymerase and each value was normalized to the cellular control GAPDH. A. Relative HSV-1 DNA pol values obtained in Vero cells were normalized to rhesus GAPDH. B. Relative HSV-1 DNA pol values obtained in corneal epithelial cells were normalized to human GAPDH. C. Relative HSV-1 DNA pol values obtained in HFF cells were normalized to human GAPDH. D and E. A single step growth curve was done for HFF cells and Vero cells. Cells were infected at an MOI of 5 with either the wt or mutant viruses and DNA was harvested. qPCR was done using the viral gene HSV-1 DNA pol and normalized to total ng of nucleic acid for each sample. Each timepoint represents 3 independent experiments (n = 3). *p<0.05 by student’s t-test.
Fig 3
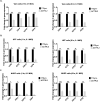
Fig 3. Gene expression is attenuated by 1 hpi in the absence of the CTRL2 insulator. Cells were infected at an MOI of 0.1 with either wt or ΔCTRL2 viruses and RNA extracted at 1 and 6 hpi.
Gene expression for representative IE and E genes were determined in epithelial cells and fibroblasts using qRT-PCR. Gene expression was quantified using primers and probes specific for the given gene regions of HSV-1 (see Table 1). All relative values for viral genes were normalized to host GAPDH expression and were plotted as fold change in expression relative to wt virus (set to 1). Each histogram represents n = 6. A. Vero cell gene expression. B. HFF cell gene expression. C. NHDF cell gene expression. *p<0.05; **p<0.005; ***p<0.0005 following student’s t-test.
Fig 4
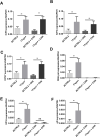
Fig 4. Gene expression was quantified at 6 hpi in Vero cells in the presence and absence of cyclohexamide (CHX).
Cells were infected at an MOI of 0.1 with either wt or ΔCTRL2 viruses and RNA extracted at 6 hpi. Gene expression for representative IE, E and L genes were determined using qRT-PCR. All relative values for viral genes were normalized to host GAPDH expression Each histogram represents n = 6. **p<0.005 following student’s t-test.
Fig 5
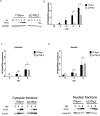
Fig 5. VP16 protein abundance is decreased at low MOI in the ΔCTRL2 recombinant virus.
A. Representative western blot is shown for VP16 protein abundance. Vero cells were infected at an MOI of 1 and total cell lysates were harvested at 0 (mock = M), 2, 3, 4 or 6 hpi. B. Quantification of protein expression was done by ImageJ using 3 biological replicates infected with wt or ΔCTRL2 the recombinant virus at MOI of 1 and band intensities were normalized to the cellular control GAPDH. C and D. VP16 protein abundance in cytosolic and nuclear fractionated samples was quantitated to show at high MOI (5) no significant differences could be detected between the wt and mutant virus through 8 hpi and VP16 localized to the nucleus in the absence of the CTRL2 insulator. Representative cytocolic and nuclear fraction western blots are shown and quantification of protein abundance was done by ImageJ using 3 biological replicates and comparing the band intensities for VP16 to β-actin in the cytosolic fractions and VP16 to Lamin B in the nuclear fractions.
Fig 6
Fig 6. VP16 and ICP4 proteins can be found in the infected cell nucleus in both wt and ΔCTRL2 recombinant virus.
Vero cells were infected with either wt or recombinant at an MOI of 5. Cells were fixed and IFF done at 5 hpi using antibodies for VP16 or ICP4. Images shown are at 20X magnification and were captured with a Zeiss Axiomager Z2 upright fluorescent microscope using ZenPro software. IFF shows that ICP4 compartmentalization and VP16 nuclear localization is indistinguishable between the two viruses. Controls for the expaeriment included mock infected cells subjected to primary and secondary antibody incubations.
Fig 7
Fig 7. RNAPII accumulation on promoters of the IE genes was attenuated in the absence of the CTRL2 insulator.
Chromatin immunoprecipitation (ChIP) assays were done using an antibody specific for RNAPII following infection. Vero cells were infected at an MOI of 1.0 with wt and ΔCTRL2 viruses (n = 5). Cells were harvested at 6 hpi and immediately crosslinked for ChIP. ChIP was performed with antibody or the IgG control. qPCR using primers listed in Table 1 were done for both antibody and IgG samples. Samples were first validated with a host control as described in the methods. The relative bound/input (B/I) ratios were normalized to IgG and are presented as fold-change relative to IgG (set to 1). A. Fold-change in enrichment for RNAPII for the ICP0 promoter. B. Fold-change in enrichment for RNAPII for the ICP4 promoter Error bars are measured for standard deviations from the mean fold change of the replicates. C. Accumulation of HCF-1 and Oct-1 on TAATGARAT sites of ICP0 and; D. ICP4 following ChIP assays (n = 5). Cells were harvested at 6 hpi ChIP was performed with each antibody or the IgG control following host control validation for HCF-1 and Oct-1. The fold-enrichments of antibody to IgG were determined for each antibody and then normalized to the fold-enrichment for wt virus (set to 1). Error bars are measured for standard deviations from the mean fold change of the replicates. *p<0.05, **p<0.005, ***p<0.0001 following students t-test.
Fig 8
Fig 8
A&C. Fold enrichment/IgG for GAPDH were used to validate each ChIP assay with either total H3 or H3.3. There was no significant difference in total H3 or H3.3 binding on the cellular control, indicating that differences in H3.3 accumulation were limited to the viral regions analyzed and not a global enrichment. B&D. Total H3 enrichment and H3.3 enrichment was determined at 1 hpi by ChIP using either total H3 or the H3.3 antibodies in Vero cells infected at an MOI of 1.0 with wt and ΔCTRL2 viruses (n = 3). The fold-enrichments of H3 to IgG were determined following qPCR. Error bars are measured for standard deviations from the mean fold enrichment/IgG of the replicates. *p<0.05 following students t-tests.
Fig 9
Fig 9
A. Fold enrichments/IgG for the LAT promoter were used to validate ChIP assays with the ATRX antibody. B. ATRX enrichment was determined at 1 hpi by ChIP in Vero cells infected at an MOI of 1.0 with wt and ΔCTRL2 viruses (n = 3). The fold-enrichments of ATRX to IgG were determined following qPCR. Relative fold-enrichments are plotted as fold-change normalized to wt virus (set to 1). Error bars are measured for standard deviations from the mean fold change in enrichment for each of the replicates. *p<0.05, **p<0.005, ***p<0.0001 following students t-test.
Fig 10
Fig 10
A. H3K27me3 enrichment was determined at 4 hpi by ChIP in Vero cells infected at an MOI of 1.0 with wt and ΔCTRL2 viruses (n = 3). B. H3K27me3 enrichment was determined at 4 hpi by ChIP with wt and ΔCTRL2 viruses in the presence of CHX (n = 3). C. H3K9me3 enrichment was determined at 4 hpi by ChIP in Vero cells infected at an MOI of 1.0 with wt and ΔCTRL2 viruses (n = 3). D. H3K9me3 enrichment was determined at 4 hpi by ChIP with wt and ΔCTRL2 viruses in the presence of CHX (n = 3). The fold-enrichments of H3K27me3 (or H3K9me3) compared to IgG were determined following qPCR. Error bars are measured for standard deviations from the mean fold enrichment/IgG of the replicates. *p<0.05 following students t-tests.
Fig 11
Fig 11. Gene expression was quantified by qRT-PCR in normal HFF cells and ATRX knock down (KD) cells.
Cells were infected at an MOI of 0.1 with either wt or ΔCTRL2 viruses and RNA extracted at 1 hpi. Gene expression for the ICP0, ICP4 and ICP27 genes were determined. Gene expression was quantified using primers and probes specific for the given gene regions of HSV-1 (see Table 1). All relative values for viral genes were normalized to host GAPDH expression and were plotted as fold change in expression relative to wt virus (set to 1). Each histogram represents n = 6. A. 17syn+ gene expression for HFF and HFF-ATRX KD cells. B. ΔCTRL2 gene expression for HFF and HFF-ATRX KD cells C and D. Comparison of expression for both wt and mutant viruses in HFF and ATRX KD cells. *p<0.05; **p<0.005; ***p<0.0005 following student’s t-test.
Fig 12
Fig 12. Fold enrichments/IgG for CTCF enrichment was determined at 4 hpi by ChIP in Vero cells infected at an MOI of 1.0 with wt and ΔCTRL2 viruses (n = 3).
The fold-enrichments of CTCF compared to IgG were determined following qPCR using primers for sequencing flanking the CTRL1 or CTa’m insulators [38]. Error bars are measured for standard deviations from the mean fold enrichment/IgG of the replicates.
Fig 13
Fig 13. Summary model for the consequences that deletion of the CTRL2 insulator has on chromatin accessibility and chromatin associated with IE promoters during the initial lytic infection of HSV-1.
Figure created with BioRender.com.

Similar articles

Cited by

References

    1. Bloom DC. Alphaherpesvirus Latency: A Dynamic State of Transcription and Reactivation. Adv Virus Res. 2016;94:53–80. Epub 2016/03/22. doi: 10.1016/bs.aivir.2015.10.001 . - DOI - PubMed
    1. Avgousti DC, Weitzman MD. Stress Flips a Chromatin Switch to Wake Up Latent Virus. Cell Host Microbe. 2015;18(6):639–41. doi: 10.1016/j.chom.2015.11.011 ; PubMed Central PMCID: PMC5862143. - DOI - PMC - PubMed
    1. Austin A, Lietman T, Rose-Nussbaumer J. Update on the Management of Infectious Keratitis. Ophthalmology. 2017;124(11):1678–89. Epub 2017/09/25. doi: 10.1016/j.ophtha.2017.05.012 ; PubMed Central PMCID: PMC5710829. - DOI - PMC - PubMed
    1. Creech CC, Neumann DM. Changes to euchromatin on LAT and ICP4 following reactivation are more prevalent in an efficiently reactivating strain of HSV-1. PLoS One. 2010;5(11):e15416. Epub 20101104. doi: 10.1371/journal.pone.0015416 ; PubMed Central PMCID: PMC2973973. - DOI - PMC - PubMed
    1. Neumann DM, Bhattacharjee PS, Giordani NV, Bloom DC, Hill JM. In vivo changes in the patterns of chromatin structure associated with the latent herpes simplex virus type 1 genome in mouse trigeminal ganglia can be detected at early times after butyrate treatment. J Virol. 2007;81(23):13248–53. Epub 20070919. doi: 10.1128/JVI.01569-07 ; PubMed Central PMCID: PMC2169074. - DOI - PMC - PubMed