. 2024 Oct 7;20(10):e1012470.
doi: 10.1371/journal.pcbi.1012470. eCollection 2024 Oct.

A flexible generative algorithm for growing in silico placentas

Affiliations

A flexible generative algorithm for growing in silico placentas

Diana C de Oliveira et al. PLoS Comput Biol. .

Abstract

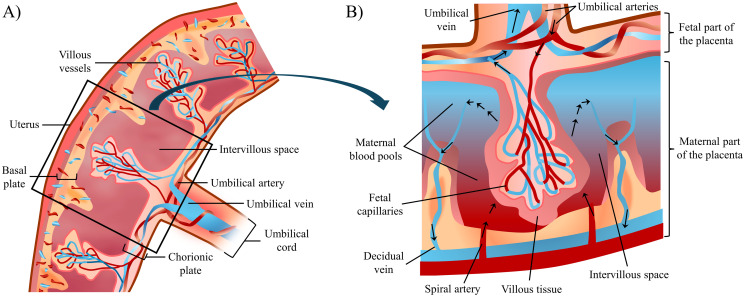
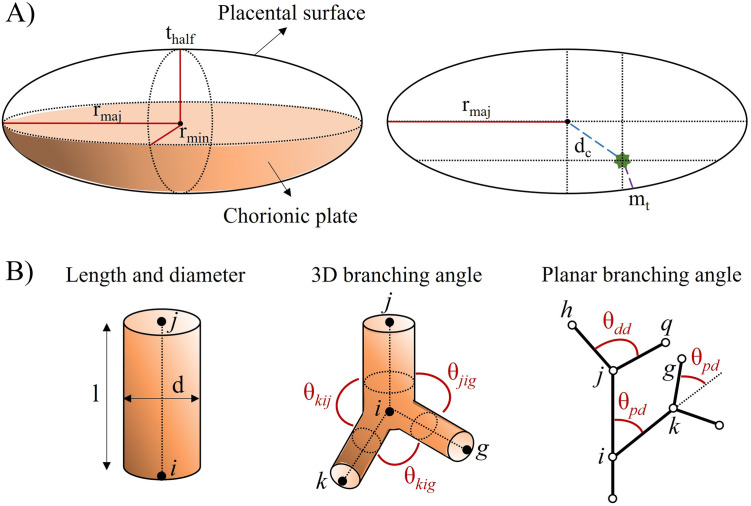
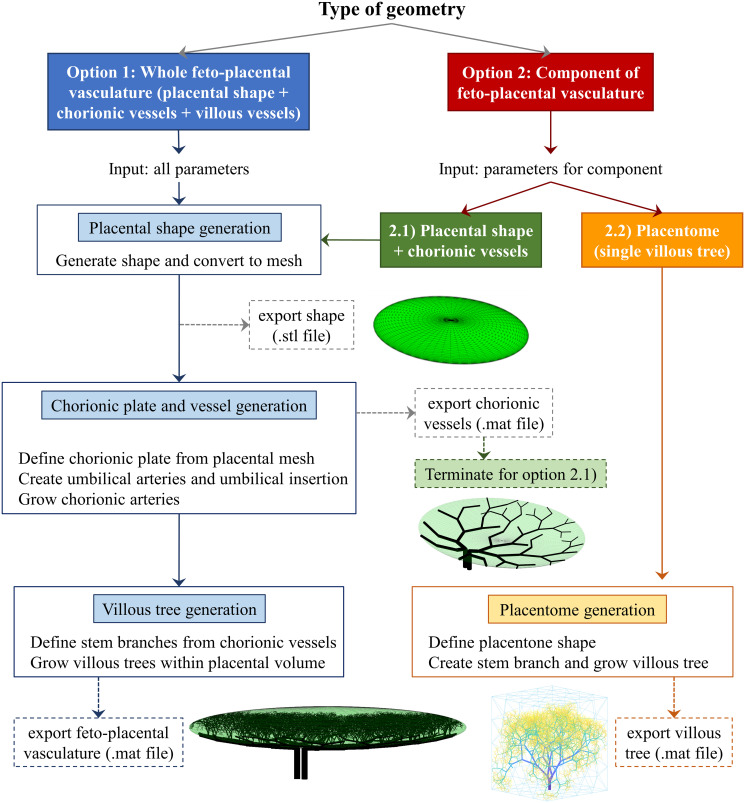
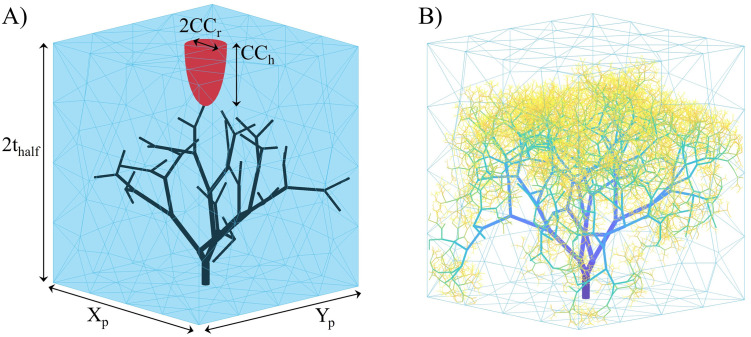
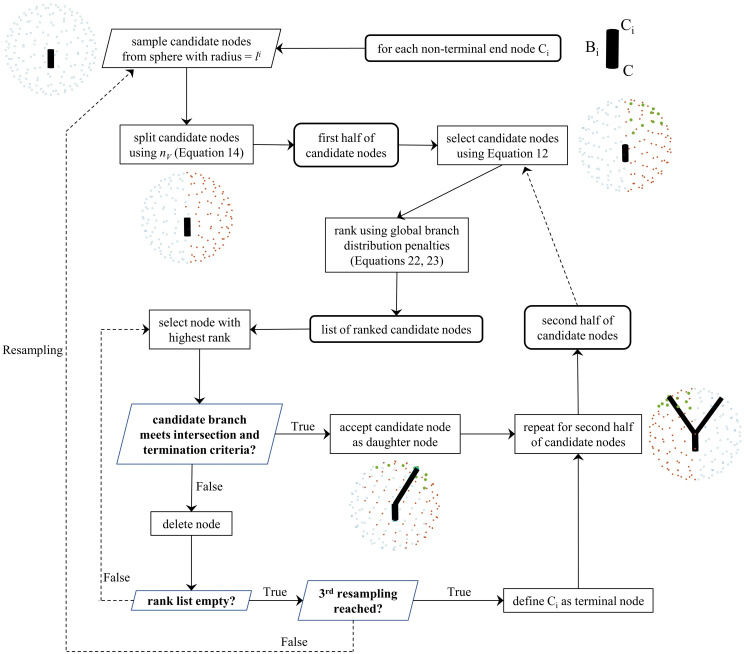
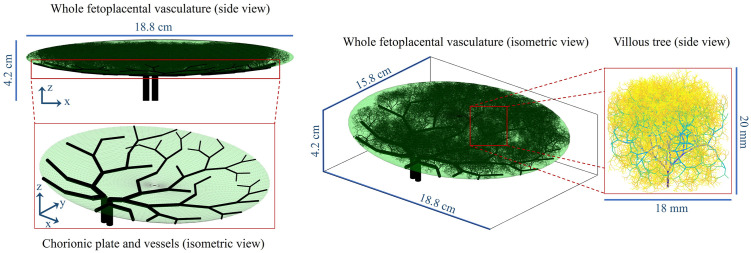
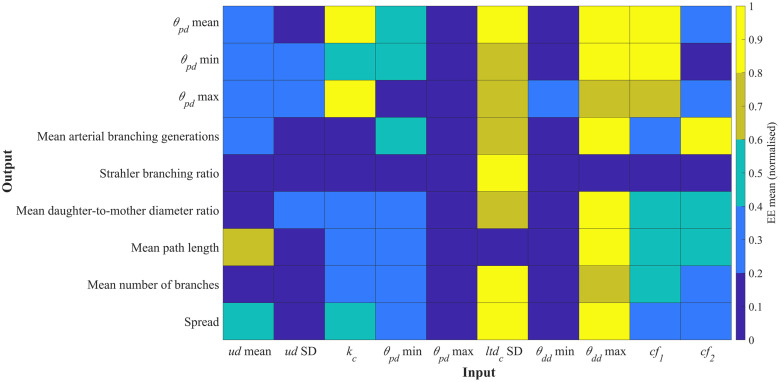
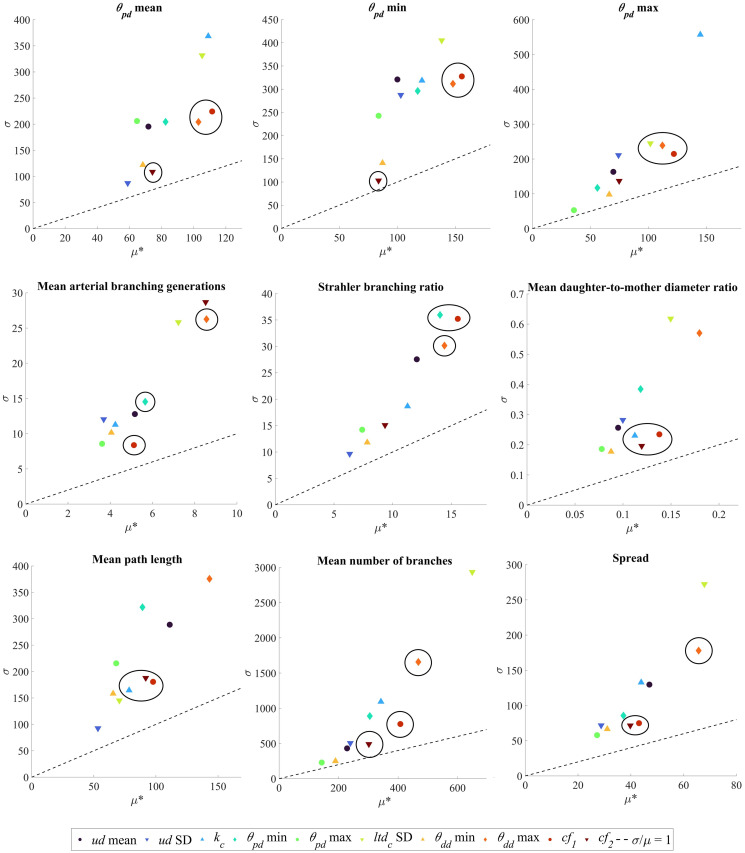
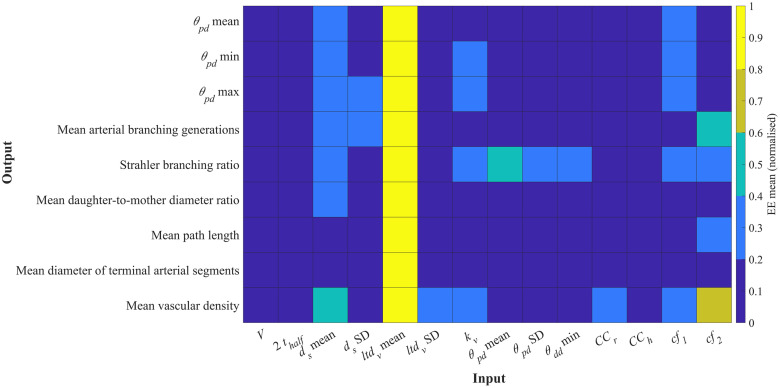
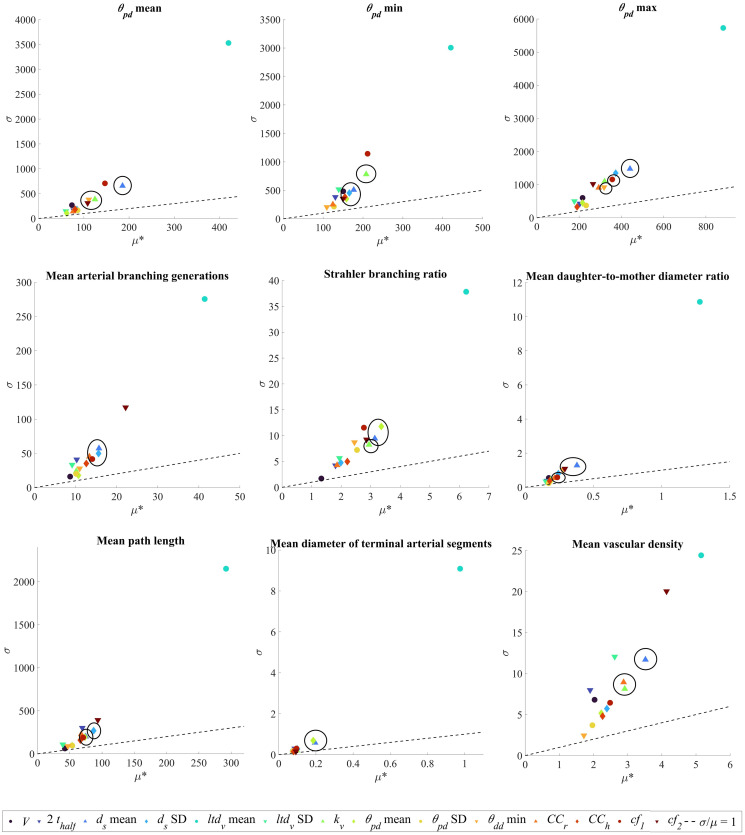
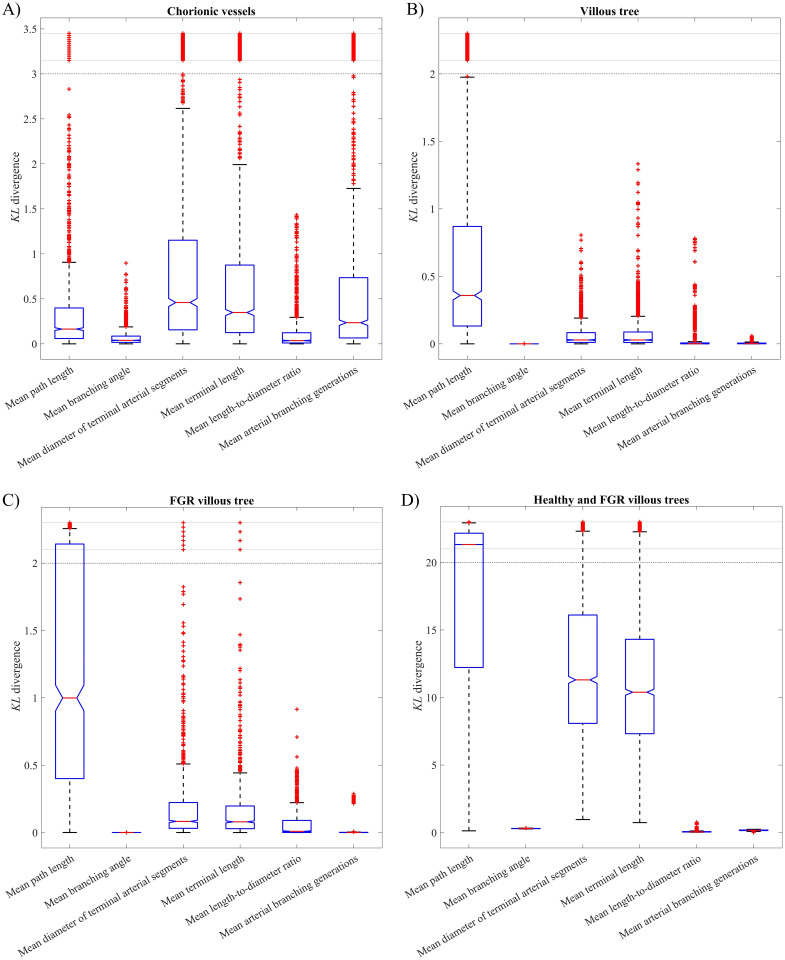
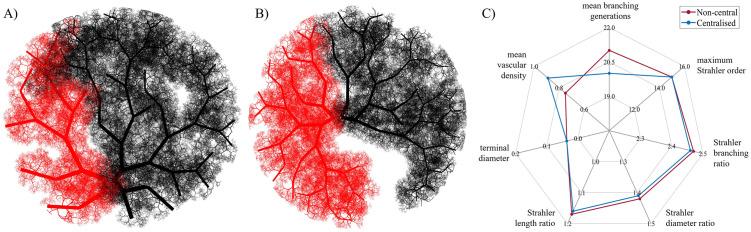
The placenta is crucial for a successful pregnancy, facilitating oxygen exchange and nutrient transport between mother and fetus. Complications like fetal growth restriction and pre-eclampsia are linked to placental vascular structure abnormalities, highlighting the need for early detection of placental health issues. Computational modelling offers insights into how vascular architecture correlates with flow and oxygenation in both healthy and dysfunctional placentas. These models use synthetic networks to represent the multiscale feto-placental vasculature, but current methods lack direct control over key morphological parameters like branching angles, essential for predicting placental dysfunction. We introduce a novel generative algorithm for creating in silico placentas, allowing user-controlled customisation of feto-placental vasculatures, both as individual components (placental shape, chorionic vessels, placentone) and as a complete structure. The algorithm is physiologically underpinned, following branching laws (i.e. Murray's Law), and is defined by four key morphometric statistics: vessel diameter, vessel length, branching angle and asymmetry. Our algorithm produces structures consistent with in vivo measurements and ex vivo observations. Our sensitivity analysis highlights how vessel length variations and branching angles play a pivotal role in defining the architecture of the placental vascular network. Moreover, our approach is stochastic in nature, yielding vascular structures with different topological metrics when imposing the same input settings. Unlike previous volume-filling algorithms, our approach allows direct control over key morphological parameters, generating vascular structures that closely resemble real vascular densities and allowing for the investigation of the impact of morphological parameters on placental function in upcoming studies.


Conflict of interest statement

The authors have declared that no competing interests exist.

Figures

Fig 1
Fig 1. Schematic representation of the placenta and feto-placental vascular structures.
(A) Placental macroscopic components and associated structures, including the chorionic and basal plates and the umbilical cord. (B) A functional lobule of the feto-placental circulation is shown in detail: exchange occurs in the IVS, most specifically in the maternal blood pools arising from the spiral arteries. Oxygenated blood enters the IVS through the spiral arteries. Deoxygenated blood from the fetal side enters the placental parenchyma through the umbilical arteries, via the villous tree up to the capillaries, where it is oxygenated before returning to the fetus in the umbilical vein. Oxygen-depleted blood then leaves the IVS through the decidual veins located in the septa between the IVS.
Fig 2
Fig 2. Schematic representation of important placental morphological parameters.
(A) Typical descriptions of chorionic surface shape and size rely on ellipsoid representations characterised by major (rmaj) and minor (rmin) radii [36, 37] and half the placenta thickness (thalf), as represented in a side view of the placental surface (left side) [20]. Other relevant parameters represented in an axial view of the chorionic plate (right side) include the position of the umbilical cord insertion in the chorionic plate (green star), determined by the distance of the insertion from the ellipsoid centre (dc) and the minimum distance between the insertion and the periphery of the chorionic plate (mt) [36]. (B) Blood vessels are typically characterised by length (l) and diameter (d) (left side) and 3D branching angles (θ) (middle) [20, 21]. Planar branching angles are defined upon vessel branching properties (right side): The parent-daughter branching angle of a certain segment is defined as the angle of a daughter segment from its parent’s axis (e.g. θpd), while the daughter-daughter branching angle is represented as the angle between two daughter segments (e.g. θdd).
Fig 3
Fig 3. User options and main steps of the generative algorithm.
Fig 4
Fig 4. Placentone representation.
(A) Main placentone dimensions are identified, including those for the central cavity, and a fetal tree with five branching generations is showcased for clarity. (B) A fetal tree branched up to 14 generations is displayed. Key: 2thalf, placental thickness; Xp, x-direction length; Yp, y-direction length; CCr, central cavity radius; CCh, central cavity height.
Fig 5
Fig 5. Schematic showcasing main steps involved in the generation of a new daughter node Ci and subsequently a new branch Bi.
Key: li, candidate branch length; nv, unit normal of plane defined by Eq 14.
Fig 6
Fig 6. Example of feto-placental vasculature generated in the case of a non-central umbilical cord insertion.
Figure components are depicted in isometric (xyz coordinate system) and side (xz plane) views.
Fig 7
Fig 7. Heatmap results from the global sensitivity analysis for the generation of chorionic vessels.
Mean (μ*) values of the elementary effects (EE) associated with different output metrics were obtained for an input space with 70 samples per input parameter (input settings from Table 1. μ* are normalised for direct comparison between EEs, and higher μ* values are associated with increased influence of a certain input over a certain output. Key: ud, umbilical artery diameter; kc, chorionic Murray’s Law bifurcation exponent; θpd, parent-daughter branching angle; ltdc, chorionic length-to-diameter ratio; θdd, daughter-to-daughter branching angle; cf1, cf2, global distribution penalty weights.
Fig 8
Fig 8. Elementary effects (EE) results for chorionic vessel generation employing the input parameter ranges from Table 1.
Input parameters are listed and color-coded at the end of the Figure. Each subplot corresponds to one output metric indicated by subplot titles. For each output metric, the standard deviation (σ) associated with the EE of a certain input parameter is plotted in function of the respective mean (μ*). The σ/μ ratio is shown by dotted lines in all plots. Clusters of highly influential input parameters, as determined by Eq 18, are circled in black. Key: ud, umbilical artery diameter; kc, chorionic Murray’s Law bifurcation exponent; θpd, parent-daughter branching angle; ltdc, chorionic length-to-diameter ratio; θdd, daughter-to-daughter branching angle; cf1, cf2, global distribution penalty weights.
Fig 9
Fig 9. Heatmap results from the global sensitivity analysis for the generation of villous vessels within a placentone.
Mean (μ*) values of the elementary effects (EE) associated with different output metrics were obtained for an input space with 100 samples per input parameter (input settings from Table 1). μ* are normalised for direct comparison between EEs, and higher μ* values are associated with increased influence of a certain input over a certain output. Key: V, placental volume; 2thalf, placental thickness; ds, stem diameter; ltdv, villous length-to-diameter ratio; kv, villous Murray’s Law bifurcation exponent; θpd, parent-daughter branching angle; θdd, daughter-to-daughter branching angle; CCr, central cavity radius; CCh, central cavity height; cf1, cf2, global distribution penalty weights.
Fig 10
Fig 10. Elementary effects (EE) results for the generation of villous vessels within a placentone employing the input parameter ranges from Table 1.
Input parameters are listed and color-coded at the end of the Figure. Each subplot corresponds to one output metric indicated by subplot titles. For each output metric, the standard deviation (σ) associated with the EE of a certain input parameter is plotted in function of the respective mean (μ*). The σ/μ ratio is shown by dotted lines in all plots. Clusters of highly influential input parameters, as determined by Eq 18, are circled in black. Key: V, placental volume; 2thalf, placental thickness; ds, stem diameter; ltdv, villous length-to-diameter ratio; kv, villous Murray’s Law bifurcation exponent; θpd, parent-daughter branching angle; θdd, daughter-to-daughter branching angle; CCr, central cavity radius; CCh, central cavity height; cf1, cf2, global distribution penalty weights.
Fig 11
Fig 11. Boxplots displaying KL divergence results, indicating variability of key topological metrics obtained after multiple algorithm runs for the generation of chorionic vessels (A) and villous vessels (B-D).
Each output metric is modeled as a Gaussian distribution, and Eq 24 calculates the KL divergence between pairs of Gaussians from the output space. With 50 algorithm runs, this results in 1225 Gaussian combinations and KL divergence values per output metric, represented for (A) chorionic vessels, (B) healthy villous vessels, and (C) FGR-associated villous vessels. (D) A similar analysis using 50 healthy and 50 FGR fetal trees was conducted, focusing on healthy-dysfunctional output metric pairs to derive the KL divergence.
Fig 12
Fig 12. Feto-placental vasculatures with non-central (A) and centralised (B) umbilical artery insertion.
Red (left vasculature) and black (right vasculature) represent vessels fed by each umbilical artery. A comparison of mean key vessel topological metrics is also displayed (C).
Fig 13
Fig 13. Vascular density computed for feto-placental vasculatures at an isotropic voxel size of 116.5 μm.
Isosurface maps of nodal density and mean vascular maps are displayed for non-central (A,B) and centralised (C,D) umbilical cord insertion, respectively.
Fig 14
Fig 14. Comparison of key mean topological metrics for three distinct placentones.
Metrics obtained for a healthy fetal tree, a fetal tree obtained with spiral artery mega jet and a fetal tree associated with fetal growth restriction are represented.
Fig 15
Fig 15. Placentone fetal trees of up to 15 branching generations, created for three distinct topological cases.
Top row: path length (mm) for a healthy fetal tree, a tree in the presence of a spiral artery mega jet, and a tree in the presence of fetal growth restriction. Bottom row: axial slices of nodal density for all three fetal trees.

Similar articles

References

    1. Barker DJP. The origins of the developmental origins theory. J Intern Med. 2007;261(5): 412–417. doi: 10.1111/j.1365-2796.2007.01809.x - DOI - PubMed
    1. Thornburg KL, Marshall N. The placenta is the center of the chronic disease universe. AJOG. 2015;213(4): S14–S20. doi: 10.1016/j.ajog.2015.08.030 - DOI - PMC - PubMed
    1. Saghian R, James JL, Tawhai MH, Collins SL, Clark AR. Association of placental jets and mega-jets with reduced villous density. J Biomech Eng. 2017;139(5): 051001. doi: 10.1115/1.4036145 - DOI - PMC - PubMed
    1. Hutter J, Harteveld AA, Jackson LH, Franklin S, Bos C, van Osch MJP, et al.. Perfusion and apparent oxygenation in the human placenta (PERFOX). Magn Reson Med. 2019;83: 549–560. doi: 10.1002/mrm.27950 - DOI - PMC - PubMed
    1. Chernyavsky IL, Jensen OE, Leach L. A mathematical model of intervillous blood flow in the human placentone. Placenta. 2010;31(1): 44–52. doi: 10.1016/j.placenta.2009.11.003 - DOI - PubMed

LinkOut - more resources