Reverse-engineered models reveal differential membrane properties of autonomic and cutaneous unmyelinated fibers
- PMID: 39374306
- PMCID: PMC11486378
- DOI: 10.1371/journal.pcbi.1012475
Reverse-engineered models reveal differential membrane properties of autonomic and cutaneous unmyelinated fibers
Abstract
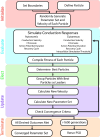
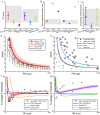
Unmyelinated C-fibers constitute the vast majority of axons in peripheral nerves and play key roles in homeostasis and signaling pain. However, little is known about their ion channel expression, which controls their firing properties. Also, because of their small diameters (~ 1 μm), it has not been possible to characterize their membrane properties using voltage clamp. We developed a novel library of isoform-specific ion channel models to serve as the basis functions of our C-fiber models. We then developed a particle swarm optimization (PSO) framework that used the isoform-specific ion channel models to reverse engineer C-fiber membrane properties from measured autonomic and cutaneous C-fiber conduction responses. Our C-fiber models reproduced experimental conduction velocity, chronaxie, action potential duration, intracellular threshold, and paired pulse recovery cycle. The models also matched experimental activity-dependent slowing, a property not included in model optimization. We found that simple conduction responses, characterizing the action potential, were controlled by similar membrane properties in both the autonomic and cutaneous C-fiber models, but complicated conduction response, characterizing the afterpotenials, were controlled by differential membrane properties. The unmyelinated C-fiber models constitute important tools to study autonomic signaling, assess the mechanisms of pain, and design bioelectronic devices. Additionally, the novel reverse engineering approach can be applied to generate models of other neurons where voltage clamp data are not available.
Copyright: © 2024 Thio et al. This is an open access article distributed under the terms of the Creative Commons Attribution License, which permits unrestricted use, distribution, and reproduction in any medium, provided the original author and source are credited.
Conflict of interest statement
The authors have declared that no competing interests exist.
Figures


Similar articles
-
Excitation properties of computational models of unmyelinated peripheral axons.J Neurophysiol. 2021 Jan 1;125(1):86-104. doi: 10.1152/jn.00315.2020. Epub 2020 Oct 21. J Neurophysiol. 2021. PMID: 33085556 Free PMC article.
-
Sodium Channel Nav1.8 Underlies TTX-Resistant Axonal Action Potential Conduction in Somatosensory C-Fibers of Distal Cutaneous Nerves.J Neurosci. 2017 May 17;37(20):5204-5214. doi: 10.1523/JNEUROSCI.3799-16.2017. Epub 2017 Apr 27. J Neurosci. 2017. PMID: 28450535 Free PMC article.
-
Conduction failures in rabbit saphenous nerve unmyelinated fibers.Neurosignals. 2009;17(3):181-95. doi: 10.1159/000209279. Epub 2009 Mar 19. Neurosignals. 2009. PMID: 19295243
-
Differential distribution of voltage-gated channels in myelinated and unmyelinated baroreceptor afferents.Auton Neurosci. 2012 Dec 24;172(1-2):4-12. doi: 10.1016/j.autneu.2012.10.014. Epub 2012 Nov 10. Auton Neurosci. 2012. PMID: 23146622 Review.
-
Age related changes in human C-fiber function.Neurosci Lett. 2010 Feb 19;470(3):185-7. doi: 10.1016/j.neulet.2009.07.023. Epub 2009 Jul 14. Neurosci Lett. 2010. PMID: 19607877 Review. No abstract available.
Cited by
-
Ramped kilohertz-frequency signals produce nerve conduction block without onset response.J Neural Eng. 2025 May 8;22(3):10.1088/1741-2552/add20e. doi: 10.1088/1741-2552/add20e. J Neural Eng. 2025. PMID: 40300613
References
-
- Obreja O, Ringkamp M, Namer B, Forsch E, Klusch A, Rukwied R, et al.. Patterns of activity-dependent conduction velocity changes differentiate classes of unmyelinated mechano-insensitive afferents including cold nociceptors, in pig and in human. Pain. 2010;148(1):59–69. doi: 10.1016/j.pain.2009.10.006 - DOI - PubMed
-
- Dib-Hajj SD, Black JA, Waxman SG. NaV1.9: a sodium channel linked to human pain. Nat Rev Neurosci. 2015;16(9):511–9. - PubMed
MeSH terms
Substances
Grants and funding
LinkOut - more resources
Full Text Sources

