. 2024 Oct 15;121(42):e2409636121.
doi: 10.1073/pnas.2409636121. Epub 2024 Oct 7.

Neurotransmitter release is triggered by a calcium-induced rearrangement in the Synaptotagmin-1/SNARE complex primary interface

Affiliations

Neurotransmitter release is triggered by a calcium-induced rearrangement in the Synaptotagmin-1/SNARE complex primary interface

Estelle Toulmé et al. Proc Natl Acad Sci U S A. .

Abstract

The Ca2+ sensor synaptotagmin-1 (Syt1) triggers neurotransmitter release together with the neuronal sensitive factor attachment protein receptor (SNARE) complex formed by syntaxin-1, SNAP25, and synaptobrevin. Moreover, Syt1 increases synaptic vesicle (SV) priming and impairs spontaneous vesicle release. The Syt1 C2B domain binds to the SNARE complex through a primary interface via two regions (I and II), but how exactly this interface mediates distinct functions of Syt1 and the mechanism underlying Ca2+ triggering of release are unknown. Using mutagenesis and electrophysiological experiments, we show that region II is functionally and spatially subdivided: Binding of C2B domain arginines to SNAP-25 acidic residues at one face of region II is crucial for Ca2+-evoked release but not for vesicle priming or clamping of spontaneous release, whereas other SNAP-25 and syntaxin-1 acidic residues at the other face mediate priming and clamping of spontaneous release but not evoked release. Mutations that disrupt region I impair the priming and clamping functions of Syt1 while, strikingly, mutations that enhance binding through this region increase vesicle priming and clamping of spontaneous release, but strongly inhibit evoked release and vesicle fusogenicity. These results support previous findings that the primary interface mediates the functions of Syt1 in vesicle priming and clamping of spontaneous release and, importantly, show that Ca2+ triggering of release requires a rearrangement of the primary interface involving dissociation of region I, while region II remains bound. Together with biophysical studies presented in [K. Jaczynska et al., bioRxiv [Preprint] (2024). https://doi.org/10.1101/2024.06.17.599417 (Accessed 18 June 2024)], our data suggest a model whereby this rearrangement pulls the SNARE complex to facilitate fast SV fusion.

Keywords: SNAREs; neurotransmitter release; structure–function analysis; synaptic vesicle fusion; synaptotagmin.


Conflict of interest statement

Competing interests statement:The authors declare no competing interest.

Figures
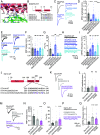
Fig. 1.
Fig. 1.
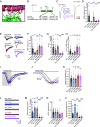
Syntaxin 1 and SNAP25 residues of the region II Syt1–SNARE complex interface mediate distinct pre-Ca2+ and post-Ca2+ functions. (A) Molecular graphics of the Syt1–SNARE complex interaction from PDB accession code 5CCH (15). Proteins are represented by ribbon diagrams and ball and stick models. Carbons are represented in salmon color (SNAP25), pink (Synaptobrevin 2), fuchsia (Syntaxin1-A), or yellow (Syt1). Region I residues are color-coded in dark green, region II residues in blue, and residues from the hydrophobic patch in gray. (B) Schematics of SNAP25 mutations utilized. (C) Example traces and (D) quantification of the EPSC amplitude recorded for autaptic hippocampal neurons obtained from rescue experiments with SNAP25-WT, SNAP25-D51N, E52Q, E55Q, or D51N/E52Q. (E) Example traces and (F) quantification of the RRP charge induced by 500 mM sucrose application obtained from the same neurons as in C. (G) Quantification of the vesicle release probability (Pvr). (H) Example traces and (I) quantification of the miniature EPSC frequency (mEPSC) obtained from the same neurons as in C. (J) Schematics of Stx1A mutations utilized. (K) Example traces and (L) quantification of the EPSC amplitude recorded for autaptic hippocampal neurons obtained from rescue experiments with Stx1A-WT, Stx1A-E228Q/D231N, and Stx1A-D231N/E234Q/E238Q. (M) Example traces and (N) quantification of the RRP induced by 500 mM sucrose application obtained from the same neurons as in K. (O) quantification of the vesicle release probability (Pvr). (P) Example traces and (Q) quantification of the mEPSC frequency obtained from the same neurons as in K. Each data point represents a single recorded neuron. Between 35 and 39 neurons per group from three independent cultures were recorded and are shown as mean ± SEM. EPSC amplitude, RRP charge, and mEPSC frequency were normalized per culture to the corresponding WT-rescue (either SNAP25-WT or Stx1A-WT) and subsequently pooled. ns: not significant, *P < 0.05, **P < 0.01, ***P < 0.001, and ****P < 0.0001.
Fig. 2.
Fig. 2.
Region II Syt1 R398Q, R399Q mutants show distinct and overlapping roles in pre-Ca2+ and post-Ca2+ functions of Syt1. (A) Close-up view of region II of the primary interface. Proteins are represented by ribbon diagrams and stick models with nitrogen atoms in dark blue, oxygen in red, sulfur in yellow orange, and carbon in salmon color (SNARE complex) or green (Syt1 C2B domain). Selected residues are labeled. (B) Schematics of Synaptotagmin1 (Syt1) mutations utilized. (C) Example traces and (D) quantification of the EPSC amplitude recorded for Syt1/7 DKO autaptic hippocampal neurons rescued with Syt1 WT, Syt1 R398Q, Syt1 R399Q, or Syt1 R398Q/R399Q. (E) Example traces and (F) quantification of the RRP charge induced by 500 mM sucrose application obtained from the same neurons as in C. (G) Quantification of the vesicle release probability (Pvr). (H) Example traces and (I) quantification of the mEPSC frequency obtained from the same neurons as in C. Each data point represents a single recorded neuron. EPSC amplitude, RRP charge, and mEPSC frequency were normalized per culture to Syt1 rescue and subsequently pooled. Between 39 and 42 neurons per group from three independent cultures were recorded and are shown as mean ± SEM. ns: not significant, *P < 0.05, **P < 0.01, ***P < 0.001, and ****P < 0.0001.
Fig. 3.
Fig. 3.
Region II Syt1 R281, R288 mutant analysis shows selective loss of post-Ca2+ function of Syt1. (A) Close-up view of region II of the primary interface. Proteins are represented by ribbon diagrams and stick models with nitrogen atoms in dark blue, oxygen in red, sulfur in yellow orange, and carbon in salmon color (SNARE complex) or green (Syt1 C2B domain). Selected residues are labeled. (B) Schematics of Synaptotagmin1 (Syt1) mutations utilized. (C) Example traces and (D) quantification of the EPSC amplitude recorded for Syt1/7 DKO autaptic hippocampal neurons rescued with Syt1 WT, Syt1 R281A, Syt1 K288A, or Syt1 R281A/K288A. (E) Example traces and (F) quantification of the RRP charge induced by 500 mM sucrose application obtained from the same neurons as in C. (G) Quantification of the vesicle release probability (Pvr). (H) Example traces and (I) quantification of the mEPSC frequency obtained from the same neurons as in C. Each data point represents a single recorded neuron. EPSC amplitude, RRP charge, and mEPSC frequency were normalized per culture to Syt1 rescue and subsequently pooled. Between 44 and 45 neurons per group from three independent cultures were recorded and are shown as mean ± SEM. ns: not significant, *P < 0.05, **P < 0.01, ***P < 0.001, and ****P < 0.0001.
Fig. 4.
Fig. 4.
Region I Syt1 Y338D and A402T mutants display loss of pre-Ca2+ and post-Ca2+ functions of Syt1. (A) Close-up view of region I and region II of the primary interface. Proteins are represented by ribbon diagrams and stick models with nitrogen atoms in dark blue, oxygen in red, sulfur in yellow orange, and carbon in salmon color (SNARE complex) or green (Syt1 C2B domain). Selected residues are labeled. (B) Schematics of Synaptotagmin1 (Syt1) mutations utilized. (C) Example traces and (D) quantification of the EPSC amplitude recorded for Syt1/7 DKO autaptic hippocampal neurons rescued with Syt1 WT, Syt1 Y338D, Syt1 A402T, and Syt1 Y338D/A402T mutants. (E) Example traces and (F) quantification of the RRP charge induced by 500 mM sucrose application obtained from the same neurons as in C. (G) Quantification of the vesicle release probability (Pvr). (H) Example traces and (I) quantification of the mEPSC frequency obtained from the same neurons as in C. Each data point represents a single recorded neuron. EPSC amplitude, RRP charge, and mEPSC frequency were normalized per culture to Syt1 rescue and subsequently pooled. Between 41 and 45 neurons per group from three independent cultures were recorded and are shown as mean ± SEM. ns: not significant, *P < 0.05, **P < 0.01, ***P < 0.001, and ****P < 0.0001.
Fig. 5.
Fig. 5.
Region I Syt1 mutant E295A stabilizes the primed state and impairs Ca2+-triggered release. (A) Close-up view of region I of the primary interface. Proteins are represented by ribbon diagrams and stick models with nitrogen atoms in dark blue, oxygen in red, sulfur in yellow orange, and carbon in salmon color (SNARE complex) or green (Syt1 C2B domain). Selected residues are labeled. (B) Schematics of Synaptotagmin1 (Syt1) mutations utilized. (C) Example traces and (D) quantification of the EPSC amplitude recorded for Syt1/7 DKO autaptic hippocampal neurons rescued with Syt1 WT, Syt1 Y338W, Syt1 E295A, and Syt1 E295A/Y338W mutants. (E) Example traces and (F) quantification of the RRP charge induced by 500 mM sucrose application obtained from the same neurons as in C. (G) Quantification of the vesicle release probability (Pvr). (H) Quantification of the number of SV in the RRP. (I) Average traces and (J) close-up view of synaptic responses induced by an application of 500 mM sucrose for Syt1 WT (n = 65), Syt1/7 DKO (n = 26), Syt1 Y338W (n = 32), Syt1 E295A (n = 35), and Syt1 E295A/Y338W (n = 38) mutants. (K) Quantification of the response onset latency normalized to Syt1 rescue. (L) Example traces and quantification of the mEPSC frequency (M), amplitude (N), and the spontaneous release rate as a ratio of mEPSC frequency and the number of SV in the RRP (O) obtained from the same neurons as in C. Each data point represents a single recorded neuron. EPSC amplitude, RRP charge, and mEPSC frequency were normalized per culture to Syt1 rescue and subsequently pooled. Between 46 to 92 neurons per group from three independent cultures were recorded and are shown as mean ± SEM. ns: not significant, *P < 0.05, **P < 0.01, ***P < 0.001, and ****P < 0.0001.
Fig. 6.
Fig. 6.
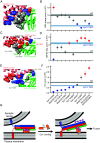
Summary of primary interface mutational phenotypes and a putative model of Syt1-mediated Ca2+-triggered SV fusion. (A) Map of residues that (B) modulate priming function. (C) Map of residues that (D) modulate spontaneous fusion clamping function. (E) Map of residues that modulate (F) Ca2+-triggered release probability. In A, C, and E, molecular graphics of the C2B domain–SNARE complex interaction from PDB accession code 5CCH (15). Proteins are represented by ribbon diagrams and sphere models. Carbons are represented in salmon color (SNARE complex) or green (Syt1 C2B domain). Selected residues are labeled in red if they show a significantly increased response compared to WT rescue, gray if they are not significantly different from WT rescue, and blue if they are significantly decreased compared to their respective WT rescue protein. In B, D, and F, residues are labeled in red if they show a significantly increased response compared to WT rescue, gray if they are not significantly different from WT rescue, and blue if they are significantly decreased compared to their respective WT rescue protein. The black dotted line represents WT rescue whereas the dark blue dotted line symbolizes the result for Syt1/Syt7 DKO response. (G) Model of how Syt1 triggers neurotransmitter release. In the primed, fusion-clamped state of the release apparatus, the Syt1 C2B domain (orange) binds to the SNARE complex through the primary interface and to the plasma membrane through a polybasic region. Regions I and II are represented schematically with pink diamond shape forms. Binding of Ca2+ (blue circles) induces reorientation of the C2B domain to allow insertion of both Ca2+ binding loops into the plasma membrane and coordination of the Ca2+ ions by the C2B domain ligands and phospholipid head groups. Because of the reorientation, region I dissociates, but region II remains in contact, which in turn communicates a “rowing force” from the Syt C2B reorientation onto the SNARE complex that facilitates extension of the synaptobrevin and syntaxin-1 helices into the jxt linkers, which leads to fast membrane fusion.

Update of

References

    1. Sudhof T. C., Neurotransmitter release: The last millisecond in the life of a synaptic vesicle. Neuron 80, 675–690 (2013). - PMC - PubMed
    1. Sutton R. B., Fasshauer D., Jahn R., Brunger A. T., Crystal structure of a SNARE complex involved in synaptic exocytosis at 2.4 A resolution. Nature 395, 347–353 (1998). - PubMed
    1. Zhou P., Bacaj T., Yang X., Pang Z. P., Sudhof T. C., Lipid-anchored SNAREs lacking transmembrane regions fully support membrane fusion during neurotransmitter release. Neuron 80, 470–483 (2013). - PMC - PubMed
    1. Hu Y., Zhu L., Ma C., Structural roles for the juxtamembrane linker region and transmembrane region of synaptobrevin 2 in membrane fusion. Front. Cell Dev. Biol. 8, 609708 (2020). - PMC - PubMed
    1. Vardar G., Salazar-Lazaro A., Zobel S., Trimbuch T., Rosenmund C., Syntaxin-1A modulates vesicle fusion in mammalian neurons via juxtamembrane domain dependent palmitoylation of its transmembrane domain. Elife 11, e78182 (2022). - PMC - PubMed

LinkOut - more resources