. 2025 Jan 28;9(2):291-309.
doi: 10.1182/bloodadvances.2024014046.

Maintenance of hematopoietic stem cells by tyrosine-unphosphorylated STAT5 and JAK inhibition

Affiliations

Maintenance of hematopoietic stem cells by tyrosine-unphosphorylated STAT5 and JAK inhibition

Matthew J Williams et al. Blood Adv. .

Abstract

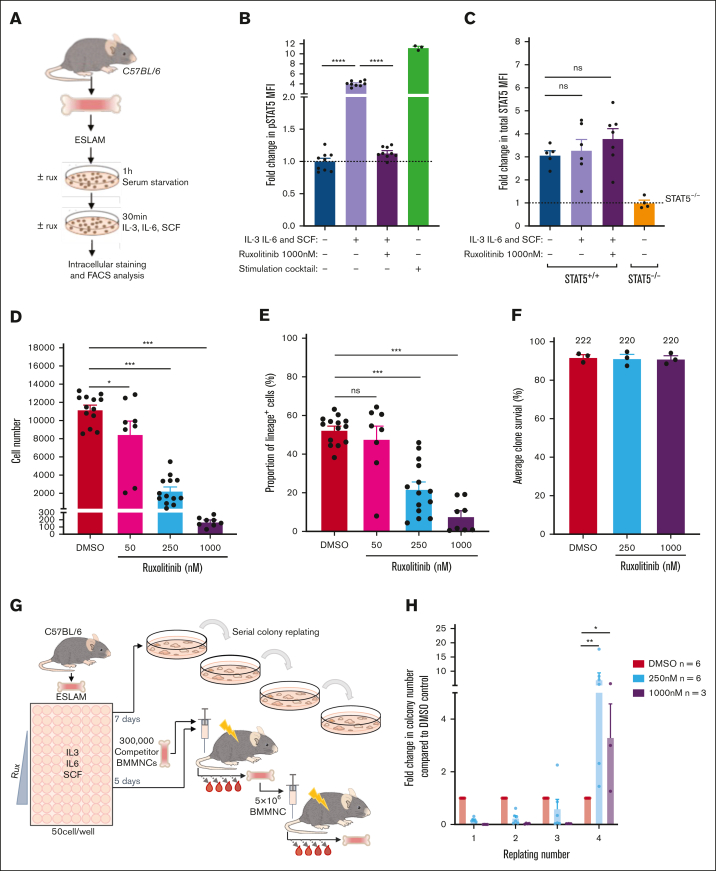
Adult hematopoietic stem cells (HSCs) are responsible for the lifelong production of blood and immune cells, a process regulated by extracellular cues, including cytokines. Many cytokines signal through the conserved Janus kinase (JAK)/signal transducer and activator of transcription (STAT) pathway in which tyrosine-phosphorylated STATs (pSTATs) function as transcription factors. STAT5 is a pivotal downstream mediator of several cytokines known to regulate hematopoiesis, but its function in the HSC compartment remains poorly understood. In this study, we show that STAT5-deficient HSCs exhibit an unusual phenotype, including reduced multilineage repopulation and self-renewal, combined with reduced exit from quiescence and increased differentiation. This was driven not only by the loss of canonical pSTAT5 signaling, but also by the loss of distinct transcriptional functions mediated by STAT5 that lack canonical tyrosine phosphorylation (uSTAT5). Consistent with this concept, expression of an unphosphorylatable STAT5 mutant constrained wild-type HSC differentiation, promoted their maintenance, and upregulated transcriptional programs associated with quiescence and stemness. The JAK1/2 inhibitor, ruxolitinib, which increased the uSTAT5:pSTAT5 ratio, had similar effects on murine HSC function; it constrained HSC differentiation and proliferation, promoted HSC maintenance, and upregulated transcriptional programs associated with stemness. Ruxolitinib also enhanced serial replating of normal human hematopoietic stem and progenitor cells (HSPCs), calreticulin-mutant murine HSCs, and HSPCs obtained from patients with myelofibrosis. Our results therefore reveal a previously unrecognized interplay between pSTAT5 and uSTAT5 in the control of HSC function and highlight JAK inhibition as a potential strategy for enhancing HSC function during ex vivo culture. Increased levels of uSTAT5 may also contribute to the failure of JAK inhibitors to eradicate myeloproliferative neoplasms.


Conflict of interest statement

Conflict-of-interest disclosure: A.R.G. and J.L. report serving as consultants for Incyte. E.L. reports receiving research funds from GlaxoSmithKline and Commonwealth Serum Laboratories Behring. The remaining authors declare no competing financial interests.

Figures

None
Graphical abstract
Figure 1.
Figure 1.
STAT5 loss leads to defective HSC function. (A) Bar plot showing the frequency of ESLAM HSCs (CD45+CD150+CD48EPCR+) in BMMNCs from WT and STAT5-deficient mice (mean ± standard error of the mean [SEM]). (B) Bar plot showing the frequency of LT-HSCs (LinSca1cKit+CD150+CD48CD34Flk2) in BMMNCs (mean ± SEM). (C) Bar plot showing the frequency of B cells (B220+) in BMMNCs (mean ± SEM). (D) Bar plot showing the frequency of CFU-e progenitors (LinSca1cKit+CD41CD16/32CD105+CD150) in BMMNCs (mean ± SEM). (E) Bar plots showing the frequency of CFU-e and pre–CFU-e (LinSca1cKit+CD41CD16/32CD105+CD150+) cells in spleen mononuclear cells (mean ± SEM). (F) Bar plots (left) showing the frequency of megakaryocyte (CD41+CD42+) and erythroid precursor cells (I, CD71hiTer119mid; II, CD71hiTer119hi; III, CD71midTer119hi; IV, CD71lowTer119hi) in spleen mononuclear cells (mean ± SEM) with a representative flow-cytometry plot (right) showing the gating of different stages of erythroid precursor cells in terminal differentiation. (G) Schematic diagram showing that 33 fluorescence-activated cell sorting–purified BM ESLAM HSCs were transplanted into irradiated recipient mice with 5 × 105 competitor BMMNCs. STAT5 was deleted in Cre+ donor cells after transplantation by repeated injection (×7) with Poly:IC in recipients. Blood was taken before and after STAT5 deletion and was followed for 5 months after deletion before serial transplantation of 3 × 106 primary recipient BMMNCs. (H) Connected line graphs showing donor chimerism in peripheral blood mononuclear cells at each time point in primary and secondary recipients (mean ± SEM). The dotted line indicates initiation of the Poly:IC injections. The asterisks indicate significant differences by analysis of variance column factor (∗∗∗∗P < .0001). (I) Bar plots showing the total BMMNC donor chimerism in primary and secondary recipients (mean ± SEM). (J) Bar plots showing LT-HSC donor chimerism in primary and secondary recipients (mean ± SEM). The asterisks indicate significant differences by Student t test (∗∗∗∗P < .0001; ∗∗∗P < .001; ∗∗P < .01; ∗P < .05) unless otherwise indicated.
Figure 1.
Figure 1.
STAT5 loss leads to defective HSC function. (A) Bar plot showing the frequency of ESLAM HSCs (CD45+CD150+CD48EPCR+) in BMMNCs from WT and STAT5-deficient mice (mean ± standard error of the mean [SEM]). (B) Bar plot showing the frequency of LT-HSCs (LinSca1cKit+CD150+CD48CD34Flk2) in BMMNCs (mean ± SEM). (C) Bar plot showing the frequency of B cells (B220+) in BMMNCs (mean ± SEM). (D) Bar plot showing the frequency of CFU-e progenitors (LinSca1cKit+CD41CD16/32CD105+CD150) in BMMNCs (mean ± SEM). (E) Bar plots showing the frequency of CFU-e and pre–CFU-e (LinSca1cKit+CD41CD16/32CD105+CD150+) cells in spleen mononuclear cells (mean ± SEM). (F) Bar plots (left) showing the frequency of megakaryocyte (CD41+CD42+) and erythroid precursor cells (I, CD71hiTer119mid; II, CD71hiTer119hi; III, CD71midTer119hi; IV, CD71lowTer119hi) in spleen mononuclear cells (mean ± SEM) with a representative flow-cytometry plot (right) showing the gating of different stages of erythroid precursor cells in terminal differentiation. (G) Schematic diagram showing that 33 fluorescence-activated cell sorting–purified BM ESLAM HSCs were transplanted into irradiated recipient mice with 5 × 105 competitor BMMNCs. STAT5 was deleted in Cre+ donor cells after transplantation by repeated injection (×7) with Poly:IC in recipients. Blood was taken before and after STAT5 deletion and was followed for 5 months after deletion before serial transplantation of 3 × 106 primary recipient BMMNCs. (H) Connected line graphs showing donor chimerism in peripheral blood mononuclear cells at each time point in primary and secondary recipients (mean ± SEM). The dotted line indicates initiation of the Poly:IC injections. The asterisks indicate significant differences by analysis of variance column factor (∗∗∗∗P < .0001). (I) Bar plots showing the total BMMNC donor chimerism in primary and secondary recipients (mean ± SEM). (J) Bar plots showing LT-HSC donor chimerism in primary and secondary recipients (mean ± SEM). The asterisks indicate significant differences by Student t test (∗∗∗∗P < .0001; ∗∗∗P < .001; ∗∗P < .01; ∗P < .05) unless otherwise indicated.
Figure 2.
Figure 2.
STAT5-deficient HSCs display reduced cell cycle entry, increased differentiation, and reduced retention of lineage-negative progeny. (A) Gene set enrichment analysis (GSEA) plots showing depleted cell cycle–related signatures in STAT5-deficient ESLAM (CD45+CD150+CD48EPCR+) HSCs. scRNAseq analysis using the Smart-seq platform was performed on FACS-isolated ESLAM HSCs from STAT5f/f Cre- or STAT5f/f Cre+ BM; 132 STAT5-deficient and 132 WT HSCs passed quality control and were used for downstream analysis. The normalized enrichment scores (NES) and false discovery rate (FDR) are indicated. (B) Plots showing the cell cycle scores of transcriptionally defined LT-HSCs, ST-HSCs, and MPPs that were isolated from scRNAseq data sets of WT and STAT5-deficient BM LK cells (STAT5 WT, n = 3; STAT5KO, n = 3). (C) Line graphs showing the proportion of ESLAM HSCs that past first, second, third, and fourth divisions at given timepoints (y-axis) in the single cell in vitro analysis (mean ± SEM). The results are from 3 biological replicates across 3 experiments. (D) Bar plots (left) showing the mean fluorescent intensity (MFI) of pSTAT5 antibody staining of ESLAM HSCs by intracellular flow-cytometry analysis in unstimulated maintenance culture conditions (SCF/IL-11) or TPO (200 ng/mL) positive control conditions (mean ± SEM). Right; representative histogram of the intracellular flow-cytometry analysis showing the intensity of pSTAT5 staining in each condition. The results are from 3 biological replicates. (E) Bar plot showing the number of cells in each well at day 5 from an initial culture of 50 ESLAM HSCs in SCF/IL11 maintenance conditions. The number of cells that expressed mature lineage markers (Ter119+, Ly6g+, CD11b+, NK1.1+, B220+, CD19+, or CD3e+) and the number of lineage-negative cells are shaded in different colours (mean ± SEM). The results are from 9 to 7 biological replicates across 4 experiments. (F) Bar plot showing the proportion of cells that expressed mature lineage markers after 5 days in culture that originated from 50 ESLAM HSCs (mean ± SEM). (G) Bar plot showing the proportion of cells that expressed specific mature lineage markers for monocytes (Mons) and granulocytes (Grans; Ly6g+), Grans and macrophages (MacsCD11b+), erythroid (Ery; Ter119+), lymphocytes (LYMs; CD3e+/CD19+/B220+), and natural killer cells (NK; NK1.1+) after 5 days in culture that originated from 50 ESLAM HSCs (mean ± SEM). (H) Bar plot showing the frequency of Ter119+ cells after 5 days in culture that originated from 50 ESLAM HSCs (mean ± SEM). Asterisks indicate significant differences as determined by Student t test (∗∗∗∗P < .0001; ∗∗∗P < .001; ∗∗P < .01; ∗P < .05). KO, knockout.
Figure 2.
Figure 2.
STAT5-deficient HSCs display reduced cell cycle entry, increased differentiation, and reduced retention of lineage-negative progeny. (A) Gene set enrichment analysis (GSEA) plots showing depleted cell cycle–related signatures in STAT5-deficient ESLAM (CD45+CD150+CD48EPCR+) HSCs. scRNAseq analysis using the Smart-seq platform was performed on FACS-isolated ESLAM HSCs from STAT5f/f Cre- or STAT5f/f Cre+ BM; 132 STAT5-deficient and 132 WT HSCs passed quality control and were used for downstream analysis. The normalized enrichment scores (NES) and false discovery rate (FDR) are indicated. (B) Plots showing the cell cycle scores of transcriptionally defined LT-HSCs, ST-HSCs, and MPPs that were isolated from scRNAseq data sets of WT and STAT5-deficient BM LK cells (STAT5 WT, n = 3; STAT5KO, n = 3). (C) Line graphs showing the proportion of ESLAM HSCs that past first, second, third, and fourth divisions at given timepoints (y-axis) in the single cell in vitro analysis (mean ± SEM). The results are from 3 biological replicates across 3 experiments. (D) Bar plots (left) showing the mean fluorescent intensity (MFI) of pSTAT5 antibody staining of ESLAM HSCs by intracellular flow-cytometry analysis in unstimulated maintenance culture conditions (SCF/IL-11) or TPO (200 ng/mL) positive control conditions (mean ± SEM). Right; representative histogram of the intracellular flow-cytometry analysis showing the intensity of pSTAT5 staining in each condition. The results are from 3 biological replicates. (E) Bar plot showing the number of cells in each well at day 5 from an initial culture of 50 ESLAM HSCs in SCF/IL11 maintenance conditions. The number of cells that expressed mature lineage markers (Ter119+, Ly6g+, CD11b+, NK1.1+, B220+, CD19+, or CD3e+) and the number of lineage-negative cells are shaded in different colours (mean ± SEM). The results are from 9 to 7 biological replicates across 4 experiments. (F) Bar plot showing the proportion of cells that expressed mature lineage markers after 5 days in culture that originated from 50 ESLAM HSCs (mean ± SEM). (G) Bar plot showing the proportion of cells that expressed specific mature lineage markers for monocytes (Mons) and granulocytes (Grans; Ly6g+), Grans and macrophages (MacsCD11b+), erythroid (Ery; Ter119+), lymphocytes (LYMs; CD3e+/CD19+/B220+), and natural killer cells (NK; NK1.1+) after 5 days in culture that originated from 50 ESLAM HSCs (mean ± SEM). (H) Bar plot showing the frequency of Ter119+ cells after 5 days in culture that originated from 50 ESLAM HSCs (mean ± SEM). Asterisks indicate significant differences as determined by Student t test (∗∗∗∗P < .0001; ∗∗∗P < .001; ∗∗P < .01; ∗P < .05). KO, knockout.
Figure 3.
Figure 3.
Unphosphorylated STAT5 constrains HSC differentiation and upregulates transcriptional programs associated with HSC maintenance. (A) Schematic diagram showing the experimental outline of the ex vivo functional analysis of STAT5-deficient or WT ESLAM (CD45+CD150+CD48EPCR+) HSCs that were transduced with lentivirus containing STAT5B-YF or EV in maintenance cultures. After 3 days of transduction, GFP+ living cells were FACS sorted into single-cell assays. (B) Bar plots showing the proportion of cells expressing mature lineage markers (Ter119+/Ly6g+/CD11b+/B220+/CD3e+). Each dot represents a single clone and bars represent the mean lineage-positive marker frequency (±SEM). Asterisks indicate significant differences as determined by Student t tests (∗∗∗P < .001; ∗∗P < .01). The results are from 6 to 5 independent biological replicates across 5 experiments in STAT5+/+ settings and 4 to 3 independent biological replicates across 3 experiments in STAT5−/− settings. (C) Schematic diagram showing the outline of the scRNAseq analysis of WT ESLAM HSCs that were transduced with lentivirus containing STAT5B-YF or EV in maintenance cultures and that were allowed to expand for 5 days. GFP+ living cells were then sorted for 10X Genomics scRNAseq. (D) Bar plots showing the proportion of annotated cell types in GFP+ HSC-derived cultures after 5 days in SCF/IL-11 cultures; single cells were projected onto a previously published scRNAseq data set of LK HSPC cells and then onto a phenotypically-defined HSPC data set, and cell types were annotated based on their nearest neighbors to ascribe cell identity and cell type annotation. The results are from 2 independent biological replicates in 2 experiments. (E) Gene set enrichment plot showing that STAT5-YF–infected, transcriptionally defined LT-HSCs (n = 83) are depleted in a DNA replication gene signature when compared with EV-infected LT-HSCs (n = 53). The NES (−5.24) and FDR (<0.001) are indicated. (F) Left: bar plots showing the cell cycle phase frequency of ESLAM HSC-derived cultures infected with either EV (n = 5) or STAT5-YF (n = 4) lentivirus after 5 days in maintenance culture media. The cell cycle status was derived from Ki67/DAPI staining (right). G0 represents quiescent cells that are Ki67lowDAPIlow; G1 represents cells in the early growth phase, which are Ki67highDAPIlow; S-G2-M represents cells in DNA synthesis, late growth, and mitosis stages of active cell cycling and are Ki67highDAPIhigh. (G) Violin plot showing the geometric mean distribution of HSC scores in LT-HSCs expressing STAT5B-YF or EV. The HSC score was calculated using the HSC score tool that identifies potential mouse BM HSCs from scRNAseq data. This tool considers the expression of genes that are either positively or negatively corelated with HSC long-term repopulating capacity. (H) Violin plots showing significantly differentially expressed genes that are positively associated with functional long-term repopulating HSCs (Pdzk1ip1, Mettl7a1, Mllt3, and Gimap1), negatively associated with functional long-term repopulating HSCs (Serpinb1a and Hsp90aa1), or genes with reported functions in maintaining HSCs (Hlf, Chd9, Pbx1, and Plxnc1). All data were combined from 2 independent experiments. Asterisks indicate significant differences as determined by Student t tests (∗∗∗∗P < .0001; ∗∗∗P < .001; ∗∗P < .01; ∗P < .05). GMP, granulocyte-macrophage progenitor; LMPP, lymphoid-myeloid progenitor; MEP, Meg/Ery progenitors; ns, not significant.
Figure 4.
Figure 4.
Unphosphorylated STAT5B enhances HSPC clonogenicity in vitro and HSC maintenance in vivo. (A) Schematic diagram showing the experimental outline of the serial colony replating assays of STAT5-deficient or WT ESLAM (CD45+CD150+CD48EPCR+) HSCs that were transduced with lentivirus containing STAT5B-YF or EV in SCF/IL-11 maintenance cultures. After 3 days of transduction, GFP+ living cells were sorted for serial colony replating assays. (B) Bar plots showing the transformed colony numbers derived from WT HSPCs transduced with YF or EV lentivirus. Transformed colony counts = ((colony number × dilution factor) ÷ starting number of HSCs) (mean ± SEM). The results were from 4 independent experiments and 7 biological replicates. Asterisks indicate the significant differences as determined by Mann-Whitney U tests (∗∗P < .01). (C) Bar plots showing the transformed colony numbers of STAT5-deficient HSPCs transduced with YF or EV lentivirus. Transformed colony counts = ((colony number × dilution factor) ÷ starting number of HSCs) (mean ± SEM). The results were from 3 independent experiments and 4 biological replicates. Asterisks indicate significant differences as determined by Mann-Whitney U tests (∗P < .05). (D) Schematic diagram showing the outline of the in vivo functional analysis of WT ESLAM HSCs that were transduced with lentivirus containing STAT5B-YF or EV. FACS-sorted WT ESLAM HSCs (CD45.2+) were infected with lentivirus and cultured for 3 days in maintenance cultures and then an equal number of GFP+ cells were FACS sorted (112 GFP+ cells per recipient) and injected into irradiated recipients (CD45.1+) with 3 × 105 competitor BMMNCs (CD45.1+/CD45.2+). Donor chimerism was monitored every 28 days for more than 6 months. Secondary transplantation was then performed using 5 × 106 BMMNCs from primary recipients. BMMNCs from 1 primary recipient were transplanted into up to 2 recipients. (E) Connected line graph showing donor chimerism in primary recipients (mean ± SEM) (experiment described in panel D). Chimerism was derived as the ratio of donor: (donor + competitor). (F) Connected line graph showing donor chimerism in secondary recipients (mean ± SEM) (experiment described in panel D). Chimerism was derived as the ratio of donor/(donor + competitor). (G) Bar plots showing donor chimerism in total BMMNCs and ESLAM HSCs in the BM of the primary transplant recipients (mean ± SEM). (H) Bar plots showing donor chimerism in total BMMNCs and ESLAM HSCs in the BM of the secondary transplant recipients (mean ± SEM). (I) Bar plots showing the ratio of ESLAM HSC donor chimerism to total BMMNC chimerism in primary recipient BM (mean ± SEM; dotted line indicating 1:1 ratio). (J) Bar plots showing the ratio of ESLAM HSC donor chimerism to total BMMNC chimerism in secondary recipient BM (mean ± SEM; dotted line indicating 1:1 ratio). Chimerism was derived as the ratio of donor/(donor + competitor). Asterisks indicate significant differences as determined by Student t tests (∗∗P < .01; ∗P < .05).
Figure 5.
Figure 5.
Ruxolitinib (RUX) enhances HSPC clonogenicity and maintains transplantable HSCs. (A) Schematic diagram showing intracellular flow cytometric analysis of STAT5 proteins in RUX-treated WT ESLAM HSCs (CD45+CD150+CD48EPCR+). WT ESLAM HSCs were sorted into serum–starved media and starved for 1 hour before a 30-minute stimulation with complete medium containing IL-3, IL-6, and SCF in the presence or absence of RUX, and a stimulation cocktail containing thrombopoietin (THPO), Flt3-L, and interferon alfa for positive control was included. Cells were then fixed and stained for intracellular flow cytometry. (B) Bar plots showing the MFI of pSTAT5 antibody staining in ESLAM HSCs, described in panel A, normalized to the unstimulated condition, which is indicated with the dotted line (mean ± SEM). Each dot represents the MFI of ESLAMs from a single mouse. The results are from 3 independent experiments. (C) Bar plots showing the MFI of total-STAT5 (tSTAT5) antibody staining in ESLAM HSCs, described in panel A, normalized to STAT5-deficient HSPCs, which is indicated with the dotted line (mean ± SEM). The results are from 3 independent experiments. (D) Bar plots showing cell number per well in HSC-derived cultures at each dose of RUX or vehicle after 7 days (mean ± SEM). A total of 50 ESLAMs were seeded per well in 96-well plates in IL-3/IL-6/SCF cultures and were treated with DMSO or the indicated doses of RUX. The results are from 6 independent experiments. (E) Bar plot showing the proportion of cells that expressed lineage-positive markers (Ter119+/Ly6g+/CD11b+/B220+/CD3e+) after 7 days in culture at different concentrations (nM) of RUX (mean ± SEM). A total of 50 ESLAMs were seeded per well in 96-well plates in IL-3/IL-6/SCF cultures and were treated with the indicated doses of RX. The results are from 6 independent experiments. (F) Bar plots showing the clone survival rate of single HSCs after 5 days in culture. Single ESLAM HSCs were sorted per well and treated with vehicle or RUX. Clone survival rate was the proportion of wells that contained cells at day 5. Each dot represents the frequency of surviving clones from each of 3 independent experiments; the bars show the mean ± SEM. (G) Schematic diagram showing the serial colony replating assays and in vivo functional analysis for ESLAM HSCs treated with RUX or vehicle. A total of 50 WT ESLAM HSCs were sorted per well into complete media with scaled doses of RUX or vehicle. Cells were harvested after 7 days and plated into serial colony replating assays. ESLAM HSC (CD45.2+)–derived cells after 5 days in culture were harvested and transplanted into lethally irradiated recipient mice (CD45.1+) with 3 × 105 fresh BMMNCs from competitor mice (CD45.1+/CD45.2+). Blood was analyzed every 28 days for 6 months. Secondary transplants were then set up by transplanting 3 × 106 BM cells from the primary transplant recipients. (H) Bar plots showing the number of colonies produced by HSC-derived cultures treated with vehicle or RUX (250 or 1000 nM) for 7 days, normalized to the number of colonies produced by vehicle-treated cultures at each week of replating. The results are shown as mean ± SEM and were from 5 independent experiments, 3 of which included 1000 nM. Asterisks indicate significant differences as determined by Mann-Whitney U tests (∗∗P < .01; ∗P < .05). (I) Scatter dot plot with linear regression line of best fit showing the peripheral blood donor chimerism in primary (left) and secondary (right) recipients transplanted with 5-day ex vivo cultured HSCs with RUX or vehicle. A total of 50 ESLAMs from WT mice were seeded per well in IL-3/IL-6/SCF culture conditions and given DMSO or 250 nM of RUX for 5 days before the cells were harvested and pooled for each condition, and an equivalent of 10 starting ESLAMs was transplanted per recipient with 3 × 105 competitor BM cells. Each dot indicates the mean donor chimerism and are shown as mean ± SEM. Black asterisks indicate significant differences in the slopes of the linear regression modeling that compared chimerism of RUX-treated donor cell with DMSO-treated donor cell chimerism in the primary recipients (∗∗P < .01). Blue asterisks indicate significant differences in the y-intercepts of linear regressions modeling that compared chimerisms of RUX-treated donor cells with DMSO-treated donor cells in secondary transplants (∗∗∗P < .001). (J) Bar plots showing the donor chimerism within the ESLAM HSC compartment at the end of primary and secondary recipients of 5-day ex vivo cultured HSCs with RUX or vehicle. The data are shown as the mean ± SEM. (K) Violin plot showing the geometric mean distribution of HSC scores in LT-HSCs from the 10x scRNAseq data set of the cells treated with RUX or DMSO. The scores were calculated using the HSC score tool that identifies potential mouse BM HSCs from scRNAseq data. This tool considers the expression of genes that are either positively or negatively correlated with HSC long-term repopulating capacity. (L) Violin plots showing significantly differentially expressed genes that are positively associated with functional long-term repopulating HSCs (Pdzk1ip1, Mettl7a1, Mllt3, and Gimap6), negatively associated with functional long-term repopulating HSCs (Hsp90aa1 and Cdk6), or genes with reported functions in maintaining HSCs (Hlf, Pbx1, Chd9, and Plxnc1). All data were combined from 2 independent experiments. Asterisks indicate significant differences as determined by Student t tests (∗∗∗∗P < .0001; ∗∗∗P < .001; ∗∗P < .01; ∗P < .05) unless otherwise indicated. ns, not significant.
Figure 5.
Figure 5.
Ruxolitinib (RUX) enhances HSPC clonogenicity and maintains transplantable HSCs. (A) Schematic diagram showing intracellular flow cytometric analysis of STAT5 proteins in RUX-treated WT ESLAM HSCs (CD45+CD150+CD48EPCR+). WT ESLAM HSCs were sorted into serum–starved media and starved for 1 hour before a 30-minute stimulation with complete medium containing IL-3, IL-6, and SCF in the presence or absence of RUX, and a stimulation cocktail containing thrombopoietin (THPO), Flt3-L, and interferon alfa for positive control was included. Cells were then fixed and stained for intracellular flow cytometry. (B) Bar plots showing the MFI of pSTAT5 antibody staining in ESLAM HSCs, described in panel A, normalized to the unstimulated condition, which is indicated with the dotted line (mean ± SEM). Each dot represents the MFI of ESLAMs from a single mouse. The results are from 3 independent experiments. (C) Bar plots showing the MFI of total-STAT5 (tSTAT5) antibody staining in ESLAM HSCs, described in panel A, normalized to STAT5-deficient HSPCs, which is indicated with the dotted line (mean ± SEM). The results are from 3 independent experiments. (D) Bar plots showing cell number per well in HSC-derived cultures at each dose of RUX or vehicle after 7 days (mean ± SEM). A total of 50 ESLAMs were seeded per well in 96-well plates in IL-3/IL-6/SCF cultures and were treated with DMSO or the indicated doses of RUX. The results are from 6 independent experiments. (E) Bar plot showing the proportion of cells that expressed lineage-positive markers (Ter119+/Ly6g+/CD11b+/B220+/CD3e+) after 7 days in culture at different concentrations (nM) of RUX (mean ± SEM). A total of 50 ESLAMs were seeded per well in 96-well plates in IL-3/IL-6/SCF cultures and were treated with the indicated doses of RX. The results are from 6 independent experiments. (F) Bar plots showing the clone survival rate of single HSCs after 5 days in culture. Single ESLAM HSCs were sorted per well and treated with vehicle or RUX. Clone survival rate was the proportion of wells that contained cells at day 5. Each dot represents the frequency of surviving clones from each of 3 independent experiments; the bars show the mean ± SEM. (G) Schematic diagram showing the serial colony replating assays and in vivo functional analysis for ESLAM HSCs treated with RUX or vehicle. A total of 50 WT ESLAM HSCs were sorted per well into complete media with scaled doses of RUX or vehicle. Cells were harvested after 7 days and plated into serial colony replating assays. ESLAM HSC (CD45.2+)–derived cells after 5 days in culture were harvested and transplanted into lethally irradiated recipient mice (CD45.1+) with 3 × 105 fresh BMMNCs from competitor mice (CD45.1+/CD45.2+). Blood was analyzed every 28 days for 6 months. Secondary transplants were then set up by transplanting 3 × 106 BM cells from the primary transplant recipients. (H) Bar plots showing the number of colonies produced by HSC-derived cultures treated with vehicle or RUX (250 or 1000 nM) for 7 days, normalized to the number of colonies produced by vehicle-treated cultures at each week of replating. The results are shown as mean ± SEM and were from 5 independent experiments, 3 of which included 1000 nM. Asterisks indicate significant differences as determined by Mann-Whitney U tests (∗∗P < .01; ∗P < .05). (I) Scatter dot plot with linear regression line of best fit showing the peripheral blood donor chimerism in primary (left) and secondary (right) recipients transplanted with 5-day ex vivo cultured HSCs with RUX or vehicle. A total of 50 ESLAMs from WT mice were seeded per well in IL-3/IL-6/SCF culture conditions and given DMSO or 250 nM of RUX for 5 days before the cells were harvested and pooled for each condition, and an equivalent of 10 starting ESLAMs was transplanted per recipient with 3 × 105 competitor BM cells. Each dot indicates the mean donor chimerism and are shown as mean ± SEM. Black asterisks indicate significant differences in the slopes of the linear regression modeling that compared chimerism of RUX-treated donor cell with DMSO-treated donor cell chimerism in the primary recipients (∗∗P < .01). Blue asterisks indicate significant differences in the y-intercepts of linear regressions modeling that compared chimerisms of RUX-treated donor cells with DMSO-treated donor cells in secondary transplants (∗∗∗P < .001). (J) Bar plots showing the donor chimerism within the ESLAM HSC compartment at the end of primary and secondary recipients of 5-day ex vivo cultured HSCs with RUX or vehicle. The data are shown as the mean ± SEM. (K) Violin plot showing the geometric mean distribution of HSC scores in LT-HSCs from the 10x scRNAseq data set of the cells treated with RUX or DMSO. The scores were calculated using the HSC score tool that identifies potential mouse BM HSCs from scRNAseq data. This tool considers the expression of genes that are either positively or negatively correlated with HSC long-term repopulating capacity. (L) Violin plots showing significantly differentially expressed genes that are positively associated with functional long-term repopulating HSCs (Pdzk1ip1, Mettl7a1, Mllt3, and Gimap6), negatively associated with functional long-term repopulating HSCs (Hsp90aa1 and Cdk6), or genes with reported functions in maintaining HSCs (Hlf, Pbx1, Chd9, and Plxnc1). All data were combined from 2 independent experiments. Asterisks indicate significant differences as determined by Student t tests (∗∗∗∗P < .0001; ∗∗∗P < .001; ∗∗P < .01; ∗P < .05) unless otherwise indicated. ns, not significant.
Figure 6.
Figure 6.
RUX maintains murine and human MPN HSPCs. (A) Schematic diagram showing the in vitro functional assays of murine ESLAM HSCs (CD45+CD150+CD48EPCR+) treated with RUX or DMSO. ESLAM HSCs were FACS isolated from CALRdel/del (n = 4) mutant mice and were then cultured for 7 days in IL-3/IL-6/SCF media with DMSO or 250 nM of RUX before analysis by flow cytometry. (B) Bar plots showing cell number per well in HSC-derived cultures treated with vehicle or 250 nM RUX after 7 days (mean ± SEM). (C) Bar plots showing the proportion of cells that expressed lineage-positive markers (Ter119+/Ly6g+/CD11b+/B220+/CD3e+) after 7 days in culture with DMSO or 250 nM RUX (mean ± SEM). Asterisks indicate significant differences as determined by Student t tests (∗∗∗P < .001; ∗∗P < .01; ∗P < .05). (D) Schematic diagram showing the serial replating assays that investigated the effect of RUX on ESLAM HSCs isolated from WT and CALRdel/del mutant mice. Sorted ESLAM HSCs were cultured for 7 days in IL-3/IL-6/SCF media with DMSO or 250 nM RUX and then subjected to serial colony replating assays. (E) Bar plots showing the fold change in the number of colonies produced by HSC-derived cultures treated with vehicle or 250 nM RUX for 7 days, normalized to the number of colonies produced by vehicle-treated cultures at each week of replating. The results are from 2 independent experiments and are shown as mean ± SEM. Asterisks indicate significant differences as determined by Mann-Whitney U tests (∗P < .05) (F) Schematic diagram showing that HSCs (MPP1–LT-HSCs; CD34+CD38CD45RA) cells were sorted from healthy human platelet apheresis donor cone samples or from the peripheral blood of patients with myelofibrosis into 96-well plates (400 cells per well) and cultured in high-cytokine, serum-free medium (EXPER cytokine media) with scaled doses of RUX or vehicle control (DMSO). After 7 days, the HSC-derived cultures were plated in serial colony replating assays in methylcellulose. Healthy donors were all male and between 48 and 69 years of age. Among the donor patients with myelofibrosis, 3 patients carried a JAK2 V617F mutation and were all male between the ages of 65 to 70 years and 1 donor carried a CALR 52 bp deletion mutation and was a 70 year old female at the time of sample collection. (G) Bar plots showing the fold change in the number of colonies produced by HSPCs that were isolated from healthy donors and cultured for 7 days in the presence of RUX, normalized to the number of colonies that were produced by HSPCs after culturing for 7 days with DMSO. The data are shown as log2(fold change) from DMSO. Left showing fold change in colony numbers in the first round of colony formation (2 weeks in methylcellulose). Right showing fold change in colony numbers in the second round of colony formation (4 weeks in methylcellulose). From the data of the 4 healthy donors, each dot represents the mean fold change between technical replicates of a single donor. (H) Table showing the significance values (P value) from the estimated marginal (EM) means statistics derived from comparisons between DMSO and RUX conditions using a generalized mixed linear model applied to the raw colony counts used to generate Figure 5G. (I) Bar plots showing the fold change in number of colonies produced by HSPCs that were isolated from patients with myelofibrosis and cultured for 7 days in the presence of RUX, normalized to the number of colonies produced by HSPCs cultured for 7 days with DMSO. The data are shown as log2(fold change) from DMSO. Left showing the fold change in colony numbers in the first round of colony formation (2 weeks in methylcellulose). Right showing the fold change in colony numbers in the second round of colony formation (4 weeks in methylcellulose). Each dot represents the average fold change from each of 4 patients with myelofibrosis, and the bars represent the mean ± SEM. (J) Table showing the significance values (P value) from EM means statistics derived from comparisons between DMSO and RUX conditions using a generalized mixed linear model statistic applied to colony counts used to generate Figure 5I.

References

    1. Orkin SH, Zon LI. Hematopoiesis: an evolving paradigm for stem cell biology. Cell. 2008;132(4):631–644. - PMC - PubMed
    1. Laurenti E, Göttgens B. From haematopoietic stem cells to complex differentiation landscapes. Nature. 2018;553(7689):418–426. - PMC - PubMed
    1. Rossi L, Lin KK, Boles NC, et al. Less is more: unveiling the functional core of hematopoietic stem cells through knockout mice. Cell Stem Cell. 2012;11(3):302–317. - PMC - PubMed
    1. Pietras EM. Inflammation: a key regulator of hematopoietic stem cell fate in health and disease. Blood. 2017;130(15):1693–1698. - PMC - PubMed
    1. Collins A, Mitchell CA, Passegué E. Inflammatory signaling regulates hematopoietic stem and progenitor cell development and homeostasis. J Exp Med. 2021;218(7) - PMC - PubMed

MeSH terms