. 2025 Apr;62(4):4023-4041.
doi: 10.1007/s12035-024-04524-7. Epub 2024 Oct 8.

Brain Abnormalities in Young Single- and Double-Heterozygote Mice for Both Nkx2-1- and Pax8-Null Mutations

Affiliations

Brain Abnormalities in Young Single- and Double-Heterozygote Mice for Both Nkx2-1- and Pax8-Null Mutations

Antonia Giacco et al. Mol Neurobiol. 2025 Apr.

Abstract

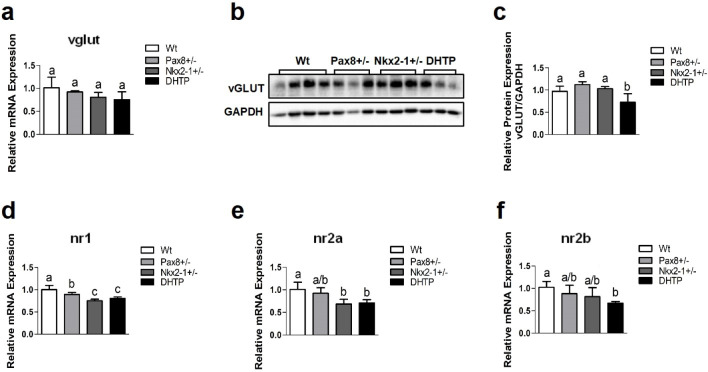
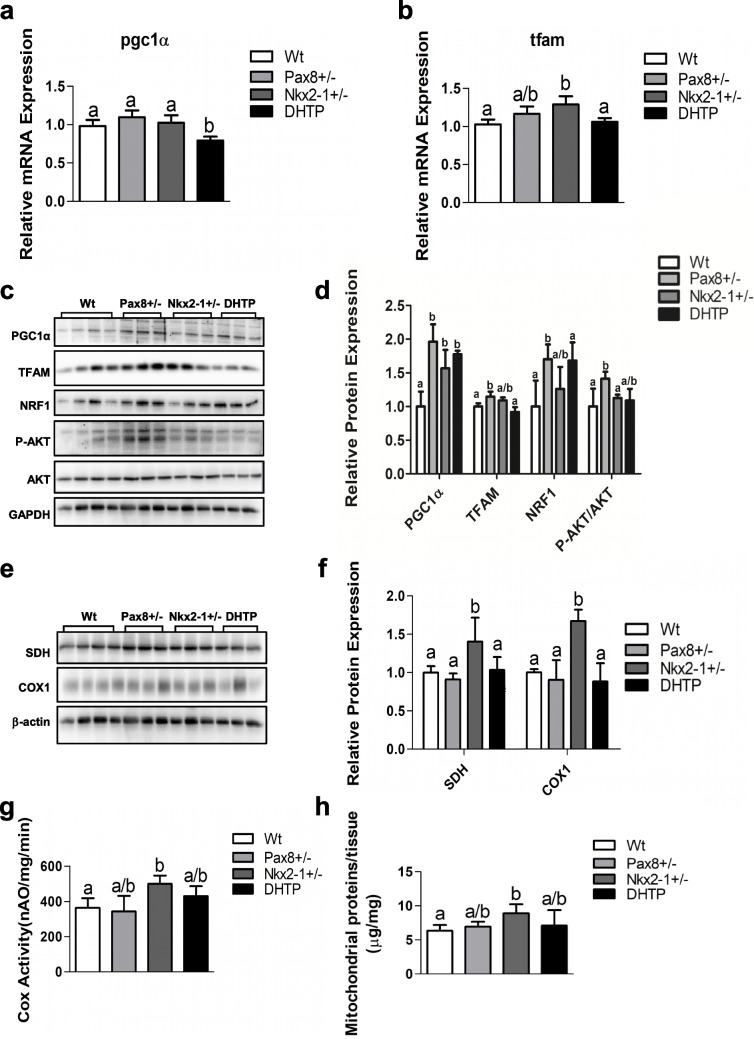
In humans and mice, Nkx2-1 and Pax8 are crucial morphogenic transcription factors defining the early development of the thyroid and specific extrathyroidal tissues. By using 3-month-old single or double heterozygotes for Nkx2-1- and Pax8-null mutations (DHTP) mice, we studied brain abnormalities under different human-like dysthyroidisms, focusing on putative alterations of specific neurotransmitter systems, expression of markers of pre- and post-synaptic function and, given the physio-pathological role mitochondria have in controlling the bioenergetic status of neurons, of mitochondrial dynamics and oxidative balance. Compared to Wt controls, DHTP mice, bearing both systemic and brain hypothyroidism, showed altered expression of synaptic markers, generic and cholinergic (corroborated by immunohistochemistry in caudate, putamen, hippocampus, and basal forebrain) and glutamatergic ones, and reduced expression of key proteins of synaptic plasticity potency and several isoforms of glutamate receptors. The brain of DHTP mice was characterized by lower levels of H2O2 and imbalanced mitochondrial dynamics. Nkx2-1 + / - mice showed dopaminergic neuron-specific alterations, morphologically, more evident in the substantia nigra of DHTP mice. Nkx2-1 + / - mice also showed enhanced mitochondrial biogenesis and oxidative capacity likely as a global response of the brain to Nkx2-1 haploinsufficiency and/or to their elevated T3 circulating levels. Reduced transcription of both tyrosine hydroxylase and dopamine transporter was observed in Pax8 + / - euthyroid mice, suggesting a dopaminergic dysfunction, albeit likely at an early stage, but consistent with the deregulated glucose homeostasis observed in such animals. Overall, new information was obtained on the impact of haploinsufficiency of Pax8 and NKx2-1 on several brain neuroanatomical, molecular, and neurochemical aspects, thus opening the way for future targeting brain dysfunctions in the management of both overt and subclinical thyroid dysfunctions.

Keywords: Congenital hypothyroidism; Mitochondria; Oxidative stress; Synapses.


Conflict of interest statement

Declarations. Ethics Approval: Mouse protocols were approved by the Ethics Committee of Biogem (IRGS, Via Camporeale, 83031 Ariano Irpino, Avellino, Italy). All experiments were performed in accordance with the guidelines approved by the Italian Ministry of Health (project authorization number, 518/2016-PR). Consent to Participate: Not applicable. Consent for Publication: Not applicable. Competing Interests: The authors declare no competing interests.

Figures

Fig. 1
Fig. 1
In the brain of Pax8 + / − , NKX2-1 + / − , and DHTP mice, TH bioavailability and action (a), expression of TH target genes (b) and of generic and functional synaptic markers (c). a mRNA expression levels of brain TH transporters (MCT8 and OATP1c), deiodinases (Dio2 and Dio3), and TH nuclear receptors (TRα1 and TRβ1). b mRNA expression levels of diacylglycerol kinase gamma (DgKg), hairless (Hr), and RC3. c mRNA expression levels of SNAP25, PSD95, SYP, and Rhes. Data were normalized to the values obtained for Wt animals (set as 1) and shown as mean ± SEM; n = 3–6. Bars labeled with dissimilar letters are significantly different; p < 0.05; one-way ANOVA (post hoc tests, Student-Newman Keuls)
Fig. 2
Fig. 2
Choline acetyltransferase (ChAT) expression in brain of Pax8 + / − , NKX2-1 + / − , and DHTP mice. a mRNA expression levels of ChAT in brain extract of Pax8 + / − , NKX2-1 + / − , and DHTP mice. Data were normalized to the values obtained for Wt animals (set as 1) and shown as mean ± SEM; n = 3. Bas labeled with dissimilar letters are significantly different; p < 0.05; one-way ANOVA (post hoc tests, Student-Newman Keuls). b Representative western blots showing expression levels of ChAT protein in brain of Pax8 + / − , NKX2-1 + / − , and DHTP mice. c Quantification of the intensity of the bands in b; n = 3/4. Data were shown as relative intensity and values reported as mean ± SD. Bars labeled with dissimilar letters are significantly different; p < 0.05; one-way ANOVA (post hoc tests, Student-Newman Keuls). d Representative sagittal view of Nissl-stained brain sections from Wt, Pax8 + / − , NKX2-1 + / − , and DHTP mice at 3 months. Scale bars, 3 mm. e Distribution of ChAT immunoreactivity in the caudate putamen, hippocampus, and basal forebrain of DHTP mice. Representative images of ChAT distribution in the caudate putamen (a–d), hippocampus (e–f), and basal forebrain (g–h) of Wt and DHTP mice. Scale bars, a–b, 200 µm; c–d, 50 µm; e–f, 200 µm; g–i, 50 µm. The schematic diagram at the bottom of each photograph sets describes the anatomic region from where the images were taken. f Bar graphs showing the soma size of ChAT-positive neurons in basal forebrain of Wt and DHTP mice. Data are expressed as the mean of ChAT + cell soma area (µm2) ± SEM (n = 3). *p < 0.05, significantly different from Wt; one-way ANOVA with Bonferroni post hoc analysis. g Quantitative analysis of the number of ChAT + neurons in basal forebrain of Wt and DHTP mice. Data are expressed as the mean number of ChAT + cells ± SEM per unit area (mm2) (n = 3). *p < 0.05, significantly different from Wt; one-way ANOVA with Bonferroni post hoc analysis
Fig. 3
Fig. 3
Glutamate decarboxylase 67 (GAD67) and vesicular GABA transporter (vGAT) expression in the brain of Pax8 + / − , NKX2-1 + / − , and DHTP mice. mRNA expression levels of GAD67 (a) and vGAT (b) in brain extract of Pax8 + / − , NKX2-1 + / − , and DHTP mice. Data were normalized to the values obtained for Wt animals (set as 1) and shown as mean ± SEM; n = 3. Bars labeled with dissimilar letters are significantly different; p < 0.05; one-way ANOVA (post hoc tests, Student-Newman Keuls)
Fig. 4
Fig. 4
Vesicular glutamate transporter (vGLUT) and N-methyl-d-aspartate receptor subunit 1 (NR1), 2A (NR2A), and 2B (NR2B) expression in the brain of Pax8 + / − , NKX2-1 + / − , and DHTP mice. a, d, e, and f mRNA expression levels of vGLUT, NR1, NR2A, and NR2B in brain extract of Pax8 + / − , NKX2-1 + / − , and DHTP mice. Data were normalized to the values obtained for Wt animals (set as 1) and shown as mean ± SEM; n = 3. Bars labeled with dissimilar letters are significantly different; p < 0.05; one-way ANOVA (post hoc tests, Student-Newman Keuls). b Representative western blots showing expression levels of vGLUT protein in the brain of Pax8 + / − , NKX2-1 + / − , and DHTP mice. c Quantification of the intensity of the bands in b; n = 3/4. Data were shown as relative intensity and values reported as mean ± SD. Bars labeled with dissimilar letters are significantly different; p < 0.05; one-way ANOVA (post hoc tests, Student-Newman Keuls)
Fig. 5
Fig. 5
Tyrosine hydroxylase (Th) and dopamine transporter (DAT) expression in the brain of Pax8 + / − , NKX2-1 + / − , and DHTP mice. a and d mRNA expression levels of Th and DAT in brain extract of Pax8 + / − , NKX2-1 + / − , and DHTP mice. Data were normalized to the values obtained for Wt animals (set as 1) and shown as mean ± SEM; n = 3. Bars labeled with dissimilar letters are significantly different; p < 0.05; one-way ANOVA (post hoc tests, Student-Newman Keuls). b Representative western blots showing expression levels of Th protein in the brain of Pax8 + / − , NKX2-1 + / − , and DHTP mice. c Quantification of the intensity of the bands in b; n = 3/4. Data were shown as relative intensity and values reported as mean ± SD. Bars labeled with dissimilar letters are significantly different; p < 0.05; one-way ANOVA (post hoc tests, Student-Newman Keuls). e Distribution of Th immunoreactivity in the substantia nigra of Nkx2-1 + / − and DHTP mice. Representative low magnification images of Th distribution in the substantia nigra of Wt (a), Nkx2-1 + / − (b), and DHTP (c) mice. Panels d–f and g–i show high-magnification views of the boxed areas in a–c and d–f, respectively. Arrowheads and arrows in g–i point to Th-immunoreactive cells with unaltered or altered morphology, respectively. Scale bars: a–c, 200 µm; d–f, 50 µm; g–i 20 µm. f Bar graphs showing the soma size of Th + neurons in the substantia nigra pars compacta of Wt, Nkx2-1 + / − , and DHTP mice. Data are expressed as the mean of Th + cell soma area (µm2) ± SEM (n = 3). *p < 0.05, significantly different from Wt; one-way ANOVA with Bonferroni post hoc analysis. g Quantitative analysis of the number of Th + neurons in the substantia nigra pars compacta of Wt, Nkx2-1 + / − and DHTP mice. Data are expressed as the mean number of Th + cells ± SEM per unit area (mm2) (n = 3). *p < 0.05, significantly different from Wt; one-way ANOVA with Bonferroni post hoc analysis
Fig. 6
Fig. 6
Mitochondrial biogenesis markers and oxidative capacity in the brain of Pax8 + / − , NKX2-1 + / − , and DHTP mice. a and b mRNA expression levels of PGC1α and Tfam in Pax8 + / − , NKX2-1 + / − , and DHTP mice. Data were normalized to the values obtained for Wt animals (set as 1) and shown as mean ± SEM; n = 3/4. Bars labeled with dissimilar letters are significantly different; p < 0.05; one-way ANOVA (post hoc tests, Student-Newman Keuls). c and e Representative western blots showing expression levels of PGC1α, Tfam, NRF1, P-AKT, AKT, SHD, and COX1 proteins in the brain of Pax8 + / − , NKX2-1 + / − , and DHTP mice. d and f Quantification of the intensity of the bands in c; n = 3/4. Data were shown as relative intensity and values reported as mean ± SD. Bars labeled with dissimilar letters are significantly different; p < 0.05; one-way ANOVA (post hoc tests, Student-Newman Keuls). g Cytochrome c oxidase (COX) activity; n = 3. Data shown as mean ± SD. Bars labeled with dissimilar letters are significantly different; p < 0.05; one-way ANOVA (post hoc tests, Student-Newman Keuls). h Mitochondrial protein recovery from brain homogenates conducted as detailed in M&M, n = 3, Data shown as mean ± SD; bars labeled with dissimilar letters are significantly different; p < 0.05; one-way ANOVA (post hoc tests, Student-Newman Keuls)
Fig. 7
Fig. 7
Markers of mitochondrial dynamics in the brain of Pax8 + / − , NKX2 + / − , and DHTP mice. a Representative western blots showing expression levels of Mitofusin 1 (MFN1), Mitofusin 2 (MFN2), OPA 1, and DRP1. b Quantification of the intensity of the bands in a; n = 3/4. Data were shown as relative intensity and values reported as mean ± SD. Bars labeled with dissimilar letters are significantly different; p < 0.05; one-way ANOVA (post hoc tests, Student-Newman Keuls)
Fig. 8
Fig. 8
Oxidative balance and damage in the brain of Pax8 + / − , NKX2 + / − , and DHTP mice. a Brain content of H2O2; n = 3. Data shown as mean ± SD; bars labeled with dissimilar letters are significantly different; p < 0.05; one-way ANOVA (post hoc tests, Student-Newman Keuls). b Representative western blot showing carbonylated proteins in brain extracts of Pax8 + / − , NKX2 + / − , and DHTP mice; c quantification of the intensity of the bands in b; n = 4/3; data were normalized to the values obtained for Wt animals (set as 1) and shown as mean ± SD; bars labeled with dissimilar letters are significantly different; p < 0.05; one-way ANOVA (post hoc tests, Student-Newman Keuls). d representative western blots showing expression levels of antioxidant enzymes (SOD2, CAT, PRDX3, and GPX4) in brain extract; e quantification of the intensity of the bands in d; data were reported as relative intensity and values shown as mean ± SD; n = 4/3. Bars labeled with dissimilar letters are significantly different; p < 0.05; one-way ANOVA (post hoc tests, Student-Newman Keuls). f, g, and h SOD2, catalase (CAT), and GPX enzymatic activities measured in brain homogenate from Pax8 + / − , NKX2 + / − , and DHTP mice. n = 4/3. Bars labeled with dissimilar letters are significantly different; p < 0.05; one-way ANOVA (post hoc tests, Student-Newman Keuls)

References

    1. Churilov LP, Stroev, YI (2019) The tale of the knights of the shield: history of ideas in thyroidology. In: Churilov LP, Stroev YI, Akhmanov MS (eds) Essays on the history of medicine. Biographical sketches, 3rd edn. Umnyi Doktor, Moscow, pp 71–300 [in Russian]
    1. Churilov LP, Sobolevskaia PA, Stroev YI (2019) Thyroid gland and brain: enigma of Hashimoto’s encephalopathy. Best Pract Res Clin Endocrinol Metab 33:101364. 10.1016/j.beem.2019.101364 - PubMed
    1. Bernal J (2022) Thyroid hormones in brain development and function. In: Feingold KR, Anawalt B, Boyce A, Chrousos G, de Herder WW, Dhatariya K, Dungan K, Hershman JM, Hofland J, Kalra S, Kaltsas G, Koch C, Kopp P, Korbonits M, Kovacs CS, Kuohung W, Laferrère B, Levy M, McGee EA, McLachlan R, Morley JE, New M, Purnell J, Sahay R, Singer F, Sperling MA, Stratakis CA, Trence DL, Wilson DP (eds). Endotext [Internet]. MDText.com, Inc, South Dartmouth (MA), pp 2000–Available from: https://www.ncbi.nlm.nih.gov/books/NBK285549/
    1. Persani L, Rurale G, de Filippis T, Galazzi E, Muzza M, Fugazzola L (2018) Genetics and management of congenital hypothyroidism. Best Pract Res Clin Endocrinol Metab 32:387–396. 10.1016/j.beem.2018.05.002 - PubMed
    1. Rastogi MV, LaFranchi SH (2010) Congenital hypothyroidism. Orphanet J Rare Dis 5:17. 10.1186/1750-1172-5-17 - PMC - PubMed

LinkOut - more resources