. 2024 Oct 7;15(1):8691.
doi: 10.1038/s41467-024-52899-x.

Actin-driven nanotopography promotes stable integrin adhesion formation in developing tissue

Affiliations

Actin-driven nanotopography promotes stable integrin adhesion formation in developing tissue

Tianchi Chen et al. Nat Commun. .

Abstract

Morphogenesis requires building stable macromolecular structures from highly dynamic proteins. Muscles are anchored by long-lasting integrin adhesions to resist contractile force. However, the mechanisms governing integrin diffusion, immobilization, and activation within developing tissues remain elusive. Here, we show that actin polymerization-driven membrane protrusions form nanotopographies that enable strong adhesion at Drosophila muscle attachment sites (MASs). Super-resolution microscopy reveals that integrins assemble adhesive belts around Arp2/3-dependent actin protrusions, forming invadosome-like structures with membrane nanotopographies. Single protein tracking shows that, during MAS development, integrins become immobile and confined within diffusion traps formed by the membrane nanotopographies. Actin filaments also display restricted motion and confinement, indicating strong mechanical connection with integrins. Using isolated muscle cells, we show that substrate nanotopography, rather than rigidity, drives adhesion maturation by regulating actin protrusion, integrin diffusion and immobilization. These results thus demonstrate that actin-polymerization-driven membrane protrusions are essential for the formation of strong integrin adhesions sites in the developing embryo, and highlight the important contribution of geometry to morphogenesis.


Conflict of interest statement

The authors declare no competing interests.

Figures

Fig. 1
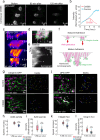
Fig. 1. Actin protrusion induces invadosome-like integrin adhesion and pattern formation in 3D tissue development of Drosophila muscle attachment site.
a Ex vivo embryo fillet culture preserves muscle attachment site (MAS) development and enrichment of the adhesion protein Paxillin-GFP. Inset shows a set of MASs from the lateral-transverse muscles (LT1-3). Scale bars, 50 μm. Images shown are representative of 3 independent experiments. b SIM imaging shows similarity between finger-print-like patterns in a mature MAS in vivo (left) and ex vivo (right). Scale bars, 1 μm. Images shown are representative of 3 and 7 independent experiments for in vivo and ex vivo respectively. c Development of the finger-print-like pattern revealed by two-color-demixing STORM images of actin (magenta) and integrin (green) clusters. Inset shows fluorescence intensity along the yellow dashed line. Scale bars, 1 μm. Images shown are representative of 2 independent experiments. d Adhesions increase in depth, as revealed by 3D ModLoc super-resolution imaging of integrin clusters in developing MASs, presented as surface models (top), 2D projections (center) and xz cross sections (bottom), with each cluster colored randomly and signal outside the clusters colored gray. Histograms show z-distribution of integrins. Images shown are representative of 3 independent experiments.
Fig. 2
Fig. 2. Adhesion development and integrin dynamics driven by Arp2/3-dependent actin polymerization.
a Continuous treatment of CK666 in mature adhesions (4.5 h ex vivo) induces their disassembly. Scale bars, 2 μm. Images are representative of 3 independent experiments. b Quantification of βPS-GFP fluorescence intensity of control and CK666 treated adhesions (mean ± s.e.m.). n = 11 embryos for control, n = 12 for CK666. c xz view of actin protrusions (filled arrow head) in a developing MAS, actin labeled by expression of the actin-binding domain of Utrophin tagged with GFP, Horizontal scale bar, 1 μm. Vertical scale bar, 1 μm. Images shown in (ce) are representative of 5 independent experiments. d Overlay showing dynamic actin protrusions 60 s apart, from a 1.5 h MAS ex vivo. Solid arrowhead shows protrusions at 0 s in green; outlined arrowhead shows a protrusion at +60 s in magenta. Scale bar, 1 μm. e Kymograph along yellow dashed line in (d). Horizontal scale bar, 500 nm. Vertical scale bar, 60 s. f Schematic of the organization of actin (magenta) and integrin (green) in nascent and mature adhesions. g Utrophin-GFP labeled actin puncta and puncta tracks in control and CK666 treated adhesion (1.5 h ex vivo). Scale bars, 1 μm. Images shown are representative of 3 independent experiments. h Movement speed (see Methods) of actin puncta. n = 81 adhesions for control, n = 126 for CK666. Two-sided unpaired two-sample t-test, p = 7.609e-48. i Density of actin puncta. n = 81 adhesions for control, n = 126 for CK666. Two-sided unpaired two-sample t-test, p = 1.499e-16. j Integrin foci and tracks (βPS-GFP) in control and CK666 treated MASs (1.5 h ex vivo). Scale bars, 1 μm. Images shown are representative of 2 independent experiments. k Movement speed of integrin foci. n = 73 adhesions for control, n = 116 for CK666. Two-sided unpaired two-sample t-test, p = 1.370e-38. l Density of integrin foci. n = 73 adhesions for control, n = 116 for CK666. Two-sided unpaired two-sample t-test, p = 1.123e-27. All box plots show median ± 25/75 percentiles with whiskers showing minimum and maximum values. Source data are provided as a Source Data file.
Fig. 3
Fig. 3. Diffusion and confinement of integrin adhesion protein dynamics during MAS development.
ac sptPALM tracking of integrin adhesion molecules and membrane anchored CAAX reveal their diffusion trajectories inside developing MASs. Left columns, reconstructed PALM images of βPS-mEos3.2, mEos3.2-CAAX and Fit1-mEos3.2 molecular localizations. Right columns, individual tracks are classified into diffusive (green) or immobile (magenta). Scale bars, 1 μm. Images are representative of 5, 5 and 3 independent experiments for (a, b, c) respectively. d Fraction of immobile and diffusive trajectories for βPS-mEos3.2, mEos3.2-CAAX and Fit1-mEos3.2 (mean ± s.e.m.). Two-sided unpaired two-sample t-tests, p values from left to right: p = 2.491e-5, 1.773e-6, 0.0119, 0.970, 0.853, 0.750. e Diffusion coefficient (D) of diffusive βPS-mEos3.2, mEos3.2-CAAX and Fit1-mEos3.2 molecules. Two-sided unpaired two-sample t-tests, p values from top to bottom: p = 3.677e-12, 1.207e-28, 2.043e-31, 3.640e-30, 0.008, 1.731e-08. f Schematic showing adhesion protein diffusion and immobilization in developing MAS. Whereas integrin diffusion is confined on the membrane, Kindlin can exchange between membrane and cytosolic diffusion. g Schematic of the organization of diffusion nano-domains in mature adhesions with diffusing (green) and immobilized (magenta) tracks of integrin molecules. h Representative image (5 independent experiments) showing the correlation between Paxillin-GFP image (left) and diffusion coefficient map of βPS-mEos3.2 (right). Immobilization spots are represented as red dots. Scale bar, 1 μm. i Distribution of angles between steps in the tracks for CAAX-mEos3.2 (left column) and βPS-mEos3.2 (right column). Schematic illustrates freely diffusing trajectory (left) vs. spatially confined trajectory (right). j Anisotropy of step angles for CAAX-mEos3.2 and βPS-mEos3.2. All sptPALM results for each condition correspond to data pooled from all trajectories in individual embryos. n = 26 embryos for βPS-mEos3.2, 57548 trajectories. n = 21 embryos for mEos3.2-CAAX, 30530 trajectories. n = 10 embryos for Fit1-mEos3.2, 12629 trajectories. Two-sided unpaired two-sample t-tests, p values from top to bottom, then left to right: p = 3.071e-5, 4.565e-3, 4.691e-24, 2.807e-35, 5.125e-28. Box plots show median ± 25/75 percentiles with whiskers showing minimum and maximum values. Source data are provided as a Source Data file.
Fig. 4
Fig. 4. Confined actin motion promotes strong molecular engagement with integrin adhesion.
a F-actin movement measured from tracking of actin-mEos3.2 shows isotropic distribution of direction in developing MASs, rather than a coordinated flow from the muscle end. Length of arrows denotes the speed of moving actin-mEos3.2. Scale bars, left: 0.1 μm/s, right: 1 μm. Images shown are representative of 3 independent experiments. b, Fraction of stationary and moving actin-mEos3.2 tracks quantifies reduction in actin polymerization (mean ± s.e.m.). n = 11 embryos for control, 5629 trajectories. n = 5 embryos for CK666, 485 trajectories. Same for (c, d, e). Two-sided unpaired two-sample t-test, p = 8.208e-4. c Mean square displacement curves of moving actin-mEos3.2 tracks showing directed, Brownian, or confined motion (mean ± s.e.m.). d Fraction of moving actin-mEos3.2 tracks exhibiting directed, Brownian, or confined motion (mean ± s.e.m.). Two-sided unpaired two-sample t-test, p values from top to bottom: p = 2.039e-2, 7.335e-3, 5.676e-4. e Actin movement speed for control at 1.5 h, 3 h and 4.5 h and CK666 treatment at 1.5 h. Two-sided unpaired two-sample t-test, p values from top to bottom: p = 2.762e-3, 0.324, 3.377e-3. Box plot shows median ± 25/75 percentiles with whiskers showing minimum and maximum values. f Diffusive and immobile fraction of βPS-mEos3.2 for control and Mn2+ stimulation (mean ± s.e.m.). n = 26 embryos for control, 57548 trajectories. n = 9 embryos for Mn2+, 15709 trajectories. Two-sided unpaired two-sample t-test, p values from left to right: p = 9.919e-4, 0.659. g Illustration showing confined actin movement and molecular engagement with integrin adhesion in developing MAS. Source data are provided as a Source Data file.
Fig. 5
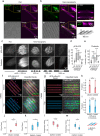
Fig. 5. Actin dynamics and stable structures regulate integrin diffusion dynamics during adhesion maturation.
a sptPALM tracking of integrin (βPS-mEos3.2) with continuous CK666 treatment. Scale bar, 1 μm. Images shown are representative of 2 independent experiments. b Fraction of immobile and diffusive trajectories for βPS-mEos3.2 (mean ± s.e.m.). n = 15 embryos for DMSO, 44226 trajectories; n = 10 embryos for CK666, 7095 trajectories; n = 10 for CK666 & Mn2+, 11247 trajectories; same for (c, d). Two-sided unpaired two-sample t-test, p values from left to right: p = 9.294e-3, 1.447e-14, 0.345, 0.0584. c Diffusion coefficient of diffusive βPS-mEos3.2 molecules. Two-sided unpaired two-sample t-test, p values from top to bottom, then left to right, in each time group: p = 4.429e-6, 2.767e-7, 5.688e-3; 5.352e-7, 1.556e-12, 1.291e-3; 4.511e-9, 6.151e-11, 3.150e-3. d Step angle anisotropy for βPS-mEos3.2. Two-sided unpaired two-sample t-test, p values from top to bottom, then left to right, in each time group: p = 5.087e-2, 1.198e-3, 4.529e-2; 3.225e-4, 3.138e-7, 3.532e-2; 3.693e-8, 1.181e-11, 7.662e-2. e Schematic showing the effect of CK666 on dynamic actin in nascent and mature adhesions vs. the effect of Swinholide A on stable actin structure in mature adhesions. Illustration shows a cross-section of the MAS as seen in Fig. 1d and actin protrusion as seen in Fig. 2c. f Adhesion morphology before (green dashed line) and after (magenta dashed line) brief CK666 treatment in mature adhesions. Scale bar, 2 μm. Images shown are representative of 2 independent experiments g Adhesion morphology before (green dashed line) and after (magenta dashed line) brief Swinholide A treatment in mature adhesions. Scale bar, 2 μm. Images shown are representative of 3 independent experiments h Fraction of immobile and Diffusive trajectories for βPS-mEos3.2 (mean ± s.e.m.). n = 15 embryos for DMSO, 20910 trajectories; n = 8 embryos for Brief CK666, 5939 trajectories; n = 7 for Brief Swinholide A, 17286 trajectories; same for (i). Two-sided unpaired two-sample t-test, p values from left to right: p = 5.143e-2, 1.744e-11. i Diffusion coefficient of diffusive βPS-mEos3.2 molecules. Two-sided unpaired two-sample t-test, p values from left to right: p = 7.002e-3, 4.788e-14. All box plots show median ± 25/75 percentiles with whiskers showing minimum and maximum values. Source data are provided as a Source Data file.
Fig. 6
Fig. 6. Nanotopography promotes adhesion formation and confinement of integrin diffusion through actin cytoskeleton.
a Isolated muscle cell on rigid flat substrate expressing βPS-GFP (green) and stained with Phalloidin (magenta). Scale bar, 5 μm. zoom in panel scale bars, 1 μm. Images shown are representative of 3 independent experiments. b Isolated muscle cell on nanopatterned substrate expressing βPS-GFP (green) and stained with Phalloidin (magenta). Scale bars 5 μm, zoom in panel scale bars, 1 μm. xz view along yellow dashed line. Scale bars, 2 μm. zoom in panel scale bars, 1 μm. Schematic shows the dimension of nanopattern. Images shown are representative of 6 independent experiments. c Representative images (3 independent experiments) showing adhesion morphology (top row: βPS-GFP, bottom row: phalloidin) of isolated muscle cell adhesions on flat and nanotopographies with different width. d Fluorescence intensity of βPS-GFP. n = 32 cells for flat, n = 13 for 200 nm, n = 15 for 400 nm, n = 8 for 800 nm, n = 5 for 1600 nm, same for (e). Two-sided unpaired two-sample t-test, p values from left to right: p = 3.487e-8. 1.024e-5, 6.110e-9, 6.845e-2. e Fluorescence intensity of phalloidin. Two-sided unpaired two-sample t-test, p values from left to right: p = 6.374e-5, 4.227e-5, 3.442e-2, 9.418e-1. f sptPALM of βPS-mEos3.2 on nanotopography with 800 µm width with DMSO control. Shaded area shows representative regions corresponding to bottom or top parts of the nanotopography (See illustration). Images shown are representative of 3 independent experiments. g sptPALM of βPS-mEos3.2 on nanotopography with 800 nm width with CK666 treatment. Images shown are representative of 3 independent experiments. Diffusion fraction for bottom (h) and top (i) (mean ± s.e.m.). n = 11 cells for DMSO bottom, 3588 trajectories, n = 9 cells for CK666 bottom, 4918 trajectories n = 12 cells for DMSO top, 5270 trajectories, n = 11 cells for CK666 top, 5523 trajectories, same for (jm). Two-sided unpaired two-sample t-test, p = 2.268e-5 for h, p = 9.000e-2 for (i). Diffusion Coefficient for bottom (j) and top (k). Two-sided unpaired two-sample t-test, p = 1.588e-6 for j, p = 1.493e-2 for (k). Step angle anisotropy for bottom (l) and top (m). Two-sided unpaired two-sample t-test, p = 2.677e-2 for (l), p = 2.608e-2 for (m). All box plots show median ± 25/75 percentiles with whiskers showing minimum and maximum values. Source data are provided as a Source Data file.

References

    1. Lecuit, T., Lenne, P.-F. F. & Munro, E. Force generation, transmission, and integration during cell and tissue morphogenesis. Annu. Rev. Cell Dev. Biol.27, 157–184 (2011). - PubMed
    1. Goodwin, K. et al. Basal cell-extracellular matrix adhesion regulates force transmission during tissue morphogenesis. Dev. Cell39, 611–625 (2016). - PubMed
    1. Subramanian, A. & Schilling, T. F. Tendon development and musculoskeletal assembly: emerging roles for the extracellular matrix. Development142, 4191–4204 (2015). - PMC - PubMed
    1. Maartens, A. P. & Brown, N. H. The many faces of cell adhesion during Drosophila muscle development. Dev. Biol.401, 62–74 (2015). - PubMed
    1. Valdivia, M., Vega-Macaya, F. & Olguín, P. Mechanical control of myotendinous junction formation and tendon differentiation during development. Front. Cell Dev. Biol.5, 26 (2017). - PMC - PubMed

Publication types

MeSH terms

LinkOut - more resources