. 2024 Oct 8;15(1):8692.
doi: 10.1038/s41467-024-53084-w.

Two-dimensional coordination risedronate-manganese nanobelts as adjuvant for cancer radiotherapy and immunotherapy

Affiliations

Two-dimensional coordination risedronate-manganese nanobelts as adjuvant for cancer radiotherapy and immunotherapy

Zhusheng Huang et al. Nat Commun. .

Abstract

The irradiated tumor itself represents an opportunity to establish endogenous in situ vaccines. However, such in situ cancer vaccination (ISCV) triggered by radiation therapy (RT) alone is very weak and hardly elicits systemic anticancer immunity. In this study, we develop two-dimensional risedronate-manganese nanobelts (RMn-NBs) as an adjuvant for RT to address this issue. RMn-NBs exhibit good T2 magnetic resonance imaging performance and enhanced Fenton-like catalytic activity, which induces immunogenic cell death. RMn-NBs can inhibit the HIF-1α/VEGF axis to empower RT and synchronously activate the cGAS/STING pathway for promoting the secretion of type I interferon, thereby boosting RT-triggered ISCV and immune checkpoint blockade therapy against primary and metastatic tumors. RMn-NBs as a nano-adjuvant for RT show good biocompatibility and therapeutic efficacy, presenting a promising prospect for cancer radiotherapy and immunotherapy.


Conflict of interest statement

The authors declare no competing interests.

Figures

Fig. 1
Fig. 1. Schematic illustration of RMn-NB-sensitized RT for triggering potent ISCV.
a Schematically illustrating the preparation of RMn-NBs. b The mechanism of RMn-NBs as a visual nanoadjuvant for in situ vaccination of RT. Reactive oxygen species (ROS), glutathione (GSH), calreticulin (CRT), high mobility group protein B1 (HMGB1), adenosine triphosphate (ATP), dendritic cells (DCs), interferon-beta (IFN-β), interferon-gama (IFN-γ), hypoxia-inducible factor-1α (HIF-1α), vascular endothelial growth factor (VEGF), cyclic GMP-AMP synthase (cGAS), cyclic GMP-AMP (cGAMP), stimulator of interferon genes (STING). Created in BioRender. Luo, Z. (2024) BioRender.com/u37f450.
Fig. 2
Fig. 2. Preparation and characterization of RMn-NBs.
a Tyndall effect of RMn-NBs aqueous suspension. b TEM imaging of RMn-NBs, scale bar = 50 nm. This experiment is repeated twice independently with similar results. c PXRD of MnCl2, RANa, RMn-NBs. This experiment is repeated twice independently with similar results. d EDS mapping of RMn-NBs, scale bar = 50 nm. This experiment is repeated twice independently with similar results. High-resolution XPS spectra of (e) Mn 2p, (f) O 1s, and (g) N 1s of RMn-NBs (n = 3 independent samples). Arbitrary units (a. u.). h Electron spin resonance (ESR) spectra of ROS detection for different treatments, arbitrary units (a. u.). 2,2,6,6-tetramethyl-4-piperidinone (TEMP) is used as a trap for ROS (n = 3 independent samples). i Time-dependent GSH consumption after treating with RMn-NBs in a simulated tumor microenvironment (n = 3 independent samples). j Release profiles of RANa from RMn-NBs in different N-2-hydroxyethylpiperazine-N-ethane-sulphonicacid (HEPES) buffer solutions (pH = 7.4, 6.5, 5.5) containing 10% serum in vitro, respectively (n = 3 independent samples). All data are shown as mean ± SD. Statistical analysis is performed using two-tailed Student’s t-test for comparing two groups. p > 0.05 represent nonsignificance, while p < 0.05 indicate statistical significance. Source data are provided as a Source Data file.
Fig. 3
Fig. 3. Radiosensitization of RMn-NBs in vitro.
a GSH levels in CT26 cells detected by fluorescence thiol probe (green fluorescence) merged with DAPI, scale bar = 20 μm. b The percentage of GSH+ cells detected by flow cytometry (FCM) (n = 3 cell samples). c Intracellular ROS generation in CT26 cells detected by H2DCFDA (green fluorescence) merged with DAPI, scale bar = 20 μm. d The percentage of ROS+ cells detected by FCM (n = 3 cell samples). e Half-maximal inhibitory concentration (IC50) of RMn-NBs against 3T3 and CT26 cells (n = 3 cell samples). The cytotoxicity of PBS, RANa, MnCl2, and RMn-NBs against CT26 cells (f) without and (g) with X-ray irradiation (6 Gy × 1) (n = 3 cell samples). All data are shown as mean ± SD. All experiments are repeated twice independently with similar results. Statistical analysis is performed using two-tailed Student’s t-test for comparing two groups, and one-way ANOVA analysis of variance for multiple groups. p > 0.05 represent nonsignificance, while p < 0.05 indicate statistical significance. Source data are provided as a Source Data file.
Fig. 4
Fig. 4. MRI and pharmacokinetics of RMn-NBs in vitro and in vivo.
a Measuring the longitudinal relaxation rates (r1) of RMn-NBs and commercial Fe3O4 contrast agent (n = 3 independent samples). b Measuring the transverse relaxation rates (r2) of RMn-NBs and commercial Fe3O4 contrast agent (n = 3 independent samples). c T2-weighted MRI of RMn-NBs and commercial Fe3O4 contrast agent (n = 3 independent samples). d Dynamic MRI after intravenous injection of RMn-NBs (10 mM × 0.2 mL) in CT26 tumor. The doses of Mn2+ and RANa are 5.5 mg kg−1 and 30.5 mg kg−1, respectively (n = 3 mice). e Relative MRI signal intensities of tumor and kidney regions in the 4T1 tumor-bearing mice at various time points (n = 3 mice). The dynamic concentrations of Mn2+ accumulated within (f) tumor and (g) kidney in the 4T1 tumor-bearing mice determined by inductively coupled plasma optical emission spectrometer (ICP-OES), respectively (n = 3 mice). h Pharmacokinetic profiles of free RANa and RMn-NBs in orthotopic 4T1 tumors. The dynamic concentrations of RANa accumulated within (i) tumor and (j) kidney of 4T1 tumor-bearing mice determined by HPLC, respectively (n = 3 mice). All data are shown as mean ± SD. Source data are provided as a Source Data file.
Fig. 5
Fig. 5. RNA sequencing of CT26 tumor tissues treated with RMn-NBs and RT.
a Venn plot indicates the gene expression relationship among groups (n = 3 mice). Differential gene volcano plots between (b) Saline and Saline + RT groups (n = 3 mice), (c) RMn-NBs and RMn-NBs + RT groups (n = 3 mice), (d) Saline + RT and RMn-NBs + RT groups (n = 3 mice), indicating the number of up- or down-regulated gene expressions. e GO enrichment analysis between Saline + RT and RMn-NBs + RT groups (n = 3 mice). f Differential gene clustering heatmap between Saline + RT and RMn-NBs + RT groups (n = 3 mice). Statistical analysis is performed using two-tailed Student’s t-test for comparing two groups, and one-way ANOVA analysis of variance for multiple groups. p > 0.05 represent nonsignificance, while p < 0.05 indicate statistical significance. The raw sequence data reported in this paper have been deposited in the Genome Sequence Archive (BioProject: PRJCA024822 and GSA: CRA019291).
Fig. 6
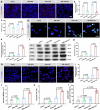
Fig. 6. HIF-1α/VEGF inhibition and cGAS-STING activation-enhanced ICD for ISCV.
a Immunofluorescent images of tumor slices stained with anti-HIF−1α antibody, scale bar = 20 μm (n = 3 mice). b Relative fluorescence intensity of HIF−1α after various treatments (n = 3 mice). c Detection of cytoplasmic VEGF-A by ELISA kit (n = 3 mice). d Representative images of PicoGreen and DAPI co-stained CT26 cells after treatments with Saline, RMn-NBs, Saline + RT (6 Gy × 1) and RMn-NBs + RT (6 Gy × 1), scale bar = 20 μm (n = 3 cell samples). The white arrows indicated damaged DNA fragments. e Relative fluorescence intensity of cytoplasmic DNA in PicoGreen-stained CT26 cells at 24 h post X-ray irradiation (n = 3 cell samples). f Western blot of IRF3, p-IRF3, STING, p-STING, and β-actin (an internal reference protein). g Detection of cytoplasmic IFN-β by ELISA kit (n = 3 cell samples). h Immunofluorescence of CT26 cells stained with anti-CRT antibody, scale bar = 20 μm. i Relative fluorescence intensity of CRT after various treatments (n = 3 cell samples). j Detection of cytoplasmic HMGB1 by ELISA kit (n = 3 cell samples). k Detection of extracellular ATP by Luciferin-based ATP assay kit (n = 3 cell samples). l FCM analysis of DCs maturation (CD80+ and CD86+ gated within CD11c+) in tumor-draining lymph nodes (TDLNs) (n = 6 mice). All data are shown as mean ± SD. All experiments are repeated twice independently with similar results. Statistical analysis is performed using two-tailed Student’s t-test for comparing two groups, and one-way ANOVA analysis of variance for multiple groups. p > 0.05 represent nonsignificance, while p < 0.05 indicate statistical significance. Source data are provided as a Source Data file.
Fig. 7
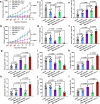
Fig. 7. ISCV of RMn-NB-sensitized RT.
a Primary and (b) distant tumor growth curves of CT26 colorectal bilateral tumor-bearing mice treated with Saline, Saline + RT, RMn-NBs + RT, RMn-NBs + RT + αCD8a and RMn-NBs + RT + αPD-L1. The doses of Mn2+ and RANa are 5.5 mg kg−1 and 30.5 mg kg−1, respectively. X-ray irradiation is performed after intravenous injection of RMn-NBs (10 mM × 0.2 mL) for 6 h. Treatments are performed with 3 fractions (total 6 Gy) on days 0, 3, and 6, and only primary tumors receive RT (black arrow). αPD-L1 (10 mg kg−1) and αCD8a (10 mg kg−1) are intraperitoneally injected respectively after RT for 6 h, and treatments are performed on days 0, 3, 6, and 9 (red arrow, n = 6 mice). c Primary and (d) distant tumor weights from mice with various treatments (n = 6 mice). The percentages of CD3+ CD4+ T cells infiltrated within (e) primary and (f) distant tumor tissues detected by FCM (n = 6 mice). The percentages of CD3+ CD8+ T cells infiltrated within (g) primary and (h) distant tumor tissues detected by FCM (n = 6 mice). The percentages of FoxP3+ T cells (Tregs) among CD3+ CD4+ T cells infiltrated within (i) primary and (j) distant tumor tissues detected by FCM (n = 6 mice). Relative content of IFN-γ in the (k) primary and (l) distant tumor tissues detected by ELISA kit (n = 6 mice). All data are shown as mean ± SD. Statistical analysis is performed using two-tailed Student’s t-test for comparing two groups, and one-way ANOVA analysis of variance for multiple groups. p > 0.05 represent nonsignificance, while p < 0.05 indicate statistical significance. Source data are provided as a Source Data file.
Fig. 8
Fig. 8. Enhanced radioimmunotherapy with RMn-NBs in B16F10-OVA tumor models.
a Tumor growth curves of B16F10-OVA tumor-bearing C57BL/6 mice treated with Saline, Saline + RT, RMn-NBs + RT, RMn-NBs + RT + αCD8a and RMn-NBs + RT + αPD-L1. Treatments are performed with 3 fractions on days 0, 2, and 4 (black arrow). αPD-L1 and αCD8a are intraperitoneally injected respectively after RT for 6 h (red arrow, n = 6 mice). b Tumor weights from mice with various treatments (n = 6 mice). c F4/80+ and CD11b+ macrophages in B16F10-OVA tumor-bearing C57BL/6 mice with different treatments detected by FCM (n = 6 mice). d FCM analysis of CD11c+ H2Kb-SIINFEKL+ DCs in tumor-draining lymph nodes from mice treated with Saline, Saline + RT, RMn-NBs + RT, RMn-NBs + RT + αCD8a and RMn-NBs + RT + αPD-L1 (n = 6 mice). e Mature DCs (CD80+ and CD86+ gated on CD11c+) in B16F10-OVA tumor-bearing C57BL/6 mice with different treatments detected by FCM (n = 6 mice). f The percentages of CD3+ CD4+ T cells infiltrated within tumor tissues detected by FCM (n = 6 mice). g The percentages of CD3+ CD8+ T cells infiltrated within tumor tissues detected by FCM (n = 6 mice). h Percentages of effector memory T cells (TEM) in the spleen analyzed by FCM. The spleens in different groups are collected on day 10 (n = 6 mice). i The quantification of antigen-specific T cells by IFN-γ ELISpot (n = 3 mice). j The representative images of antigen-specific T cells by IFN-γ ELISpot. This experiment is repeated twice independently with similar results. All data are shown as mean ± SD. Statistical analysis is performed using two-tailed Student’s t-test for comparing two groups, and one-way ANOVA analysis of variance for multiple groups. p > 0.05 represent nonsignificance, while p < 0.05 indicate statistical significance. Source data are provided as a Source Data file.
Fig. 9
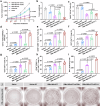
Fig. 9. In vivo long-term immune memory induced by RMn-NB-sensitized RT.
a Schematic illustration of in situ vaccination mediated by RMn-NB-sensitized RT. Created in BioRender. Luo, Z. (2024) BioRender.com/n85g329. b Tumor growth curves, (c) isolated tumor photographs, and (d) tumor weights of BALB/c mice immunized with Saline + RT and RMn-NBs + RT-treated CT26 tumor cells, respectively (n = 6 mice). e Percentages of TEM in the spleen analyzed by FCM. The spleens in different groups are collected on day 30 (n = 6 mice). f Tumor growth curves of 4T1 breast tumor-bearing mice treated with Saline, Saline + RT, RMn-NBs + RT, RMn-NBs + RT + αCD8a and RMn-NBs + RT + αPD-L1 (n = 6 mice). The doses of Mn2+ and RANa are 5.5 mg kg−1 and 30.5 mg kg−1, respectively. X-ray irradiation is performed after intravenous injection of RMn-NBs (10 mM × 0.2 mL) for 6 h. Treatments are performed with 3 fractions (total 6 Gy) on days 0, 3, and 6. αCD8a (10 mg kg−1) and αPD-L1 (10 mg kg−1) are respectively administered via intraperitoneal injection after RT for 6 h, and treatments are performed on days 0, 3, and 6 (n = 6 mice). g Weights of 4T1 breast tumor after various treatments (n = 6 mice). h Survival curves of 4T1 breast tumor-bearing mice (n = 6 mice). i Quantification of metastatic lesions in the lungs (n = 6 mice). j Average size of each nodule in the lungs (n = 6 mice). All data are shown as mean ± SD. Statistical analysis is performed using two-tailed Student’s t-test for comparing two groups, and one-way ANOVA analysis of variance for multiple groups. p > 0.05 represent nonsignificance, while p < 0.05 indicate statistical significance. Source data are provided as a Source Data file.

References

    1. Petroni, G. et al. Radiotherapy as a tool to elicit clinically actionable signalling pathways in cancer. Nat. Rev. Clin. Oncol.19, 114–131 (2022). - PMC - PubMed
    1. Galluzzi, L. et al. Emerging evidence for adapting radiotherapy to immunotherapy. Nat. Rev. Clin. Oncol.20, 543–557 (2023). - PubMed
    1. Ngwa, W. et al. Using immunotherapy to boost the abscopal effect. Nat. Rev. Cancer18, 313–322 (2018). - PMC - PubMed
    1. Lin, M. J. et al. Cancer vaccines: the next immunotherapy frontier. Nat. Cancer3, 911–926 (2022). - PubMed
    1. Chen, J. et al. In situ cancer vaccination using lipidoid nanoparticles. Sci. Adv.7, eabf1244 (2021). - PMC - PubMed

Publication types

LinkOut - more resources