. 2024 Oct 7;15(1):8682.
doi: 10.1038/s41467-024-52968-1.

Compensatory activity of the PC-ME1 metabolic axis underlies differential sensitivity to mitochondrial complex I inhibition

Affiliations

Compensatory activity of the PC-ME1 metabolic axis underlies differential sensitivity to mitochondrial complex I inhibition

Lucia Del Prado et al. Nat Commun. .

Abstract

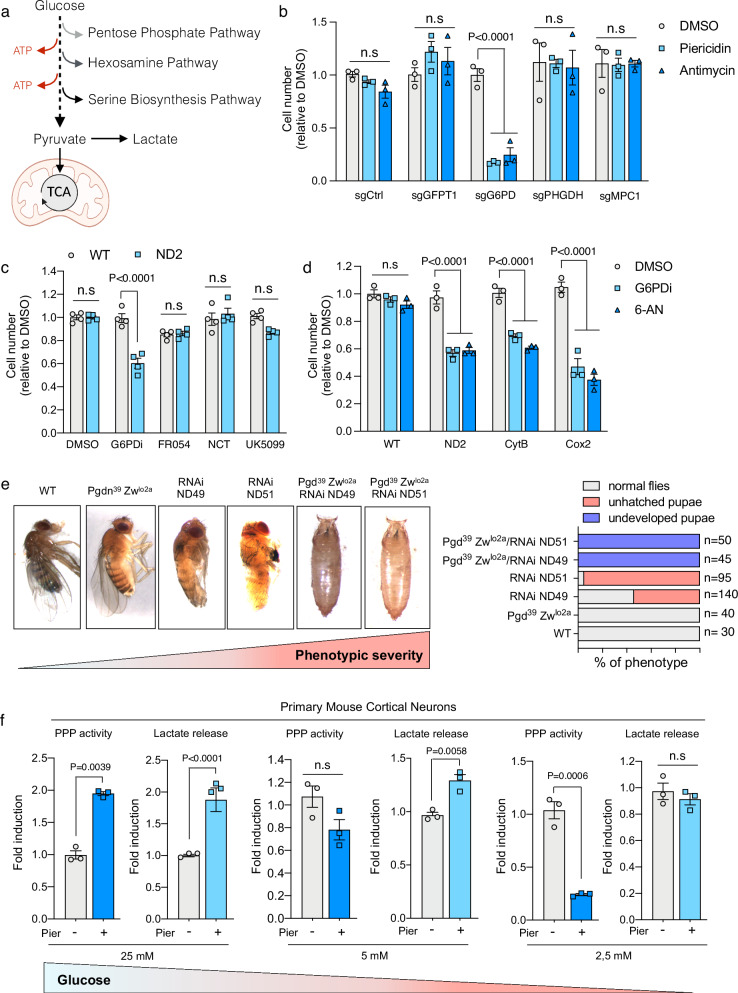
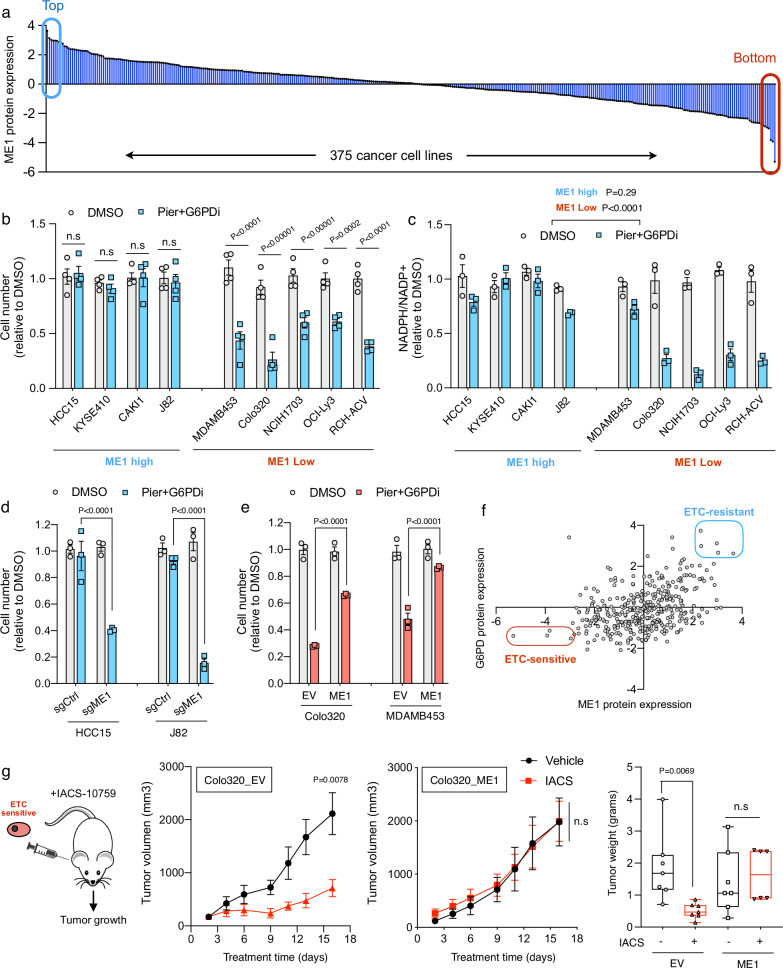
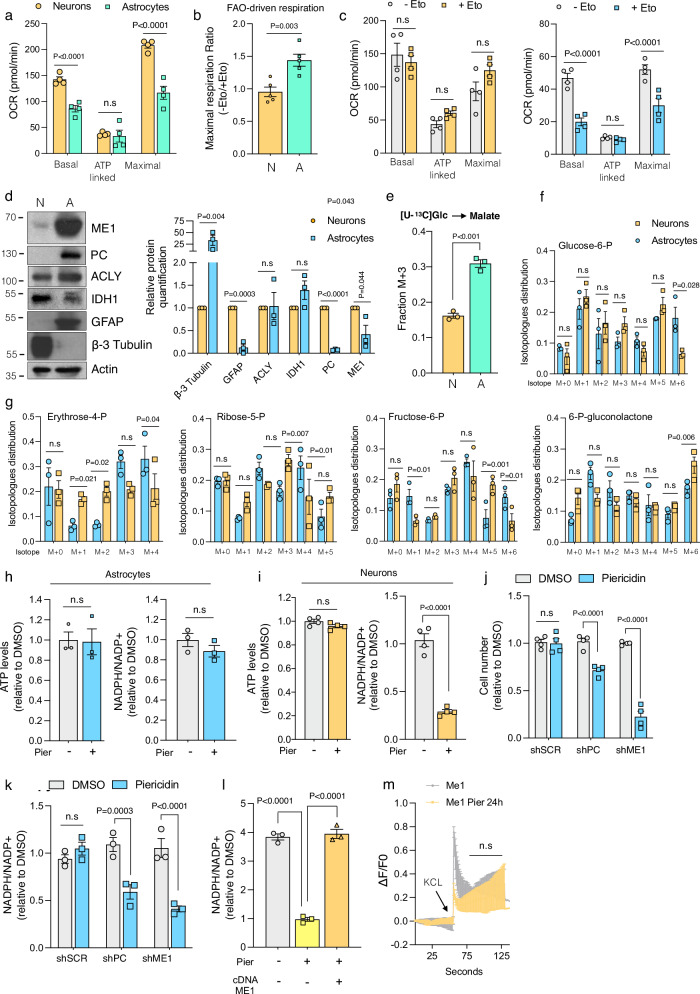
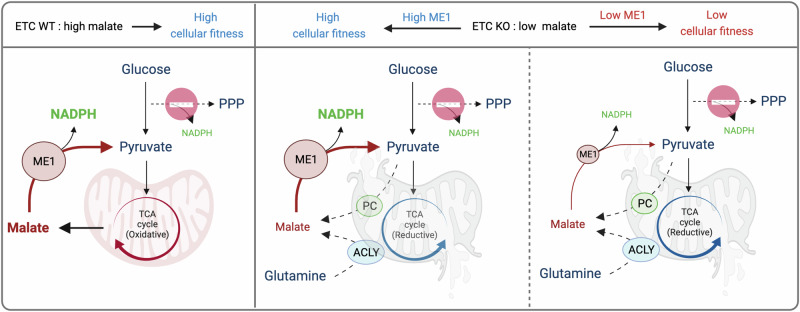
Deficiencies in the electron transport chain (ETC) lead to mitochondrial diseases. While mutations are distributed across the organism, cell and tissue sensitivity to ETC disruption varies, and the molecular mechanisms underlying this variability remain poorly understood. Here we show that, upon ETC inhibition, a non-canonical tricarboxylic acid (TCA) cycle upregulates to maintain malate levels and concomitant production of NADPH. Our findings indicate that the adverse effects observed upon CI inhibition primarily stem from reduced NADPH levels, rather than ATP depletion. Furthermore, we find that Pyruvate carboxylase (PC) and ME1, the key mediators orchestrating this metabolic reprogramming, are selectively expressed in astrocytes compared to neurons and underlie their differential sensitivity to ETC inhibition. Augmenting ME1 levels in the brain alleviates neuroinflammation and corrects motor function and coordination in a preclinical mouse model of CI deficiency. These studies may explain why different brain cells vary in their sensitivity to ETC inhibition, which could impact mitochondrial disease management.


Conflict of interest statement

The authors declare no competing interests. We support inclusive, diverse, and equitable conduct of research.

Figures

Fig. 1
Fig. 1. Cells and tissues with mitochondrial dysfunction rely on PPP activity for survival.
a Scheme illustrating metabolic pathways that rely on glucose. b Cell number of the indicated CRISPR-mediated knock-out cells treated either with complex I inhibitor Piericidin (100 nM) or Antimycin (500 nM) for 72 h (n = 3 biological replicates). c Cell number at 72 h of WT and ND2 mutant cybrid cells treated with inhibitors that selectively target the following pathways: G6PDi inhibits PPP (50 uM), FR054 (100 uM) inhibits the hexosamine biosynthetic pathway, NCT-503 (10 uM) inhibits the serine biosynthesis pathway and UK5099 (10uM) inhibits the mitochondrial pyruvate carrier (n = 4 biological replicates). d Cell number at 72 h of WT, ND2, CytB and Cox2 mutant cybrid cells treated with the PPP inhibitors G6PDi (50 uM) and 6-Aminonicotinamide (6AN) (5 uM) (n = 3 biological replicates). e Representative photographs of WT and mutant flies showing the increased severity of the phenotype (left) and subsequent quantification (right). f Analysis of PPP activity and lactate secretion as a proxy for glycolytic flux in primary mouse cortical neurons cultured under 25 mM, 5 mM or 2,5 mM D-glucose media that have been treated with Piericidin (100 nM) for 16 h (n = 3 biological replicates). Data are presented as means ± SEM. The statistical significance of the differences between groups was determined by two-way ANOVA (b, c and d) and paired two-tailed Student’s t test (f). n.s not significant. Pier Piericidin, 6-AN 6-Aminonicotinamide. Source data are provided as a Source Data file. Figure 1a was created with BioRender.com released under a Creative Commons Attribution-NonCommercial-NoDerivs 4.0 International license.
Fig. 2
Fig. 2. Synthetic lethality between PPP and OXPHOS is reduced by increased ME1 expression.
a Growth curves of 143B cells treated with DMSO, Piericidin (100 nM), G6PDi PPP (50 uM), and the combination of both (n = 3 biological replicates). Heat map showing intracellular levels of water-soluble metabolites in 143B cells treated with the indicated inhibitors for 48 h (b) and relative levels of dihydroxyacetone phosphate (c), D-sedoheptulose-1,7-bisphosphate (d) and NADPH/NADP+ ratio (e) (n = 3 biological replicates). f NADPH/NADP+ ratio at 24 and 72 h in 143B cells treated with DMSO, Piericidin (100 nM), G6PDi PPP (50 uM), and the combination of both (n = 3). g Relative reactive oxygen species (ROS) levels measured using dichlorodihydrofluorescein diacetate (H2DCFDA) in 143B cells treated with DMSO or Piericidin (100 nM) plus G6PDi (50 uM) (n = 3). h Cell number at 72 h in 143B cells overexpressing ME1 or IDH1 and treated with DMSO or Piericidin (100 nM) plus G6PDi (50 uM) (n = 3 biological replicates). i Heat map showing intracellular levels of TCA cycle associated metabolites analyzed by LC-MS in DMSO-treated or Piericidin-treated (100 nM) 143B cells for 24 h (n = 3). j Relative reactive oxygen species (ROS) levels in WT and IDH1 overexpressing 143B cells treated with DMSO or Piericidin (100 nM) plus G6PDi (50 uM) and supplemented with 2 mM trimethyl citrate (n = 3 biological replicates). Data are presented as means ± SEM. The statistical significance of the differences between groups was determined by two-wayANOVA (a, c, d, e, f, g, h and j). n.s not significant. Pier Piericidin, TM-Citrate Trimethyl citrate. Source data are provided as a Source Data file.
Fig. 3
Fig. 3. CI inhibition elicits a metabolic reprogramming via PC and ACLY to enable the generation of malate and NADPH.
a Model illustrating the fate of uniformly labeled 13Cglucose after entering a fully functional TCA cycle (DMSO condition) or a truncated TCA cycle (Piericidin condition). CI inhibition decreases malate and aspartate M + 2 forms originated by oxidation of glucose-derived pyruvate in the TCA cycle and increases malate and aspartate M + 3 forms coming from carboxylation of pyruvate by the PC enzyme (n = 3). M + 3/M + 2 ratios of malate (b) and aspartate (c), which represent the proportional contribution of PC vs PDH to metabolite labeling (n = 3). d Cell number of sgCtrl and sgPC 143B cells treated with DMSO or Piericidin (100 nM) for 72 h (n = 3). e Cell number of sgCtrl, sgACLY and sgPC treated with the indicated inhibitors for 72 h (n = 3). f Levels of intracellular malate in 143B cells treated with the indicated inhibitors for 48 h (n = 3). g Labelling of M + 4 and M + 3 from uniformly labeled 13Cglutamine in sgCtrl and sgPC 143B cells treated with DMSO or Piericidin (100 nM) for 24 h (n = 3). h Cell number of sgCtrl, sgACLY, sgPC and double KO sgACLY/PC 143B cells treated with DMSO or Piericidin (100 nM) for 72 h (n = 3). i Levels of intracellular malate in sgCtrl and double KO sgACLY/PC 143B cells treated with DMSO or Piericidin (100 nM) for 72 h (n = 3). Data are presented as means ± SEM. The statistical significance of the differences between groups was determined by two-way ANOVA (ai). n.s not significant. Source data are provided as a Source Data file. Figure 3a was created with BioRender.com released under a Creative Commons Attribution-NonCommercial-NoDerivs 4.0 International license.
Fig. 4
Fig. 4. Cancer sensitivity to OXPHOS inhibitors is determined by ME1 expression levels.
a In silico analysis of ME1 protein expression extracted from mass spectrometry data across 375 cell line collections including the Cancer Cell Line Encyclopedia (CCLE). Cell number (b) and NADPH/NADP+ ratio (c) in ME1 high and ME1 low cell lines treated with DMSO or Piericidin (100 nM) plus G6PDi (50 uM) for 96 h (n = 4 and n = 3). Cell number in Piericidin plus G6PDi treated ME1 high cell lines HCC15 and J82 where ME1 has been depleted by CRISPR (d) and ME1 low cell lines where ME1 has been ectopically overexpress (e) (n = 3). f Analysis correlating the protein expression of NADPH generating enzymes G6PD and ME1 in hundreds of cell lines. Highlighted in red are cells predicted to be sensitive to CI inhibition whereas in blue are those predicted to be insensitive. g Xenograft experiments using ME1 low Colo320 cells. Evolution of tumor growth (left) and final tumor weight (right) in mice injected with WT or ME1 overexpressing Colo320 and treated with vehicle or CI inhibitor IACS-10759 every other day (n = 7) Data presented as box-plot Min to Max. Data are presented as means ± SEM. The statistical significance of the differences between groups was determined by two-way ANOVA (be and g). n.s not significant. Pier Piericidin, ETC Electron Transport Chain, EV empty vector. Source data are provided as a Source Data file.
Fig. 5
Fig. 5. Distinct responses to mitochondrial complex I inhibition in astrocytes and neurons.
Seahorse Mito Stress Test analysis in neurons and astrocytes using Seahorse XF DMEM assay medium containing glucose, pyruvate and glutamine (a) or palmitate-BSA plus L-carnitine as substrates for respiration (n = 4) (b). FAO-driven respiration in neurons and astrocytes is calculated as the ratio between maximal respiration (FCCP) without etomoxir and with the addition of etomoxir, prior to the assay (n = 5). c Seahorse XF Mito Stress Test assay in neurons (left) and astrocytes (right) that were incubated with etomoxir for 30 mins prior the analysis, revealing distinct dependencies in FAO-driven respiration (n = 4). d Immunoblot and quantification showing expression of the indicated proteins in neurons (N) and astrocytes (A). GFAP was used as a specific marker for astrocytes whereas Beta Tubulin III was used as a marker for neurons. e Labelling of M + 3 malate coming from uniformly labeled 13Cglutamine in neurons (N) and astrocytes (A) (n = 3). f Isotopomer distribution of glucose-6-phosphate in neurons and astrocytes cultured in the presence of 13C glucose for 3 h (n = 3). g Isotopomer distribution of Erythrose 4-phosphate, Ribose-5-phosphate, Fructose-6-phosphate and 6-Phosphogluconolactone in neurons and astrocytes cultured in the presence of 13 C glucose for 3 h (n = 3). ATP levels and NADPH/NADP+ ratio in astrocytes (h) and neurons (i) treated with DMSO or Piericidin (100 nM) for 24 h (n = 3-4). Cell number (j) and NADPH/NADP+ ratio (k) in astrocytes, after ME1 or PC knockdown, that were treated either with DMSO or Piericidin (100 nM) for 96 h (n = 4). l NADPH/NADP+ ratio in neurons overexpressing ME1 and treated with DMSO or Piericidin (100 nM) for 24 h (n = 3). m Calcium response after stimulation with potassium chloride (KCl) in neurons overexpressing ME1 and treated with DMSO or Piericidin (100 nM) for 24 h. Data are presented as means ± SEM. The statistical significance of the differences between groups was determined by paired two-tailed Student’s t test (b, d, e, h and i) and two-way ANOVA (a, c, f, g, j, k, l and m). n.s not significant. Immunoblots shown are representative of >3 independent experiments. N Neurons, A Astrocytes, Pier Piericidin, KCL potassium chloride. Source data are provided as a Source Data file.
Fig. 6
Fig. 6. Boosting ME1 function alleviates neuroinflammation and enhances motor coordination in Ndufs4–/– mice.
a Schematic of delivering ME1 to the vestibular nuclei of Ndufs4−/− mice via stereotaxic injections. b Targeted metabolomic analysis conducted on the vestibular nuclei (VN) of mice injected with AAV9-Veh or AAV9-ME1 identified increased levels of NADPH and GSH, while no differences in NADP + , GSSG or ATP were observed. c Survival of Ndufs4−/− mice injected with AAV9-Veh or AAV9-ME1. (n = 8). d Rotarod performance of AAV9-Veh or AAV9-ME1 Ndufs4−/− injected mice, at 40 (Mid) and 50 days (Late). (n = 7). e Representative images and quantification of Iba-1 staining in the vestibular nuclei (VN) region of the brain. (n = 6) Data presented as box-plot Min to Max. Scale bar = 500 μm. Data are presented as means ± SEM. The statistical significance of the differences between groups was determined by two-sided unpaired Student’s t test (b and e) and two-way ANOVA (d). n.s not significant. Images shown are representative of >3 independent experiments. Veh Vehicle. Source data are provided as a Source Data file. Figure 6a was created with BioRender.com released under a Creative Commons Attribution-NonCommercial-NoDerivs 4.0 International license.
Fig. 7
Fig. 7. Model describing the role of mitochondria in maintaining NADPH homeostasis.
Proposed model showing how mitochondrial-derived malate in intact cells, can sustain NADPH levels in the absence of optimal PPP activity. Conversely, cells with severe impairments in the ETC redirect pyruvate and/or glutamine through non-canonical TCA cycle as sources to generate malate. Under these conditions, ETC-deficient cells heavily rely on ME1 expression to maintain NADPH levels and ensure cellular fitness. This figure was created with BioRender.com released under a Creative Commons Attribution-NonCommercial-NoDerivs 4.0 International license.

References

    1. Wallace, D. C. A mitochondrial paradigm of metabolic and degenerative diseases, aging, and cancer: a dawn for evolutionary medicine. Annu Rev. Genet39, 359–407 (2005). - PMC - PubMed
    1. DiMauro, S. & Schon, E. A. Mitochondrial respiratory-chain diseases. N. Engl. J. Med348, 2656–2668 (2003). - PubMed
    1. Yoshida, M., Muneyuki, E. & Hisabori, T. ATP synthase-a marvellous rotary engine of the cell. Nat. Rev. Mol. Cell Biol.2, 669–677 (2001). - PubMed
    1. Gorman, G. S. et al. Mitochondrial diseases. Nat. Rev. Dis. Prim.2, 16080 (2016). - PubMed
    1. Bennett, C. F., Latorre-Muro, P. & Puigserver, P. Mechanisms of mitochondrial respiratory adaptation. Nat. Rev. Mol. Cell Biol.23, 817–835 (2022). - PMC - PubMed

Publication types

MeSH terms

Supplementary concepts

LinkOut - more resources