. 2024 Oct 7;15(1):8683.
doi: 10.1038/s41467-024-52979-y.

Glycerophospholipid remodeling is critical for orthoflavivirus infection

Affiliations

Glycerophospholipid remodeling is critical for orthoflavivirus infection

Julia Hehner et al. Nat Commun. .

Abstract

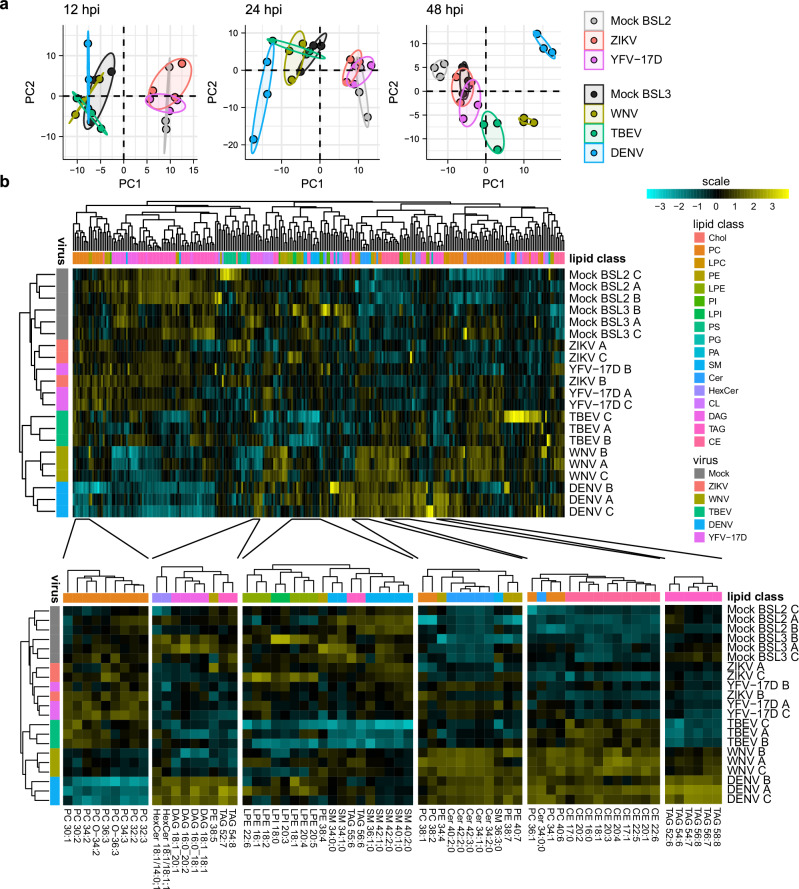
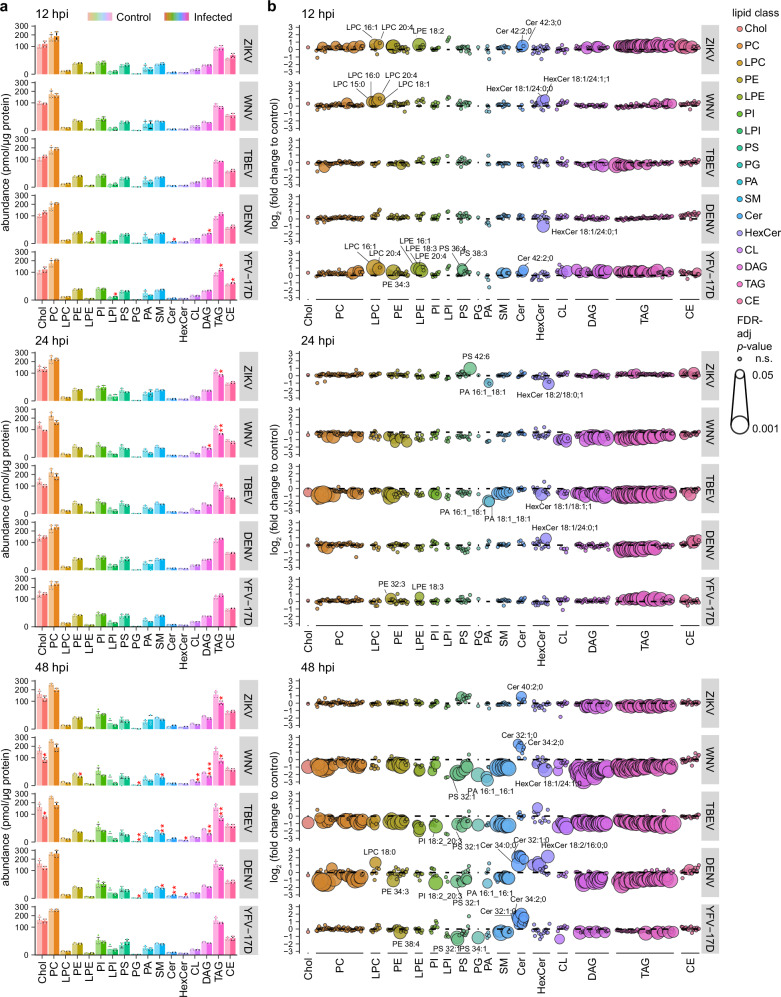
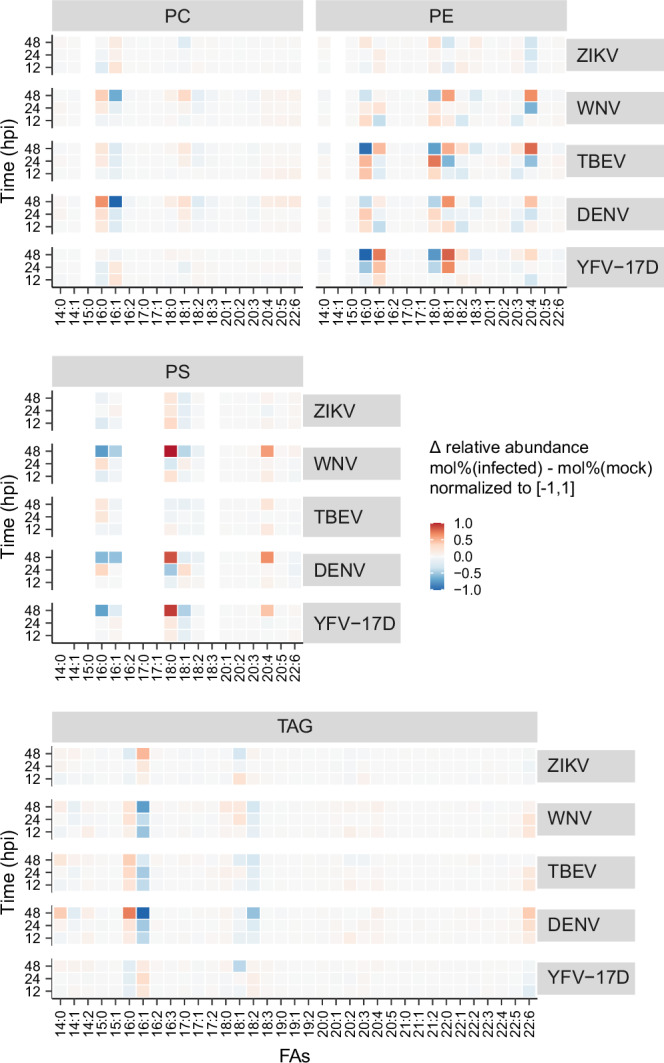
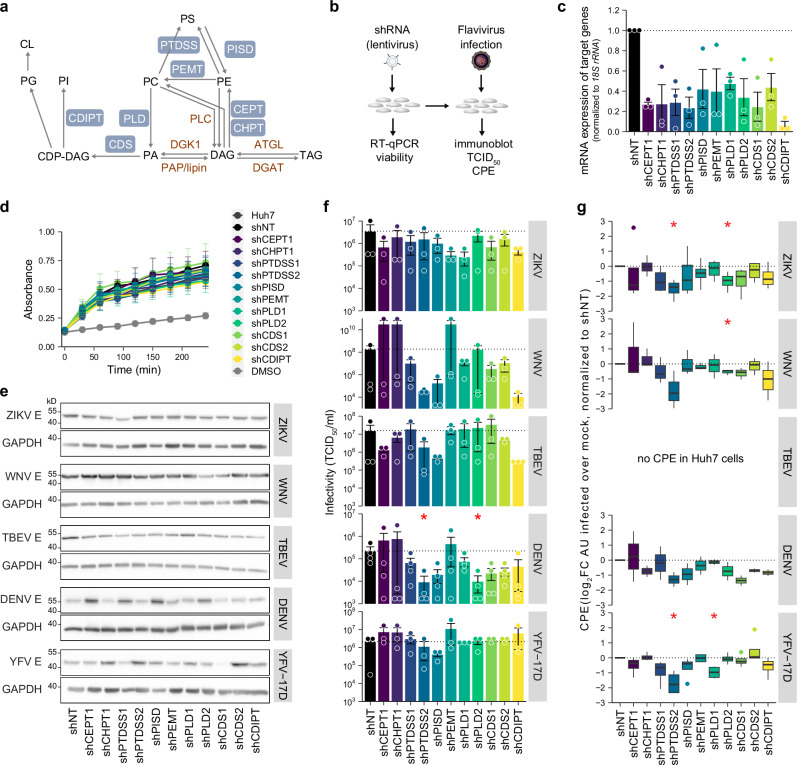
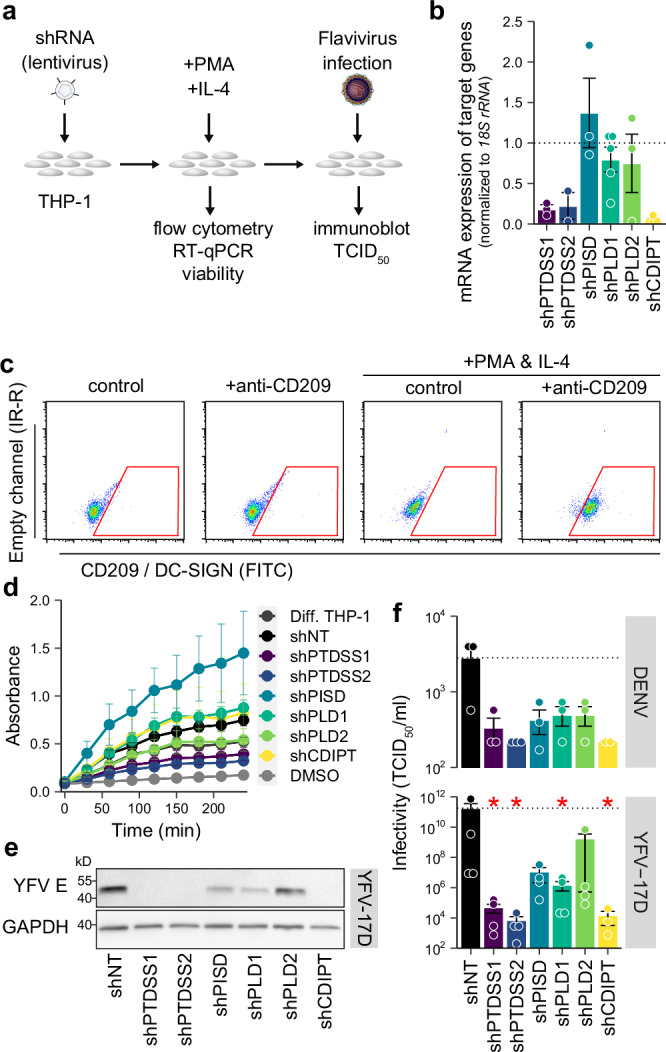
Flavivirus infection is tightly connected to host lipid metabolism. Here, we performed shotgun lipidomics of cells infected with neurotropic Zika, West Nile, and tick-borne encephalitis virus, as well as dengue and yellow fever virus. Early in infection specific lipids accumulate, e.g., neutral lipids in Zika and some lysophospholipids in all infections. Ceramide levels increase following infection with viruses that cause a cytopathic effect. In addition, fatty acid desaturation as well as glycerophospholipid metabolism are significantly altered. Importantly, depletion of enzymes involved in phosphatidylserine metabolism as well as phosphatidylinositol biosynthesis reduce orthoflavivirus titers and cytopathic effects while inhibition of fatty acid monounsaturation only rescues from virus-induced cell death. Interestingly, interfering with ceramide synthesis has opposing effects on virus replication and cytotoxicity depending on the targeted enzyme. Thus, lipid remodeling by orthoflaviviruses includes distinct changes but also common patterns shared by several viruses that are needed for efficient infection and replication.


Conflict of interest statement

The authors declare no competing interests.

Figures

Fig. 1
Fig. 1. Experimental setup and quality control of the lipidomic analysis of cells infected with different human pathogenic orthoflaviviruses.
a Huh7 cells were seeded 1 day prior to infection with the different orthoflaviviruses (ZIKV MOI 1, WNV MOI 0.01, TBEV MOI 1, DENV MOI 0.5, and YFV-17D MOI 0.005). 12, 24, and 48 h post infection (hpi) samples were taken for protein and RNA extraction, and fixed for immunofluorescence analysis. b Virus genome equivalents (GE) per µg total cellular RNA normalized to 18S rRNA measured via RT-qPCR (mean ± SEM, n = 3 independent experiments). c Cells were stained with antibodies against orthoflavivirus E protein (magenta), and BODIPY493/503 (green) and Hoechst (blue) were used to visualize lipid droplets (LDs) and nuclei, respectively. Scale bar 10 µm. d Quantification of lipid droplets from more than 45 individual cells from three independent experiments (median ± 95% CI, *p ≤ 0.05, **p ≤ 0.01, ***p ≤ 0.001, unpaired two-tailed Mann–Whitney U test). e Samples were analyzed by immunoblotting with orthoflavivirus E protein and GAPDH antibodies (shown is one representative experiment of three independent experiments). Source data are provided as a Source Data file.
Fig. 2
Fig. 2. Pathogenic orthoflaviviruses induce distinct changes in the lipidome of infected cells.
a Huh7 cells infected with the different orthoflaviviruses were subjected to lipid and protein extraction and analyzed by direct infusion tandem mass spectrometry. Principal component analysis (PCA) of the lipidomics dataset. Relative lipid species abundance (Supplementary Data 1, sheet mol%) was used for the analysis. Single dots represent the different independent experiments. b Hierarchical clustering of lipid species (mol%) and samples of the 48 hpi dataset. Lipid species concentrations were log2-transformed and centered to the mean. Only lipid species that were detected in 90% of the samples (277 lipids) were used for clustering. Hierarchical clustering was calculated for individual samples as well as for lipid species using Euclidean distance metric and complete linkage clustering method.
Fig. 3
Fig. 3. Orthoflaviviruses remodel the lipidome of infected cells.
a Bar graphs depict the lipid class amount (pmol) per µg protein (mean ± SD, n = 3, *p ≤ 0.05, **p ≤ 0.01, ***p ≤ 0.001, FDR-adjusted p value, unpaired two-tailed Welch’s t-test). b Shown is the lipid amount (pmol) per µg protein of all species in lipid class as mean log2 fold change between infected cells and mock controls at 12, 24, and 48 hpi (n = 3 independent experiments). FDR-adjusted p values (unpaired two-tailed Welch’s t-test) are indicated by the size of the points. Lipid species are ordered according to molecular mass from left to right. hpi hours post infection, Chol cholesterol, PC phosphatidylcholine, LPC lyso-PC, PE phosphatidylethanolamines, LPE lyso-PE, PI phosphatidylinositol, LPI lyso-PI, PS phosphatidylserine, PG phosphatidylglycerol, PA phosphatidic acid, SM sphingomyelins, Cer ceramide, HexCer hexosyl-ceramide, DAG diglycerides, TAG triglycerides, CE cholesterol ester. Source data are provided as Supplementary Data S1, sheet pmol_ug.
Fig. 4
Fig. 4. Profound glycerophosholipid remodeling in orthoflavivirus infection.
a Analysis of the lipidomics dataset using BioPan pathway analysis. Lipid species abundance (Supplementary Data 1, sheet pmol_ug) was used for the analysis. Predicted reaction activities between lipid classes are indicated by arrows (red indicates increased and blue decreased reaction activities). Color of lipid classes indicate log2 fold change in abundance per µg protein of infected versus uninfected cells (n = 3 independent experiments). b Upper left triangle: BioPan prediction of Z scores of active (red) and suppressed (blue) enzyme activities using the standard settings (Z > 1.645 at p < 0.05),. Lower right triangle: log2 fold change of expression level determined by transcriptome analysis of the same samples. Source data are provided as a Source Data file.
Fig. 5
Fig. 5. Fatty acid composition of membrane phospholipids and triglycerides changes following orthoflavivirus infection.
We determined the relative abundance (mol%) of FAs in PC, PE, PI, PS, and TAG and calculated the difference between infected and uninfected control cells for each lipid class (Δ relative abundance: mol% (infected) − mol% (mock), normalized to [−1, 1]). Heatmaps illustrate the Δ relative abundances of FAs in PC, PE, PI, PS, and TAG. Shown is the mean of three independent experiments. Red and blue depict increases and decreases, respectively, and gray indicates NA. Source data are provided as Supplementary Data 2.
Fig. 6
Fig. 6. Pro- and antiviral function of ceramide biosynthesis and fatty acid desaturation.
a Scheme of the target enzymes and respective inhibitors. b Huh7 cells were treated with the inhibitors 48 h prior to infection with the different orthoflaviviruses (ZIKV MOI 0.1, WNV MOI 0.001, TBEV MOI 0.05, DENV MOI 0.05, and YFV-17D MOI 0.005). After infection, the respective inhibitors were added again, followed by analysis of viral protein expression level by immunoblot, determination of viral titers (TCID50), or analysis of cytopathic effects (CPE). c Cell viability was analyzed 72 h post treatment with different inhibitors. Treatment with 10% DMSO served as dead control (mean ± SEM, n = 3 independent experiments). d Intracellular levels of orthoflavivirus E protein were assessed by immunoblotting at 2 dpi. Shown is one representative blot (n = 4 (ZIKV, YFV-17D, WNV) or n = 5 (TBEV, DENV) independent experiments). e Virus titers in inhibitor-treated infected cells were determined by TCID50 titration at 2 dpi (mean ± SEM, n = 5 (DENV, TBEV, YFV-17D, ZIKV) or n = 4 (WNV) independent experiments, except for SPTi (all viruses), DENV (cPLA2i) and TBEV (SPTi): one experiment excluded due to contamination, *p ≤ 0.05, **p ≤ 0.01, unpaired two-tailed Mann–Whitney U test). f Cells were fixed at 3 dpi, surviving cells stained with crystal violet, and CPE was quantified using ImageJ. Box-and-whisker plot indicates CPE as log2 fold change infected over mock, normalized to DMSO control (center line: median, box limits: upper and lower quartiles, whiskers: 1.5 × interquartile range, points: outliers, n = 4 (ZIKV, DENV, WNV) or n = 5 (YFV-17D) independent experiments, *p ≤ 0.05, **p ≤ 0.01, unpaired two-tailed one sample Student’s t-test). dpi days post infection. Source data are provided as a Source Data file.
Fig. 7
Fig. 7. Phosphatidylserine turnover and phosphatidylinositol biosynthesis are required for orthoflavivirus infection and replication.
a Scheme of the synthesis of glycerolipids and glycerophospholipids. Target enzymes are indicated in blue. b Huh7 cells were transduced with lentiviruses carrying shRNAs targeting the different enzymes or a non-targeting (NT) shRNA followed by an infection with different orthoflaviviruses 4 dpt (ZIKV MOI 0.1, WNV MOI 0.001, TBEV MOI 0.05, DENV MOI 0.05, and YFV-17D MOI 0.005). Cells were used for validation of the lentiviral constructs and for analysis of viral protein expression level by immunoblot, determination of viral titers (TCID50), or analysis of cytopathic effects (CPE). c shRNA-knockdown efficiency of the targets was determined by RT-qPCR 4 dpt. Shown are mRNA expression levels of the corresponding enzymes relative to shNT and normalized to 18S rRNA (mean ± SEM, n = 3 independent experiments). d Cell viability was determined 5 dpt. Treatment with 10% DMSO served as non-viable control (mean ± SEM, n = 3 independent experiments). e Intracellular levels of viral E protein were assessed by immunoblotting at 2 dpi. Shown is one representative immunoblot (n = 3 (TBEV) or n = 4 (ZIKV, WNV, DENV, YFV-17D) independent experiments). f Virus titers in shRNA-transduced infected cells were determined by TCID50 titration at 2 dpi (mean ± SEM, n = 3 (ZIKV, TBEV, YFV-17D, WNV) or n = 4 (DENV) independent experiments, *p ≤ 0.05, unpaired two-tailed Mann–Whitney U test). g Cells were fixed at 3 dpi and cells were stained with crystal violet staining. CPE was quantified using ImageJ. Box-and-whisker plot indicates CPE as log2 fold change of infected over mock control, normalized to shNT (center line: median, box limits: upper and lower quartiles, whiskers: 1.5 × interquartile range, points: outliers, n = 2 (DENV), n = 4 (WNV, YFV-17D), or n = 6 (ZIKV) independent experiments, *p ≤ 0.05, unpaired two-tailed one sample Student’s t-test). dpt days post transduction, dpi days post infection. Source data are provided as a Source Data file.
Fig. 8
Fig. 8. Impaired phospholipid remodeling reduces viral particle production but does not affect virus entry or RNA replication and protein expression.
a shRNA-transduced Huh7 cells were infected at 4 dpt with high MOIs (ZIKV MOI 2, WNV MOI 5, DENV MOI 2, TBEV MOI 10, and YFV-17D MOI 5). Virus entry was determined by measuring viral genome equivalents (GE) 4 h post infection using RT-qPCR (mean ± SEM, technical duplicates from 2 to 3 independent experiments, non-significant in unpaired two-tailed Welch’s t-test). b, c Transduced Huh7 cells were infected with low MOIs 4 dpt (ZIKV MOI 0.1, WNV MOI 0.001, TBEV MOI 0.05, DENV MOI 0.05, and YFV-17D MOI 0.005) and analyses were performed at 2 dpi. b Intracellular viral RNA (vRNA) was quantified using RT-qPCR (mean ± SEM, n = 4 (DENV), or n = 5 (ZIKV, TBEV, WNV, YFV) independent experiments, non-significant in unpaired two-tailed Welch’s t-test) and the viral envelope/E protein level was determined by immunoblot analysis. Box-and-whisker plot indicates E protein expression as log2 fold change over shNT (center line: median, box limits: upper and lower quartiles, whiskers: 1.5 × interquartile range, points: outliers, n = 3 (TBEV, YFV-17D) or n = 4 (ZIKV, WNV, DENV) independent experiments, non-significant in unpaired two-tailed one sample Student’s t-test). c Extracellular vRNA was quantified by RT-qPCR (mean ± SEM, n = 4 (ZIKV, YFV-17D) or n = 5 (TBEV, WNV, DENV) independent experiments, non-significant in unpaired two-tailed Welch’s t-test) and E protein levels in the supernatant by immunoblot analysis. Box-and-whisker plot indicates E protein levels as log2 fold change over shNT (center line: median, box limits: upper and lower quartiles, whiskers: 1.5 × interquartile range, points: outliers, n = 2 (YFV-17D) or n = 5 (ZIKV, WNV, TBEV) independent experiments, *p ≤ 0.05, **p ≤ 0.01, ***p ≤ 0.001 unpaired two-tailed one sample Student’s t-test). dpt days post transduction, dpi days post infection. Source data are provided as a Source Data file.
Fig. 9
Fig. 9. Enzymes of the glycerophospholipid pathways are required for efficient infection of neurotropic orthoflaviviruses in human microglia cells.
a HMC3 cells were transduced with shRNAs targeting enzymes of the phospholipid pathway followed by infection with neurotropic orthoflaviviruses. b Knockdown efficiency was validated by RT-qPCR (mean ± SEM, n = 2 (shPTDSS1), n = 3 (shPLD1), n = 4 (shCDIPT, shPISD, shPTDSS2), or n = 5 (shPLD2) independent experiments). c Cell viability of shRNA-transduced HMC3 cells was determined at 4 dpt. shNT served as control and 10% DMSO-treated cells as non-viable control (mean ± SEM, n = 3). d Transduced HMC3 cells were infected at 4 dpt with neurotropic orthoflaviviruses (ZIKV MOI 0.005, WNV MOI 0.25, TBEV MOI 0.5) and E protein levels were determined by immunoblotting at 2 dpi. Shown is one representative immunoblot of three (TBEV, WNV) or four (ZIKV) independent experiments. e Determination of viral titers by TCID50 assays (mean ± SEM, n = 3–4, *p ≤ 0.05, unpaired two-tailed Mann–Whitney U test). dpt days post transduction, dpi days post infection. Source data are provided as a Source Data file.
Fig. 10
Fig. 10. Knockdown of enzymes of the glycerophospholipid pathway drastically reduces viral titers in CD209-positive THP-1 cells.
a THP-1 monocytes were transduced with shRNAs targeting proteins of the glycerophospholipid pathway. 4 dpt, cells were differentiated using IL-4 (20 ng/ml) and PMA (20 ng/ml) for 4 days prior to infection. b Knockdown efficiency was validated using RT-qPCR (mean ± SEM, n = 2 (shPTDSS1, shPTDSS2), n = 3 (shPISD, shPLD2), n = 4 (shCDIPT), or n = 5 (shPLD1) independent experiments). c Differentiation into CD209-positive THP-1 cells was confirmed 4 days after IL-4 and PMA treatment by flow cytometry using a CD209-specific antibody. Shown is one representative experiment. d Cell viability was analyzed 8 dpt and 4 days post differentiation (mean ± SEM, n = 3 independent experiments). e Knockdown cells were infected with YFV-17D (MOI 1) and the amount of E protein was analyzed by immunoblotting at 2 dpi. Shown is one representative blot of three independent experiments. f Infectivity in the supernatant of DENV (MOI 2) and YFV-17D (MOI 1) infected cells was determined using TCID50 assays at 2 dpi (mean ± SEM, n = 4 (YFV-17D) or n = 3 (DENV) independent experiments, except for shCDIPT: one experiment excluded due to contamination, *p ≤ 0.05, unpaired two-tailed Mann–Whitney U test). dpt days post transduction, dpi days post infection. Source data are provided as a Source Data file.

References

    1. Kuno, G., Chang, G. J., Tsuchiya, K. R., Karabatsos, N. & Cropp, C. B. Phylogeny of the genus Flavivirus. J. Virol.72, 73–83 (1998). - PMC - PubMed
    1. Pierson, T. C. & Diamond, M. S. The continued threat of emerging flaviviruses. Nat. Microbiol.5, 796–812 (2020). - PMC - PubMed
    1. Rupasinghe, R., Chomel, B. B. & Martinez-Lopez, B. Climate change and zoonoses: a review of the current status, knowledge gaps, and future trends. Acta Trop.226, 106225 (2022). - PubMed
    1. Hermance, M. E. & Thangamani, S. Powassan virus: an emerging arbovirus of public health concern in North America. Vector Borne Zoonotic Dis.17, 453–462 (2017). - PMC - PubMed
    1. Wagner, E. et al. First indications of Omsk haemorrhagic fever virus beyond Russia. Viruses14, 754 (2022). - PMC - PubMed

Publication types

Associated data