. 2024 Oct 7;15(1):7870.
doi: 10.1038/s41467-024-52125-8.

Direct observation of ion cyclotron damping of turbulence in Earth's magnetosheath plasma

Affiliations

Direct observation of ion cyclotron damping of turbulence in Earth's magnetosheath plasma

A S Afshari et al. Nat Commun. .

Abstract

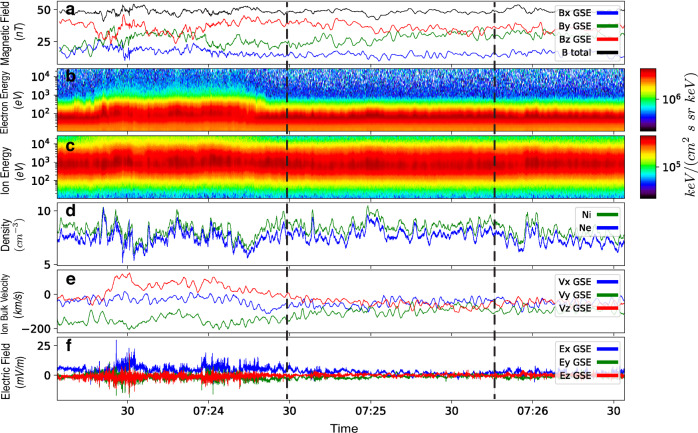
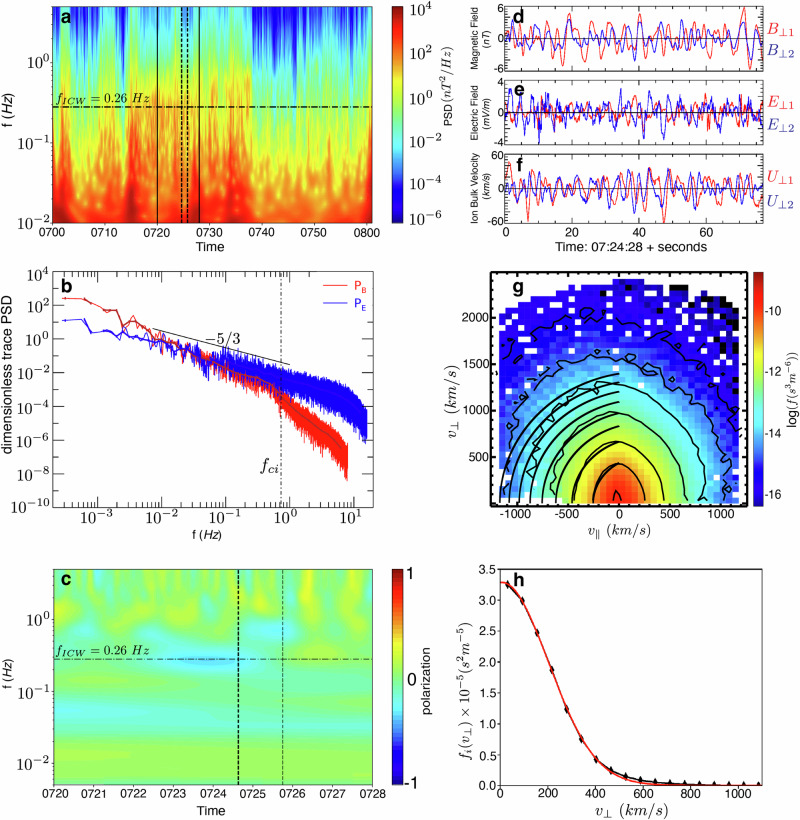
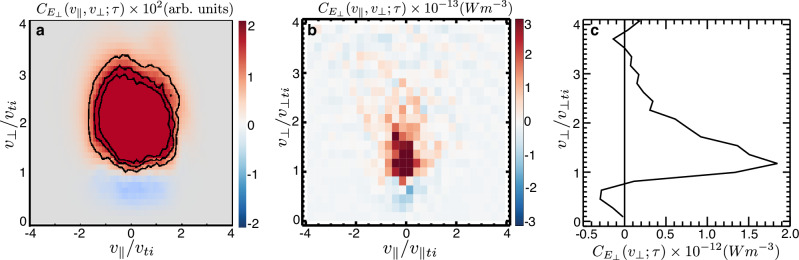
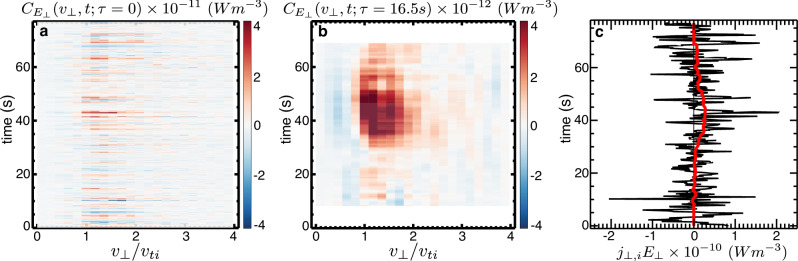
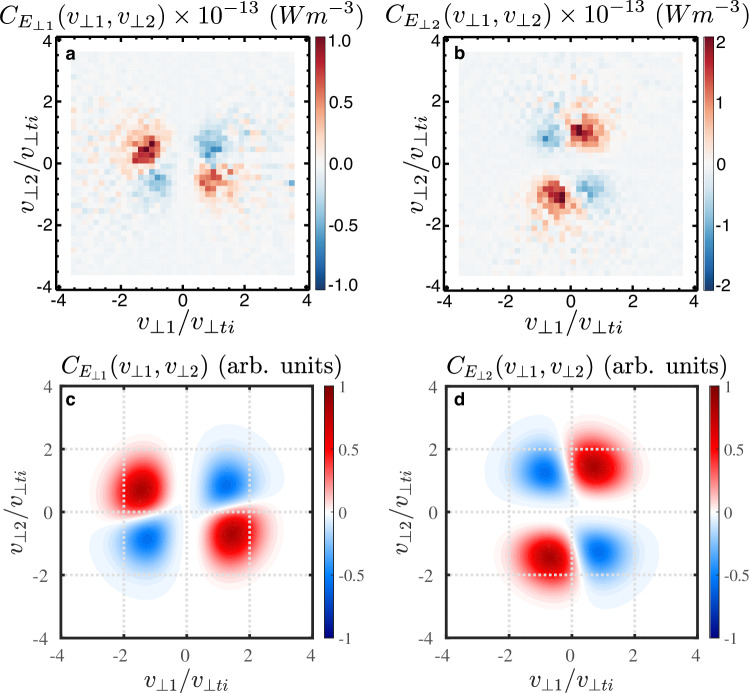
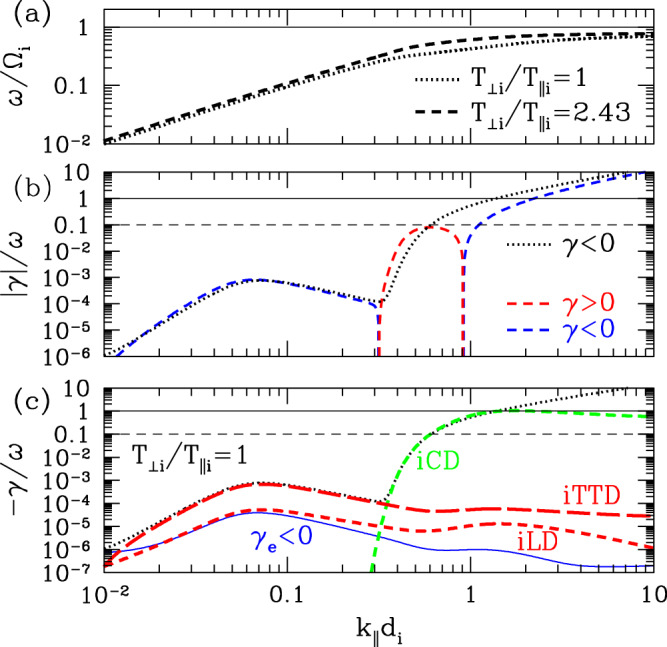
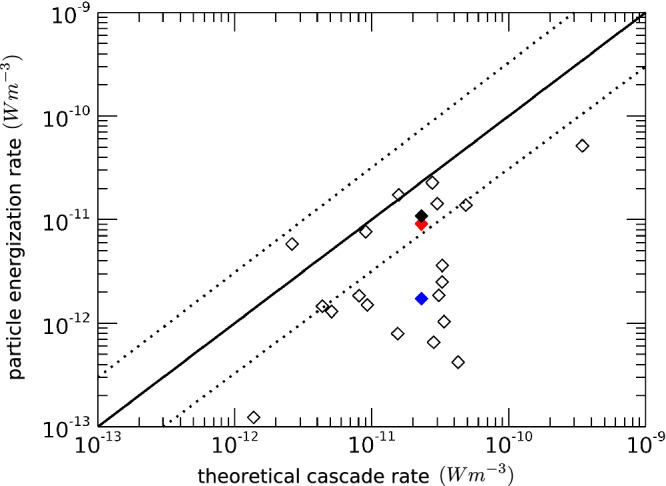
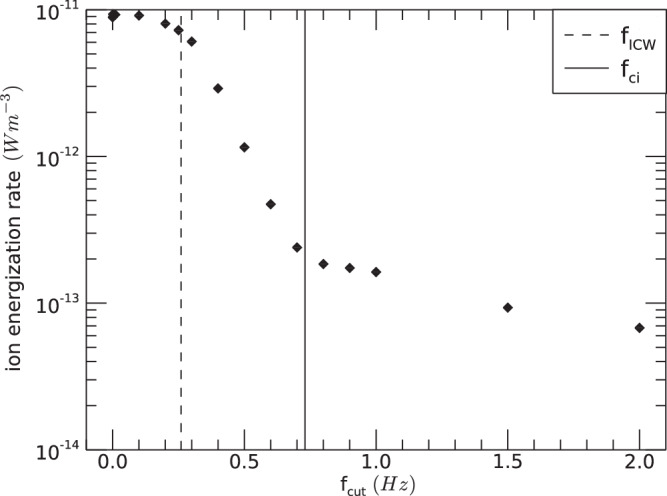
Plasma turbulence plays a key role in space and astrophysical plasma systems, enabling the energy of magnetic fields and plasma flows to be transported to particle kinetic scales at which the turbulence dissipates and heats the plasma. Identifying the physical mechanisms responsible for the dissipation of the turbulent energy is a critical step in developing the predictive capability for the turbulent heating needed by global models. In this work, spacecraft measurements of the electromagnetic fields and ion velocity distributions by the Magnetospheric Multiscale (MMS) mission are used to generate velocity-space signatures that identify ion cyclotron damping in Earth's turbulent magnetosheath, in agreement with analytical modeling. Furthermore, the rate of ion energization is directly quantified and combined with a previous analysis of the electron energization to identify the dominant channels of turbulent dissipation and determine the partitioning of energy among species in this interval.


Conflict of interest statement

The authors declare no competing interests.

Figures

Fig. 1
Fig. 1. MMS observations of magnetosheath turbulence.
Burst-mode data from MMS1 on 12 January 2016 starting at 07:23:04. a Magnetic field, (b) ion and (c) electron energy spectra, (d) ion and electron densities, (e) ion bulk velocity, and (f) electric field measurements. Dashed vertical lines delimit the 77 s interval analyzed here. Source data are provided as a Source Data file.
Fig. 2
Fig. 2. Evidence of ion cyclotron waves and ion distribution response.
a Magnetic field energy spectrum from MMS1 over 07:00–08:00 on 12 January 2016. Solid vertical lines indicate the 8 minute interval shown in c, dashed vertical lines indicate the 77 s burst-mode interval analyzed in this work, horizontal dashed-dotted line indicates the ion cyclotron wave frequency. b Dimensionless trace PSD of magnetic field (PB, red) and electric field (PE, blue) with spectral index of −5/3 (black) shown, vertical dashed-dotted line indicates the ion cyclotron frequency. c Magnetic field polarization from 07:20–07:28, where dashed vertical lines indicate the 77 s burst-mode interval; significant left-hand polarization is observed at frequency fICW ≃ 0.26 Hz (horizontal dashed-dotted line). Perpendicular components of (d) the magnetic field, (e) electric field, and (f) ion bulk velocity, all high-pass filtered at fcut = 0.1 Hz. g Background ion distribution f0i(vv) for the 77 s interval, with contours of constant energy (solid black) in the wave frame centered at vph = 0.7vA. h Reduced perpendicular ion distribution f0i(v) (black) with an overplotted Gaussian fit (red). Source data are provided as a Source Data file.
Fig. 3
Fig. 3. Gyrotropic velocity-space signature of ion cyclotron damping.
The gyrotropic velocity-space signature of ion cyclotron damping CE(v,v;τ) from (a) a hybrid Vlasov–Maxwell (HVM) simulation of Alfvén-ion cyclotron turbulence and from (b) the MMS data for a correlation interval τ = 77 s. c Reduced correlation CE(v;τ) for same interval of MMS data. Source data are provided as a Source Data file.
Fig. 4
Fig. 4. Timestack plot of ion cyclotron damping.
Timestack plots of the perpendicular correlation CE(v,t;τ) using both (a) instantaneous values (τ = 0) and (b) a correlation interval τ = 16.5 s. c The rate of ion energization by the perpendicular electric field j,iEτ, computed both instantaneously with τ = 0 (black) and time-averaged over τ = 16.5 s (red). Source data are provided as a Source Data file.
Fig. 5
Fig. 5. Perpendicular velocity-space signatures of ion cyclotron damping.
From the MMS measurements, the perpendicular velocity-space signatures (a) CE1(v1,v2;τ) and (b) CE2(v1,v2;τ) over correlation interval τ = 77 s. Analytical model prediction using the eigenfunction solutions of the Vlasov–Maxwell dispersion relation of the perpendicular velocity-space signatures of ion cyclotron damping, (c) CE1(v1,v2) and (d) CE2(v1,v2) averaged over one wave period, showing a qualitatively similar pattern as the MMS measurements. Source data are provided as a Source Data file.
Fig. 6
Fig. 6. Vlasov–Maxwell frequencies and damping/growth rates.
a Normalized wave frequency ω/Ωi for Ti/Ti = 1.0 (dotted) and Ti/Ti = 2.43 (dashed) vs. normalized parallel wavenumber kdi with fixed kdi = 0.016. b For Ti/Ti = 1.0, damping γ < 0 (black dotted) occurs for all kdi, but for Ti/Ti = 2.43, unstable growth with γ > 0 (red dashed) occurs over 0.3≤kdi≤0.9, with damping γ < 0 (blue dashed) outside that range. c For Ti/Ti = 1.0, decomposition of the total damping rate (black dotted): total electron damping γe (blue), ion Landau damping (iLD, red short-dashed), ion transit-time damping (iTTD, red long-dashed), and ion cyclotron damping (iCD, green dashed). Source data are provided as a Source Data file.
Fig. 7
Fig. 7. The particle energization rate versus the theoretical cascade rate ϵ.
The solid line represents particle energization rates equal to the estimated turbulent cascade rate ϵ, with the dotted lines indicating the range of the order-of-magnitude estimate of ϵ. We plot the parallel electron energization rates j,eEτ from twenty intervals in Afshari et al. (open diamonds), highlighting j,eEτ from the interval analyzed here (their Interval 02, blue diamond). The perpendicular ion energization j,iEτ (red diamond) by ion cyclotron damping is plotted along with the sum of ion and electron energization rates (black diamond). Source data are provided as a Source Data file.
Fig. 8
Fig. 8. Ion energization rate as a function of cut-off frequency.
Time-averaged rate of work done on the ions by the perpendicular electric field j,iEτ vs. the high-pass cut off frequency fcut. Source data are provided as a Source Data file.

References

    1. Howes, G. G. A prospectus on kinetic heliophysics. Phys. Plasmas24, 055907 (2017). - DOI - PMC - PubMed
    1. National Research Council. Solar and Space Physics: A Science for a Technological Society (The National Academies Press, 2013)
    1. Mikić, Z., Linker, J. A., Schnack, D. D., Lionello, R. & Tarditi, A. G. Magnetohydrodynamic modeling of the global solar corona. Phys. Plasmas6, 2217–2224 (1999). - DOI
    1. Lionello, R., Linker, J. A. & Mikić, Z. Multispectral emission of the sun during the first whole sun month: magnetohydrodynamic simulations. Astrophys. J.690, 902–912 (2009). - DOI
    1. Adhikari, L. et al. Turbulence transport modeling and first orbit parker solar probe (PSP) observations. Astrophys. J. Suppl.246, 38 (2020). - DOI

LinkOut - more resources