. 2024 Oct 7;15(1):8690.
doi: 10.1038/s41467-024-53104-9.

Single-cell RNA sequencing reveals the pro-inflammatory roles of liver-resident Th1-like cells in primary biliary cholangitis

Affiliations

Single-cell RNA sequencing reveals the pro-inflammatory roles of liver-resident Th1-like cells in primary biliary cholangitis

Ciliang Jin et al. Nat Commun. .

Abstract

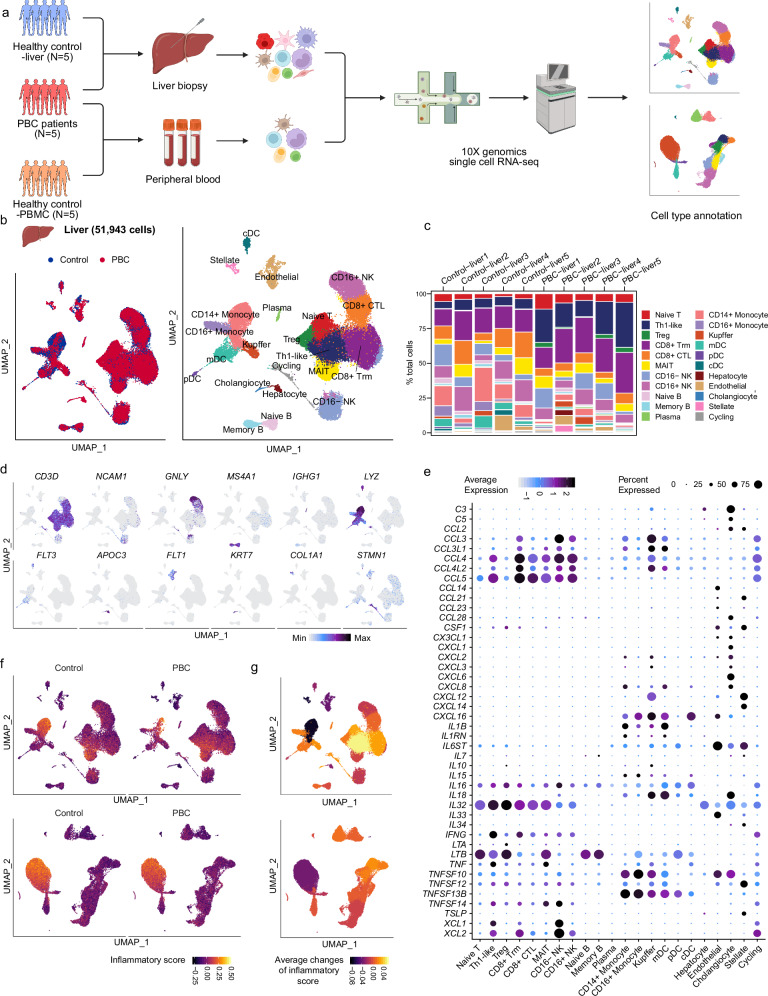
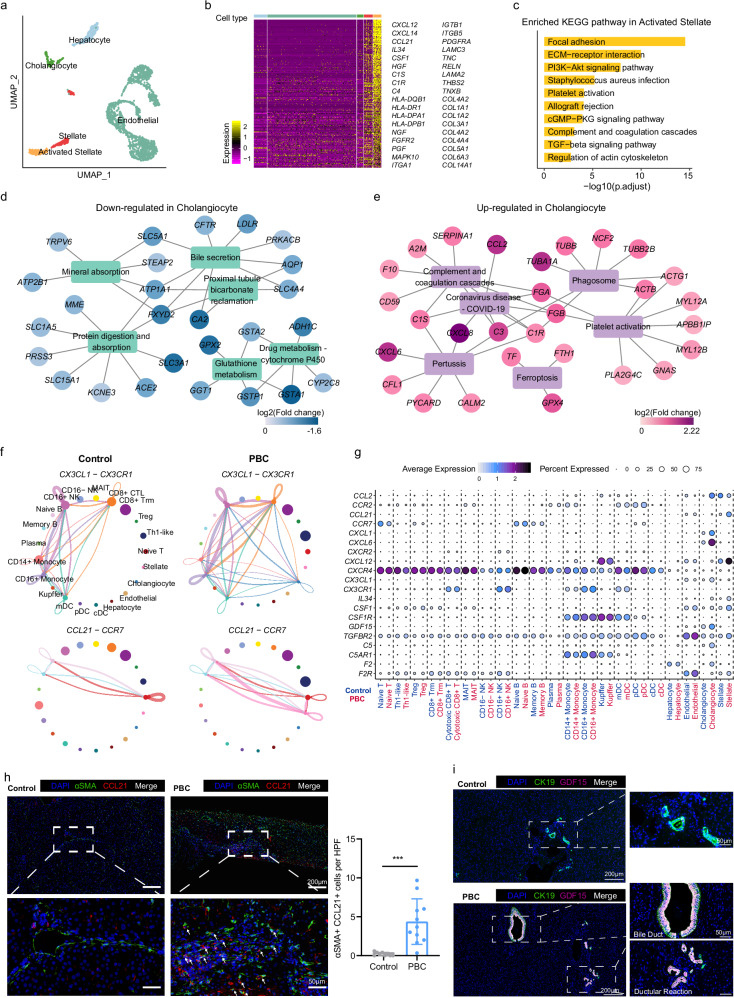
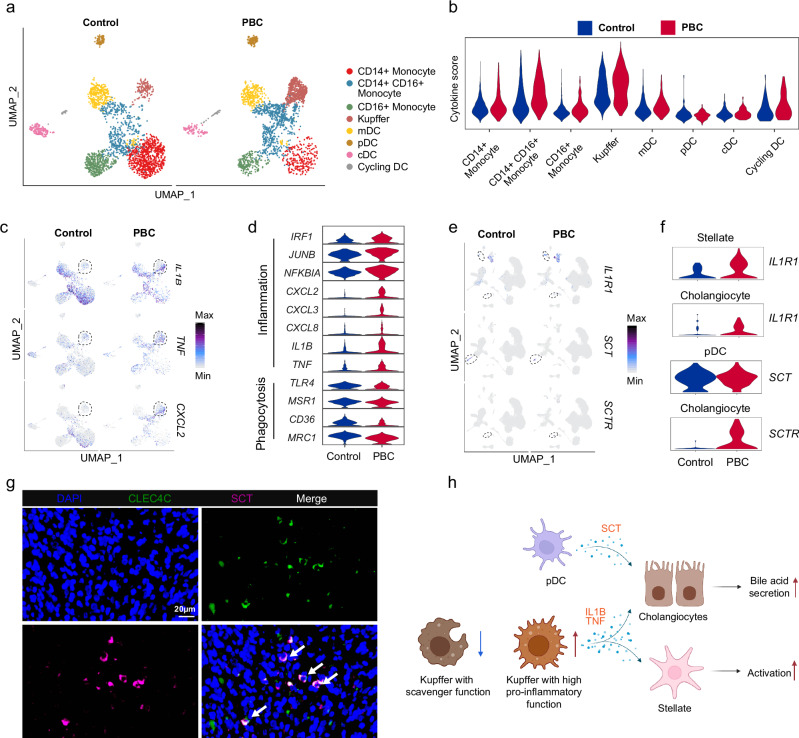
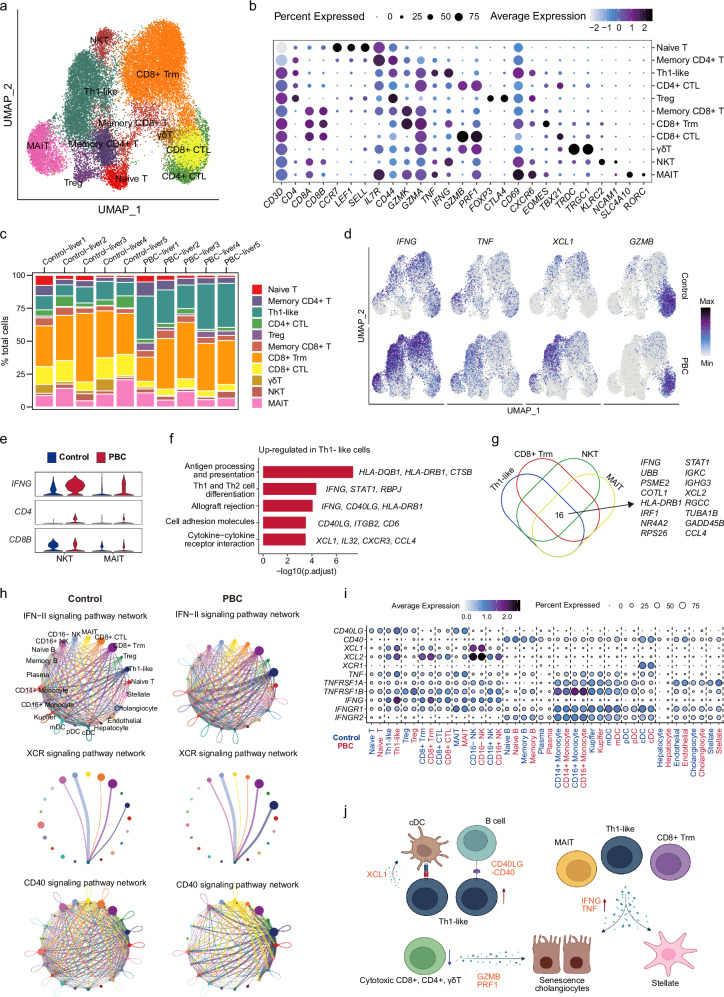
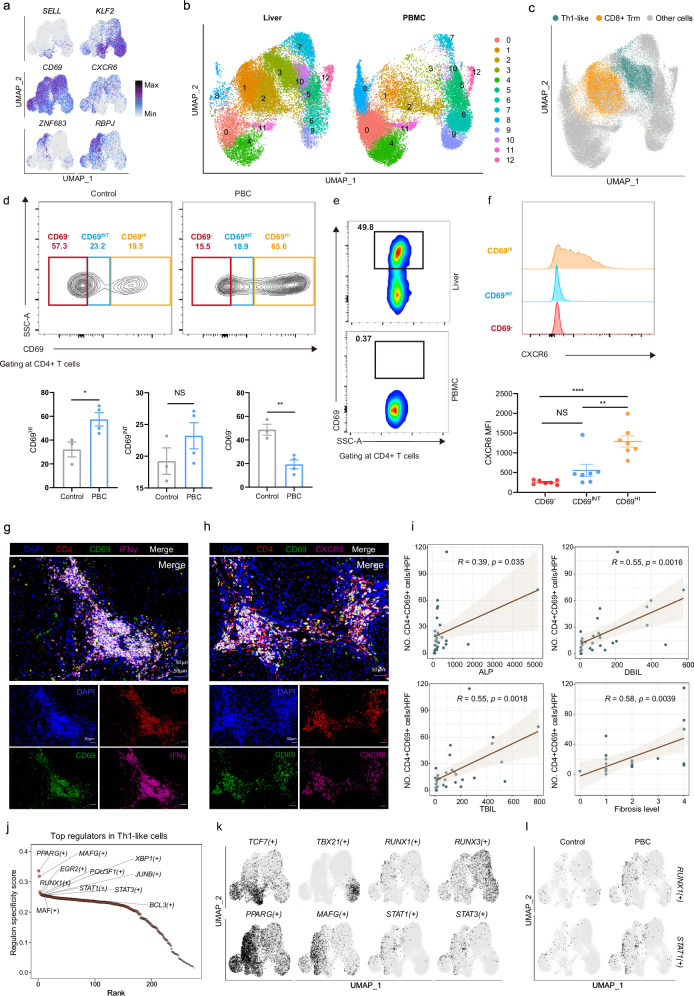
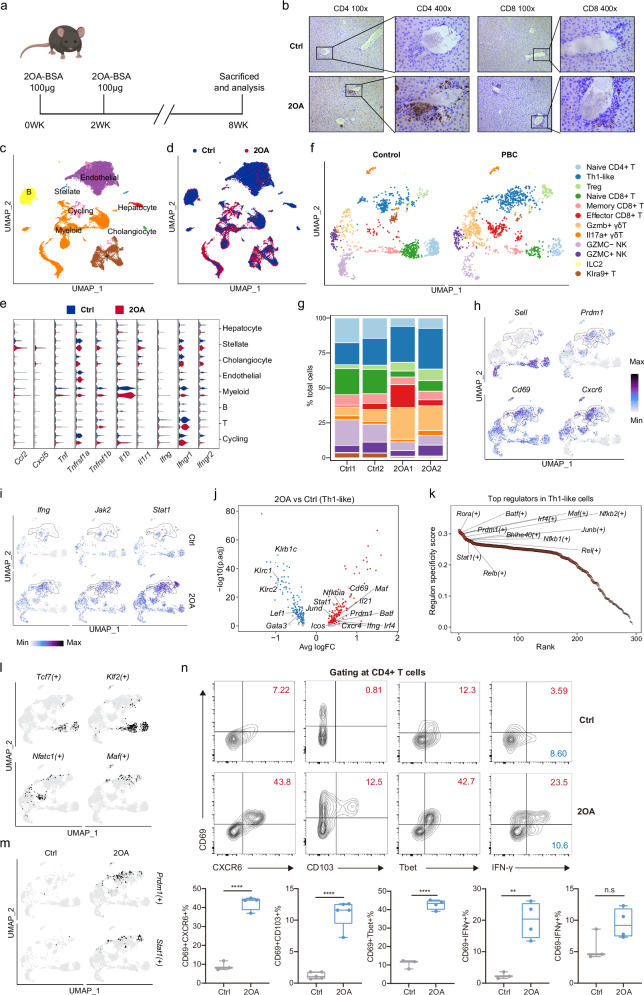
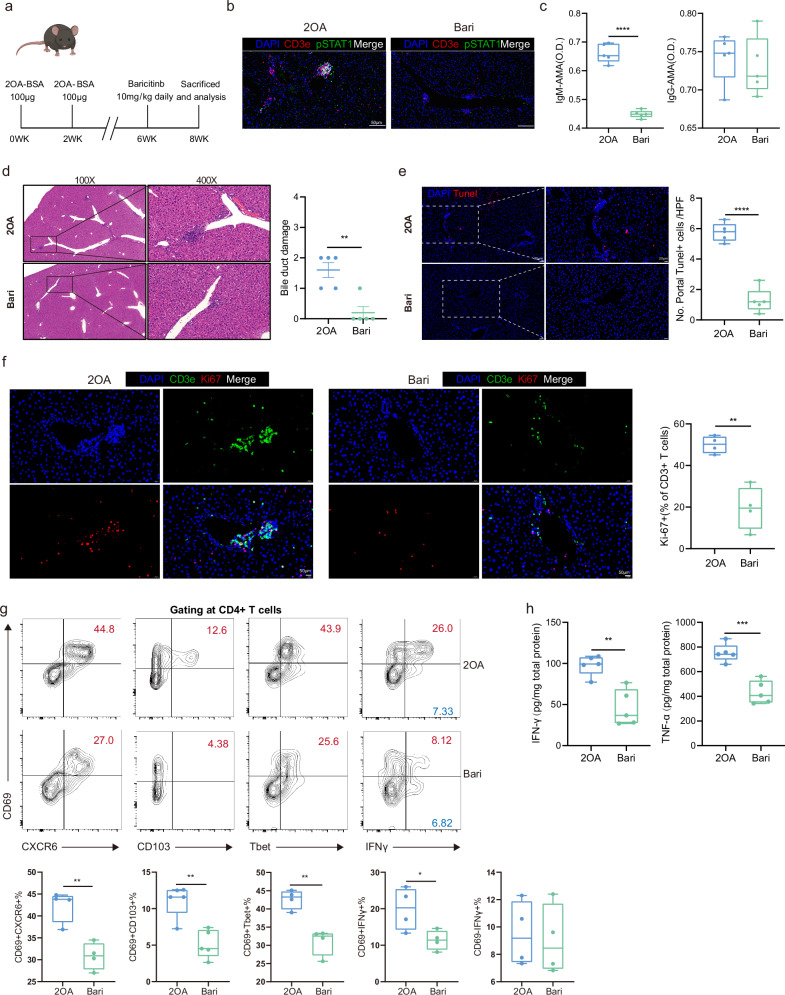
Primary biliary cholangitis (PBC) is a chronic autoimmune liver disease characterized by multilineage immune dysregulation, which subsequently causes inflammation, fibrosis, and even cirrhosis of liver. Due to the limitation of traditional assays, the local hepatic immunopathogenesis of PBC has not been fully characterized. Here, we utilize single-cell RNA sequencing technology to depict the immune cell landscape and decipher the molecular mechanisms of PBC patients. We reveal that cholangiocytes and hepatic stellate cells are involved in liver inflammation and fibrosis. Moreover, Kupffer cells show increased levels of inflammatory factors and decreased scavenger function related genes, while T cells exhibit enhanced levels of inflammatory factors and reduced cytotoxicity related genes. Interestingly, we identify a liver-resident Th1-like population with JAK-STAT activation in the livers of both PBC patients and murine PBC model. Finally, blocking the JAK-STAT pathway alleviates the liver inflammation and eliminates the liver-resident Th1-like cells in the murine PBC model. In conclusion, our comprehensive single-cell transcriptome profiling expands the understanding of pathological mechanisms of PBC and provides potential targets for the treatment of PBC in patients.


Conflict of interest statement

The authors declare no competing interests.

Figures

Fig. 1
Fig. 1. Single-cell transcriptome profiles of liver and PBMC in PBC patients.
a Schematic of scRNA-seq assay of liver and PBMC from PBC patients and control individuals. Figure 1a created in BioRender. Li, J. (2022) BioRender.com/u80n181. b Uniform Manifold Approximation and Projection (UMAP) showing the distribution of liver cells from PBC or control (left) and the annotated cell population (right). c Bar plots showing the cell ratio of liver cell subsets in each sample. d UMAP showing the expression of marker genes of major cell types in the liver data. e Bubble plot showing the expression of cytokines in each cell subgroup. The size of bubbles indicates the proportion of cells within a cell population that express a given gene. The color represented the average expression of each gene. f UMAP showing the inflammatory score of each cell in the liver (top graphs) and PBMC (bottom graphs) data. g UMAP showing average changes of inflammatory score of each cell subset. Significance was determined by Wilcoxon test.
Fig. 2
Fig. 2. Characteristics of hepatic non-immune cells in PBC patients.
a UMAP showing the distribution of non-immune cells. b Heatmap showing the marker genes of activated stellate cells. The color bar at the top of the figure indicates the cell types shown in Fig. 2a. c The enriched KEGG pathway of marker genes of activated stellate cells. P value was estimated in R package clusterProfiler using one-tailed Fisher’s Exact test with Benjamini & Hochberg adjusted. Downregulated (d) or upregulated (e) genes and enriched KEGG pathways in cholangiocytes of PBC patients. f Circle diagram showing the cell-cell interaction mediated by CX3CL1-CX3CR1 and CCL21-CCR7 interactions in PBC and control. g Bubble plot showing the expression of cell communication related genes in each cell subgroup of control and PBC groups. h Representative immunofluorescent images (left) showing the distribution of DAPI (blue), αSMA (green) and CCL21 (red) in the liver biopsy samples (PBC patients n = 11, control patients n = 9) and summary data showing αSMA+ CCL21+cells per HPF in control and PBC liver (right). Each dot represents a biological replicate from different patients. Data are presented as means ± s.d. Significance was determined by two-tailed Student’s t-test, ***P < 0.001. Source data are provided as a Source Data file including exact P values. i Representative immunofluorescent images showing the distribution of DAPI (blue), CK19 (green) and GDF15 (purple) in the liver from PBC (n = 5) and control (n = 5).
Fig. 3
Fig. 3. Characteristics of hepatic myeloid cells in PBC patients.
a UMAP showing the distribution of each subset of myeloid cells from the liver of control and PBC groups. b Violin plot showing the cytokine sore of each subset of myeloid cells from the liver of control and PBC groups. Significance was determined by two-tailed Wilcoxon test. c UMAP showing expressions of IL1B, TNF and CXCL2. d Violin plot showing differentially expressed genes related to inflammation and phagocytosis in Kupffer cells. UMAP (e) and violin plot (f) showing the expression of IL1R1, SCT and SCTR in pDC, stellate and cholangiocytes from the liver of control and PBC groups. g Representative immunofluorescent images of DAPI (blue), CLEC4C (green) and SCT (purple) in the liver from PBC (n = 5). h Schematic diagram depicting the signature of pDC and Kupffer cells in PBC. Figure 3h created in BioRender. Li, J. (2022) BioRender.com/a57d541.
Fig. 4
Fig. 4. Characteristics of hepatic T cells in PBC patients.
a UMAP showing the distribution of T cells. b Bubble plot showing the expression of marker genes in T cell subsets. c Bar plots showing the cell ratio of T cell subset in each sample. d UMAP showing the expression of IFNG, TNF, XCL1, GZMB in control and PBC groups. e Violin plot showing the expression of IFNG, CD4, CD8B in NKT and MAIT cells from control and PBC groups. f Bar plot showing the enriched KEGG pathways of un-regulated genes in Th1-like cells from PBC. P value was estimated in R package clusterProfiler using one-tailed Fisher’s Exact test with Benjamini & Hochberg adjusted. g Venn plot showing the genes upregulated in Th1-like, CD8+ Trm, NKT and MAIT cells in PBC compared with the control. h Circle diagrams showing the cell-cell interaction difference of IFN-II, XCR and CD40 signaling pathways between PBC and control. i Bubble plot showing the expression of cell communication related genes in each cell subgroup of control and PBC groups. j Schematic model summarizing the characterization of T cells in liver of PBC patients. Figure 4j created in BioRender. Li, J. (2022) BioRender.com/y68a484.
Fig. 5
Fig. 5. Characteristics of liver resident Th1-like cells in PBC patients.
a UMAP showing the expression of SELL, KLF2, CD69, CXCR6, ZNF683, and RBPJ in T cells. b UMAP showing the distribution of liver and PBMC T cells. c UMAP showing the distribution of Th1-like and CD8+ Trm cells from liver. d Gating strategy showing CD69-, CD69INT and CD69HI populations. Representative flow cytometry plot for CD4+ T cell distribution in control liver, PBC liver and summary data showing % CD4+ T cells in control and PBC liver (control n = 3, PBC n = 4). Data are presented as means ± s.d. Significance was determined by two-tailed Student’s t-test, *P < 0.05, **P < 0.01. Source data are provided as a Source Data file including exact P values. e Representative flow cytometry plot for CD4+ T cell distribution in Liver, PBMC from same PBC patient. f MFI of CXCR6 expressions in the three populations in control and PBC liver (control n = 3, PBC n = 4). The results are presented as the mean with SD, and P values were calculated using one-way ANOVA **P < 0.01, ****P < 0.0001. g Representative immunofluorescent images (n = 5) of DAPI (blue), CD4 (red), CD69 (green), and IFNγ (purple) in the liver of PBC patients. Source data are provided as a Source Data file including exact P values. h Representative immunofluorescent images (n = 5) of DAPI (blue), CD4 (red), CD69 (green), and CXCR6 (purple) in the liver of PBC patients. i Scatter plot with linear regression line showing the correlation between the percentage of CD4+CD69+ cells in the liver of PBC patients and pathological features (ALP, DBIL, TBIL, Fibrosis level). ALP, alkaline phosphatase. DBIL, direct bilirubin. TBIL, total bilirubin. Grey area represented 95% confidence intervals. n = 32. The line indicates the linear regression fit with the 95% confidence interval as error band. The Pearson correlation analysis was used to assess if there is a significant correlation. j Scatter plot showing the top cell type specific regulons in Th1-like cells. k UMAP showing binarized AUC score of TCF7(+), TBX21(+), RUNX3(+), RUNX1(+), PPARG(+), MAFG(+), STAT1(+), STAT3(+). Black and grey indicate that the activity of a regulon is ‘ON’ and ‘OFF’, respectively. l UMAP showing binarized AUC score of RUNX1(+) and STAT1(+) in control and PBC groups.
Fig. 6
Fig. 6. Identification and characterization of Th1-like cells in the liver of PBC mice.
a Schematic of the PBC mouse model generated using 2OA-BSA. Figure 6a created in BioRender. Gu, T. (2024) BioRender.com/b84j502. b Representative immunohistochemical images showing distributions of CD4+ and CD8+ T cells in the liver from ctr and 2OA-BSA groups. ctrl indicated control group. All experiments are repeated 5 times for each group. c UMAP showing annotated cell subsets. d UMAP showing the distribution of cells from control and 2OA-BSA groups. e Expression of pro-inflammatory related genes in each cell subset from control and 2OA-BSA groups. f UMAP showing the distribution of annotated T cell subsets from control and 2OA-BSA groups. g Bar plots showing the cell ratio of T cell subsets in different samples and groups. The color represents the T cell subpopulation shown in Fig. 6f. h UMAP showing the expression of Sell, Prdm1, Cd69, Cxcr6. i UMAP showing the expression of Ifng, Jak2, Stat1 in control and 2OA-BSA groups. j Scatter plot showing the differentially expressed genes in Th1-like cells from the 2OA-BSA group relative to the control group. Red dots represented upregulated genes. Blue dots represented downregulated genes. The P values were estimated in R package seurat using MAST with Bonferroni test adjusted. k Scatter plot showing the top cell type specific regulons in Th1-like cells. l UMAP showing binarized AUC score of Tcf7(+), Klf2(+), Nfatc1(+), Mafg(+). m UMAP showing binarized AUC score of Prdm1(+) Stat1(+) in control and 2OA-BSA groups. n Flow cytometry analysis (top graphs) and percentages (bottom graphs) of CD69+CXCR6+ cells (n = 3 Ctrl, n = 4 2OA), CD69+CD103+ cells (n = 5 Ctrl, n = 5 2OA), CD69+Tbet+ cells (n = 3 Ctrl, n = 4 2OA), CD69+IFN-γ+ cells (n = 3 Ctrl, n = 4 2OA) and CD69-IFN-γ+ cells (n = 3 Ctrl, n = 4 2OA) among CD4+ T cells from the liver samples of 2OA-BSA and Ctrl group mice. Each dot represents a biological replicate from different mice. Box plots show median (center line), the upper and lower quantiles (box), and the range of the data (whiskers). Data are presented as means ± s.d. Significance was determined by two-tailed Student’s t-test, **P < 0.01, ****P < 0.0001. Source data are provided as a Source Data file including exact P values.
Fig. 7
Fig. 7. Effects of baricitinb on cholangitis in PBC mice.
a Schematic of baricitinb treatment in 2OA-BSA induced PBC mouse model. Figure 7a created in BioRender. Gu, T. (2024) BioRender.com/b84j502. b Representative immunofluorescent images (n = 5) of DAPI (blue), CD3e (red) and pSTAT1 (green) in the liver of 2OA-BSA and Bari (baricitinb treatment group) mice. c Box plots showing concentrations of IgM-AMA and IgG-AMA in the blood from 2OA-BSA (n = 5) and Bari (Baricitinb treatment group) mice (n = 5). Each dot represents a biological replicate from different mice. Data are presented as means ± s.d. Significance was determined by two-tailed Student’s t-test, ****P < 0.0001. d Representative hematoxylin-eosin (H&E) staining images showing bile duct damage in 2OA-BSA and Bari mice (left) and box plot showing the difference of bile duct damage between 2OA-BSA (n = 5) and Bari (n = 5) mice (right). Each dot represents a biological replicate from different mice. Data are presented as means ± s.d. Significance was determined by two-tailed Student’s t-test, **P < 0.01. Source data are provided as a Source Data file including exact P values. e Representative immunofluorescent images of DAPI (blue) and TUNEL (red) in the liver of 2OA-BSA and Bari mice (left) and boxplot showing the difference of TUNEL+ cell number between 2OA-BSA (n = 5) and Bari (n = 5) mice liver samples (right). Data are presented as means ± s.d. Significance was determined by two-tailed Student’s t-test,****P < 0.0001.f Representative immunofluorescent images (n = 4) of DAPI (blue), CD3e (green) and Ki67(red) in the liver of 2OA-BSA (left) and Bari (middle) mice and boxplot showing the proportion of Ki67+ cells in CD3e+ T cells from the liver samples of 2OA-BSA (n = 4) and Bari (n = 4) mice (right). Data are presented as means ± s.d. Significance was determined by two-tailed Student’s t-test, **p < 0.01. g Representative flow cytometry analysis images (top graphs) and percentages (bottom graphs) of CD69+CXCR6+ cells (n = 4 2OA, n = 4 Bari), CD69+CD103+ cells (n = 5 2OA, n = 5 Bari), CD69+Tbet+ cells (n = 4 2OA, n = 4 Bari), CD69+IFN-γ+ cells (n = 4 2OA, n = 4 Bari) and CD69IFN-γ+ cells (n = 4 2OA, n = 4 Bari) among CD4+ T cells from the liver of 2OA-BSA and Bari mice. The samples of 2OA-BSA are the same samples shown in Fig. 6n. Each dot represents a biological replicate from different mice. Data are presented as means ± s.d. Significance was determined by two-tailed Student’s t-test, *P < 0.05, **P < 0.01. h Boxplots showing concentrations of IFN-γ and TNFα in the liver samples of 2OA-BSA (n = 5) and Bari (n = 5) mice. Each dot represents a biological replicate from different mice. Data are presented as means ± s.d. Significance was determined by two-tailed Student’s t-test, **P < 0.01, ***P < 0.001. In c, e and fh, box plots show median (center line), the upper and lower quantiles (box), and the range of the data (whiskers). Source data are provided as a Source Data file including exact P values.

References

    1. Gulamhusein, A. F. & Hirschfield, G. M. Primary biliary cholangitis: pathogenesis and therapeutic opportunities. Nat. Rev. Gastroenterol. Hepatol.17, 93–110 (2020). - PubMed
    1. Boonstra, K., Beuers, U. & Ponsioen, C. Y. Epidemiology of primary sclerosing cholangitis and primary biliary cirrhosis: a systematic review. J. Hepatol.56, 1181–1188 (2012). - PubMed
    1. Shah, R. A. & Kowdley, K. V. Current and potential treatments for primary biliary cholangitis. Lancet Gastroenterol. Hepatol.5, 306–315 (2020). - PubMed
    1. Combes, B. et al. Methotrexate (MTX) plus ursodeoxycholic acid (UDCA) in the treatment of primary biliary cirrhosis. Hepatology42, 1184–1193 (2005). - PubMed
    1. Gonzalez-Koch, A., Brahm, J., Antezana, C., Smok, G. & Cumsille, M. A. The combination of ursodeoxycholic acid and methotrexate for primary biliary cirrhosis is not better than ursodeoxycholic acid alone. J. Hepatol.27, 143–149 (1997). - PubMed

Publication types

MeSH terms

LinkOut - more resources