. 2024 Oct 7;15(1):8686.
doi: 10.1038/s41467-024-52969-0.

Endothelial Piezo1 channel mediates mechano-feedback control of brain blood flow

Affiliations

Endothelial Piezo1 channel mediates mechano-feedback control of brain blood flow

Xin Rui Lim et al. Nat Commun. .

Abstract

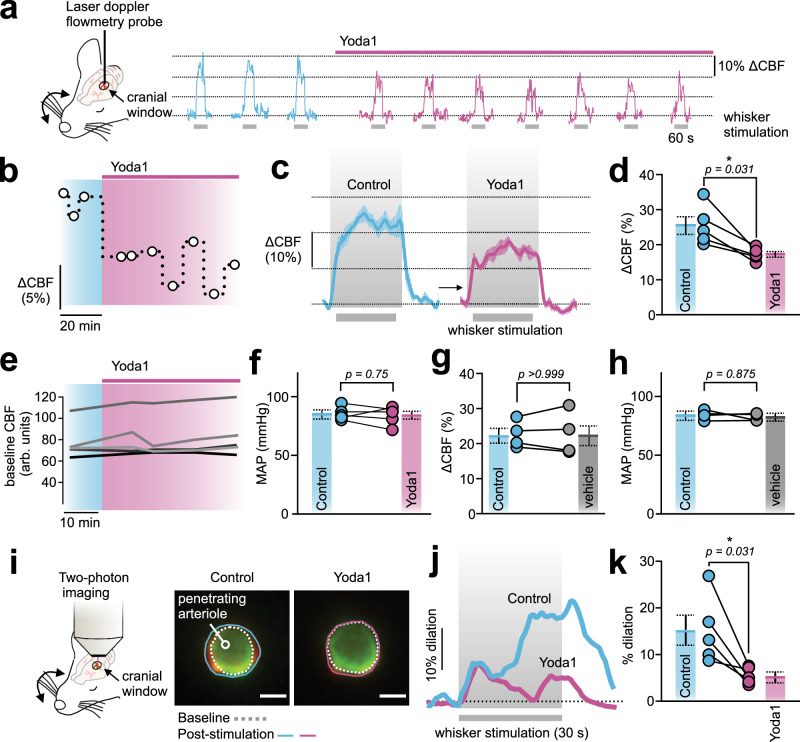
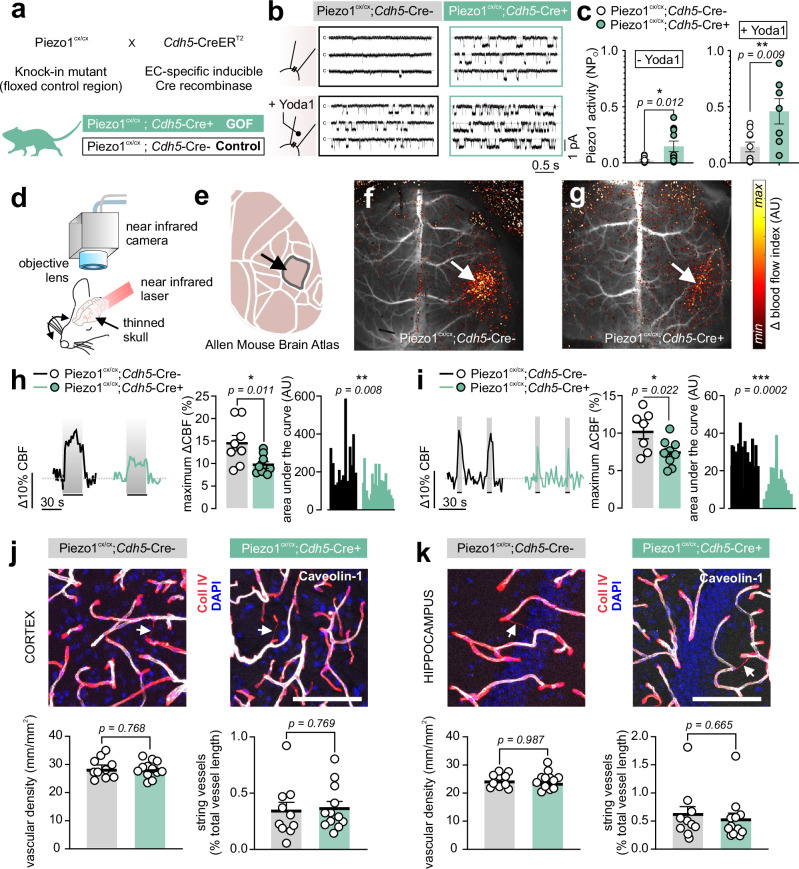
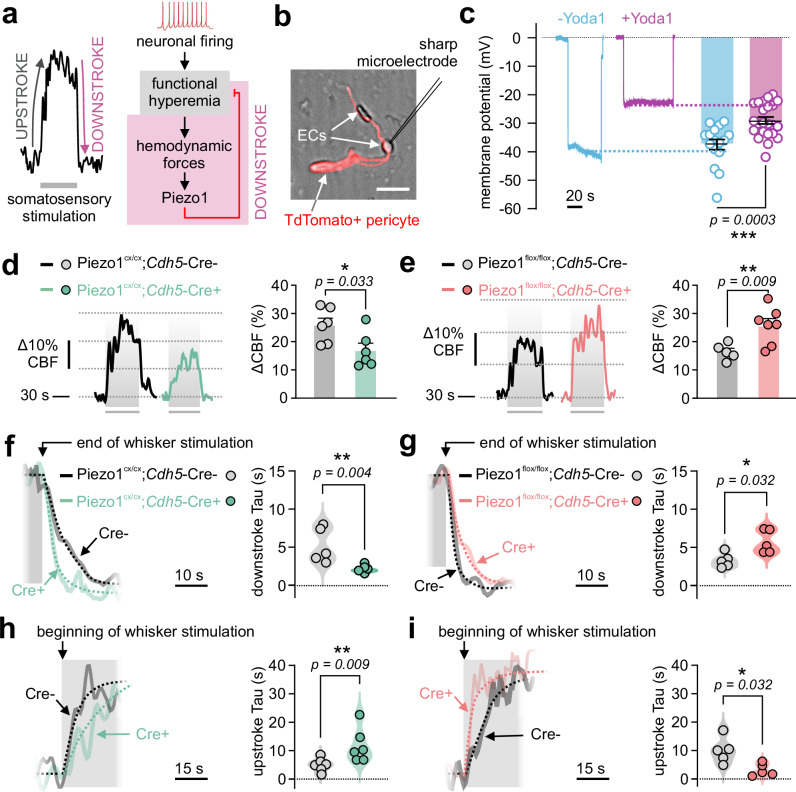
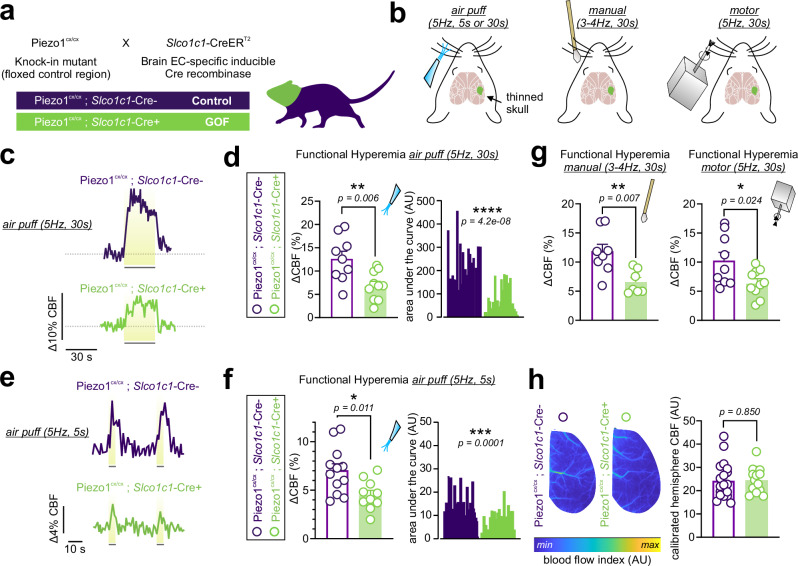
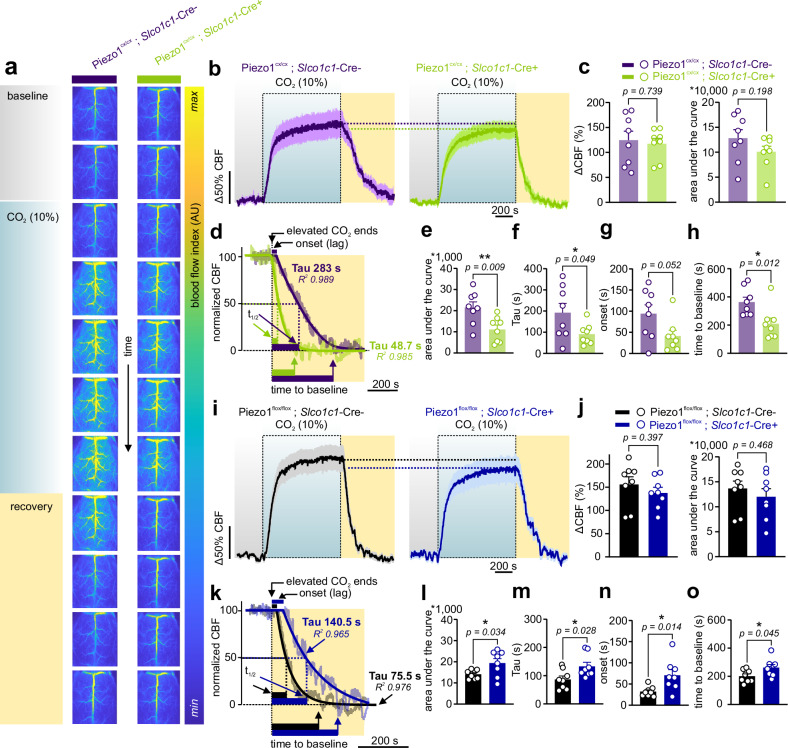
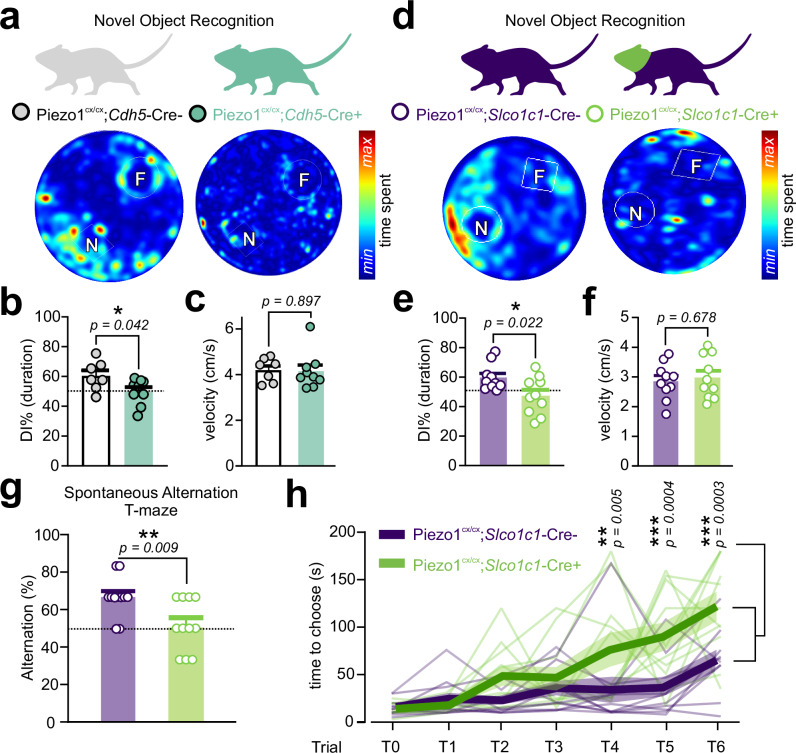
Hyperemia in response to neural activity is essential for brain health. A hyperemic response delivers O2 and nutrients, clears metabolic waste, and concomitantly exposes cerebrovascular endothelial cells to hemodynamic forces. While neurovascular research has primarily centered on the front end of hyperemia-neuronal activity-to-vascular response-the mechanical consequences of hyperemia have gone largely unexplored. Piezo1 is an endothelial mechanosensor that senses hyperemia-associated forces. Using genetic mouse models and pharmacologic approaches to manipulate endothelial Piezo1 function, we evaluated its role in blood flow control and whether it impacts cognition. We provide evidence of a built-in brake system that sculpts hyperemia, and specifically show that Piezo1 activation triggers a mechano-feedback system that promotes blood flow recovery to baseline. Further, genetic Piezo1 modification led to deficits in complementary memory tasks. Collectively, our findings establish a role for endothelial Piezo1 in cerebral blood flow regulation and a role in its behavioral sequelae.


Conflict of interest statement

The authors declare no competing interests.

Figures

Fig. 1
Fig. 1. Piezo1 activation inhibits brain functional hyperemia (FH).
a Whisker stimulation experimental scheme (left) and representative traces showing whisker stimulation-induced changes in CBF (∆CBF) in the contralateral somatosensory barrel cortex of a C57BL/6J mouse before and after Yoda1 (30 µM) application onto a cranial window. b Time course reflects the change in FH amplitude (∆CBF) from the experiment in a after the application of Yoda1. Each circle denotes one stimulation. c Average waveforms of whisker stimulation-induced CBF changes in the absence and presence of Yoda1 (n = 5 mice). d Summary data showing the effect of Yoda1 on CBF increases (n = 5 mice). e Baseline CBF in arbitrary units (arb. units) before and after Yoda1 application. f Impact of cortical application of Yoda1 on mean arterial blood pressure (MAP) measured using a femoral artery catheter (n = 5 mice). g, h Vehicle application had no effect on CBF increases or MAP (n = 4 mice). i Two-photon laser scanning microscopy experimental scheme and images of penetrating arteriolar diameter before (dotted) and after (solid) whisker-stimulation evoked arteriolar dilation. Scale bar = 5 µm. In a control mouse, whisker stimulation evoked a large increase in arteriolar diameter that was absent in the presence of Yoda1 (cortical, 30 µM). The experiment was repeated independently in 5 C57BL/6J mice (summarized in k). (j) Representative traces of arteriolar dilation in response to a 30 s whisker stimulation before and after Yoda1. k Summary of arteriolar responses to the described stimuli (n = 5 mice). Wilcoxon statistical test was used in d-h (one-sided in d and two-sided in fh) and paired Student’s t-test (two-sided) in k (*P < 0.05). All error bars are standard error of the mean (SEM). Data in c, d, f, g, h, k are presented as mean values ± SEM. Source data are provided as a Source Data file.
Fig. 2
Fig. 2. EC-specific Piezo1 gain-of-function (GOF) mice demonstrate impaired functional hyperemia.
a Crossbreeding scheme used to generate inducible, EC-specific Piezo1-GOF mice. Tamoxifen-treated Cre+ mice are used as GOF, and littermate Cre- mice are the control. b Representative traces of Piezo1 currents recorded from freshly isolated ECs from the somatosensory cortices of control and GOF mice. The cell-attached configuration was used, where EC patches were held at -50 mV in the absence or presence of Yoda1 (5 µM) in the pipette solution. C denotes closed channel. c Averaged data of the open probability (NPO) of Piezo1 in the absence (n = 11 ECs/6 control; 10 ECs/4 GOF mice) or presence of Yoda1 (n = 10 ECs/6 control; 7 ECs/4 GOF mice). d Schematic of the LSCI setup for imaging blood flow through a thinned skull. (e) The Allen mouse brain atlas highlighting the somatosensory barrel cortex. f, g Differential maps of blood flow responses in a control (f) and a GOF (g) mouse. Whisker stimulation using air puffs (5 Hz, 30 s) evoked hyperemia in the contralateral somatosensory cortex (arrows). h Representative traces and summary data of the hyperemic response to 30 s-whisker stimulations in control (n = 8) and GOF (n = 9) mice. Right: area under the curve analyses (n = 19 whisker stimulations/6 control; 20 stimulations/8 GOF mice). i Representative responses and scatter plots of FH evoked by 5 s air puffs (n = 7 control, n = 9 GOF mice). Area under the curve analysis was calculated from 41 and 43 stimulations from 7 control and 9 GOF mice, respectively. j Representative images demonstrating the staining of ECs (caveolin-1), basement membranes (collagen IV), and nuclei (DAPI) in brain slices of the cortex of GOF and control mice. Scale bar: 100 µm. Vascular densities and string vessel densities in Piezo1cx/cx;Cdh5-Cre+ (n  =  12) and control (n = 10) mice. k Representative images and averaged data as in j from brain slices of the hippocampus of Piezo1cx/cx;Cdh5-Cre+ (n = 12) and control (n =10) mice. All statistical tests were unpaired Student’s t test (two-sided, *P < 0.05, **P < 0.01, ***P < 0.001). All error bars are SEM. Scatter plot data in c, h, I, j, k are presented as mean ± SEM. Area under the curve data in h and i are presented as histograms. Source data are provided as a Source Data file.
Fig. 3
Fig. 3. Endothelial Piezo1 shapes the functional hyperemic response.
a Left: Example FH response to whisker stimulation showing the increase in CBF shortly after the stimulus starts (upstroke) and the return to baseline at the end of the stimulation (downstroke). Right: A schematic showing that neuronal activity increases blood flow (FH), and the resulting change in forces activates cationic influx by opening Piezo1 channels, thus acting as a mechano-feedback system to attenuate FH. b Experimental setup illustrating impalement of a freshly isolated brain EC using a sharp microelectrode. ECs were obtained from a Pdgfrb-Cre-TdTomato mouse, where pericytes are TdTomato+. Scale bar = 10 µm. c Traces and summary data of Vm measurements showing the effect of Yoda1 (5 µM) on endothelial Vm (-Yoda1 [n = 16 ECs/5 mice]; +Yoda1 [n = 23 ECs/4 mice]). d, e Representative traces and scatter plots of functional hyperemia responses to whisker stimulations in Piezo1cx/cx;Cdh5-Cre+ (GOF) and Piezo1flox/flox;Cdh5-Cre+ (knockout) mice, and their respective controls (d: n = 6 GOF, 6 controls; e: n = 7 knockout, 5 controls). f Representative traces and plateau-followed-by-exponential fittings (dotted) to obtain time constant for downstroke (Tau), in a control mouse and a GOF mouse. Right: Scatter plot of downstroke Tau values in control (n = 5) and GOF (n = 6) mice. g Similar to f in knockout and control mice (n = 5 each). h Representative traces and plateau-followed-by-exponential fittings (dotted) to obtain upstroke Tau, in a control mouse and a GOF mouse. Right: Scatter plot of upstroke Tau values in control and GOF (n = 6 mice each). i Representative traces and averaged data of upstroke Tau in control and knockout mice (n = 5 mice each). FH responses were measured through a cranial window using laser Doppler flowmetry. Statistical tests were unpaired Student’s t test (two-sided, c), and Mann-Whitney test (one-sided in de, two-sided in fi; *P < 0.05, **P < 0.01, ***P < 0.001). Error bars in c, d and e are SEM. Data in c, d, e are presented as mean values ± SEM, and data in f, g, h, i are presented as violin scatter plots. Source data are provided as a Source Data file.
Fig. 4
Fig. 4. Piezo1-GOF mutation in the brain vasculature impairs blood flow increase during somatosensory stimulation.
a Crossbreeding scheme used to generate inducible, brain EC-specific Piezo1-GOF (Piezo1cx/cx;Slco1c1-Cre+) mice. Tamoxifen-treated Cre+ mice were used as GOF, and littermate Cre- mice were the control. b Schematic illustrations of different whisker stimulation paradigms during LSCI recordings (thinned skulls), with the contralateral somatosensory barrel cortex highlighted (green). c Representative traces of FH responses to air puffs (5 Hz, 30 s each) in a control and a Piezo1cx/cx;Slco1c1-Cre+ mouse. d Scatter plot of CBF increases during 30 s air puff whisker stimulation in control (n = 9) and brain EC-GOF (n = 10) mice. Right: area under the curve analyses (control: 28 whisker stimulations; GOF: 32 stimulations). e, f Representative responses and summary data of hyperemic responses to 5 s whisker stimulation using air puffs (n = 12 control; 10 brain-EC-GOF). Area under the curve analyses compare 39 stimulations in brain-EC-GOF mice and 35 stimulations in controls. g Averaged scatter plots of FH responses to manual stimulation (n = 8 control; 7 brain-EC-GOF) or motor stimulation (n = 9 control; 10 brain-EC-GOF). h Examples and averages of baseline blood flow in the hemispheres of control (n = 19) and brain-EC-GOF (n = 14) mice. All statistical tests were unpaired Student’s t test (two-sided, *P < 0.05, **P < 0.01, ***P < 0.001, ****P < 0.0001). All error bars are SEM. Scatter plot data in d, g, f, h are presented as mean ± SEM. Area under the curve data in d and g are presented as histograms. Source data are provided as a Source Data file.
Fig. 5
Fig. 5. CO2-induced hyperemia is altered in mice with enhanced or reduced brain EC Piezo1 activity.
a Representative consecutive images, recorded using LSCI through thinned skulls, reflect CBF responses to 10% CO2 inhalation in a control (Piezo1cx/cx;Slco1c1-Cre-) and a Piezo1cx/cx;Slco1c1-Cre+ mouse. A 5-min baseline was followed by 10% CO2 (15 min), and then CBF was allowed to recover to baseline over 10 min. b Averaged normalized CBF changes in control and Piezo1cx/cx;Slco1c1-Cre+ mice (n = 8 mice/group). c Maximal increases in CBF in response to hypercapnia and areas under the curve over the entire recording in control and brain-EC-GOF mice (n = 8 mice/group). d Representative CBF recovery in a control and a Piezo1cx/cx;Slco1c1-Cre+ mouse. Plateau followed by exponential decline fittings of the recovery phase and the corresponding Tau and goodness of fit (R2). Additional kinetic parameters include recovery halftime (t1/2: time to 50% decrease), the duration required for return to baseline (time to baseline), and the recovery onset (the lag between the end of CO2 stimulation to the beginning of decline). e Area under the curve of 5-min of recovery in control and brain-EC-GOF mice (n = 8 mice/genotype). f, g, h Averaged scatter plots of kinetic parameters (Tau, onset, time to baseline), as shown in d (n = 8 mice/genotype). (i) Averaged normalized changes in CBF in control and Piezo1flox/flox;Slco1c1-Cre+ mice. j Change in CBF in response to CO2 in brain-EC-knockout mice and controls (n = 8 mice/group). k Representative traces and fittings of CBF recovery in a control and a Piezo1flox/flox;Slco1c1-Cre+ mouse. (l, m, n, o) Area under the curve of 5-min of recovery and other kinetic parameters of the recovery phase in control and Piezo1flox/flox;Slco1c1-Cre+ mice (n = 8 each). Data in b, c, eh, i, j, lo are presented as mean ± SEM. All statistical tests were unpaired Student’s t test (two-sided, *P < 0.05, **P < 0.01), and all error bars are SEM. Source data are provided as a Source Data file.
Fig. 6
Fig. 6. Endothelial Piezo1 gain-of-function mice display a memory impairment phenotype.
a Novel object recognition test in control and Piezo1cx/cx;Cdh5-Cre+ mice. Heat maps demonstrate the cumulative time spent with familiar (F) and novel (N) objects. b Scatter plot shows the discrimination index (DI%-calculated based on duration) for the two groups (n = 7 control, 9 Piezo1cx/cx;Cdh5-Cre+ mice). DI of 50% (dotted) indicates equal time spent with novel and familiar objects. c Velocities of control (n = 7) and Piezo1cx/cx;Cdh5-Cre+ mice (n = 9) during the NOR test. d, e Similar to a and b, test results from Piezo1cx/cx;Slco1c1-Cre+ and their controls (n = 10 each). f Motor activity of Piezo1cx/cx;Slco1c1-Cre+ mice and their controls (n = 10 each) during the NOR test. g Percent of alternation over all 6 trials during the spontaneous alternation T-maze was calculated as [(number of correct alternations/6)*100)] in Piezo1cx/cx;Slco1c1-Cre+ and their controls (n = 11 each). The dotted line represents the 50% chance level. h Choice latency in Piezo1cx/cx;Slco1c1-Cre+ and control mice over trials 1 to 6. Asterisks highlight significantly higher choice latency in Piezo1cx/cx;Slco1c1-Cre+ mice at T4, T5 and T6. Data from individual mice are shown, and bold lines and transparent shades are means and SEM, respectively (n = 11 mice each). Statistical tests were unpaired Student’s t test (two-sided, b, c, e, f, g) and two-way ANOVA test in h (*P < 0.05, **P < 0.01, ***P < 0.001). All error bars are SEM. Data in b, c, e-g are presented as mean ± SEM. Source data are provided as a Source Data file.

References

    1. Iadecola, C. The Neurovascular Unit Coming of Age: A Journey through Neurovascular Coupling in Health and Disease. Neuron96, 17–42 (2017). - PMC - PubMed
    1. Schaeffer, S. & Iadecola, C. Revisiting the neurovascular unit. Nat. Neurosci.24, 1198–1209 (2021). - PMC - PubMed
    1. Rasmussen, M. K., Mestre, H. & Nedergaard, M. Fluid transport in the brain. Physiol. Rev.102, 1025–1151 (2022). - PMC - PubMed
    1. Yablonskiy, D. A., Ackerman, J. J. H. & Raichle, M. E. Coupling between changes in human brain temperature and oxidative metabolism during prolonged visual stimulation. Proc. Natl Acad. Sci. USA97, 7603–7608 (2000). - PMC - PubMed
    1. Drew, P. J. Neurovascular coupling: motive unknown. Trends Neurosci45, 809–819 (2022) - PMC - PubMed

Publication types

LinkOut - more resources