. 2025 Aug;43(8):1324-1336.
doi: 10.1038/s41587-024-02403-z. Epub 2024 Oct 7.

Scalable, compressed phenotypic screening using pooled perturbations

Affiliations

Scalable, compressed phenotypic screening using pooled perturbations

Nuo Liu et al. Nat Biotechnol. 2025 Aug.

Abstract

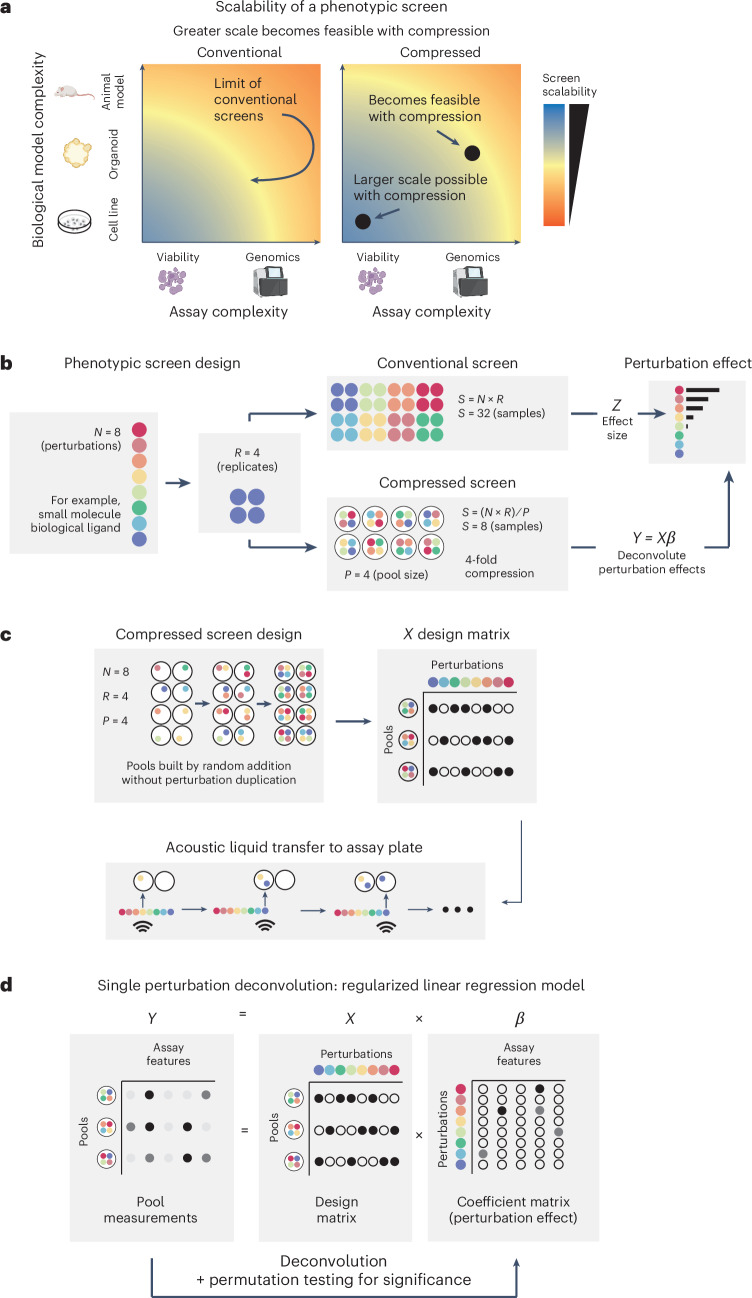
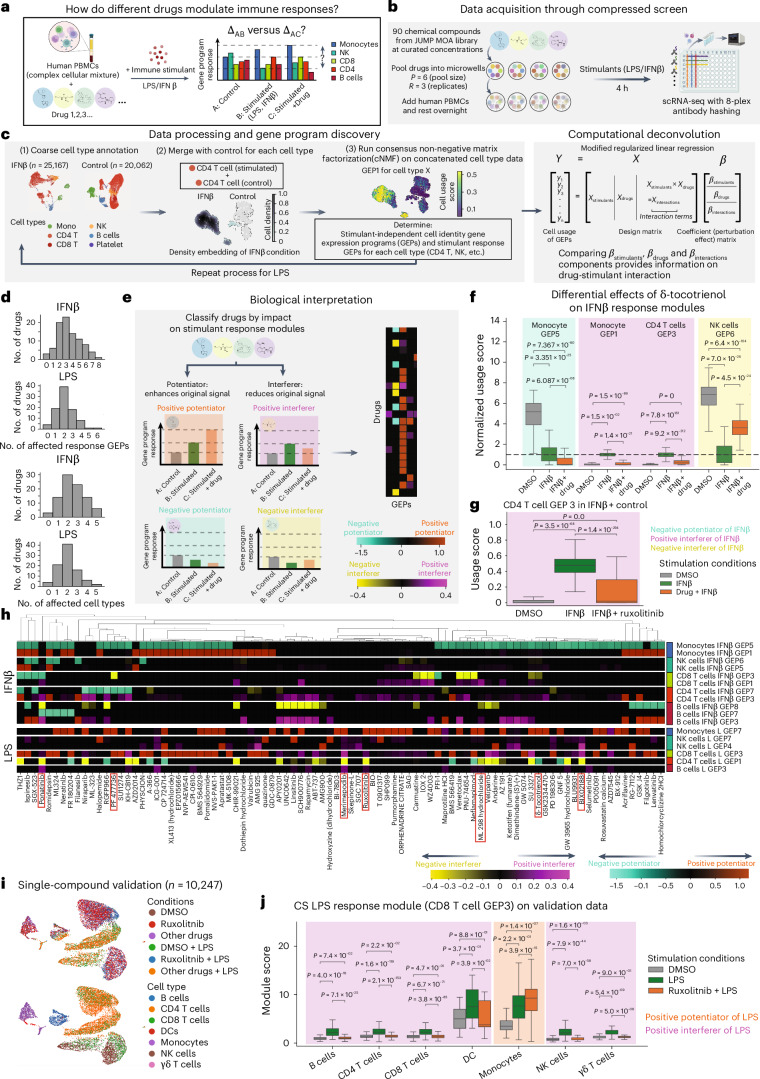
High-throughput phenotypic screens using biochemical perturbations and high-content readouts are constrained by limitations of scale. To address this, we establish a method of pooling exogenous perturbations followed by computational deconvolution to reduce required sample size, labor and cost. We demonstrate the increased efficiency of compressed experimental designs compared to conventional approaches through benchmarking with a bioactive small-molecule library and a high-content imaging readout. We then apply compressed screening in two biological discovery campaigns. In the first, we use early-passage pancreatic cancer organoids to map transcriptional responses to a library of recombinant tumor microenvironment protein ligands, uncovering reproducible phenotypic shifts induced by specific ligands distinct from canonical reference signatures and correlated with clinical outcome. In the second, we identify the pleotropic modulatory effects of a chemical compound library with known mechanisms of action on primary human peripheral blood mononuclear cell immune responses. In sum, our approach empowers phenotypic screens with information-rich readouts to advance drug discovery efforts and basic biological inquiry.


Conflict of interest statement

Competing interests: A.K.S. reports compensation for consulting and/or scientific advisory board (SAB) membership from Honeycomb Biotechnologies, Cellarity, Ochre Bio, Bio-Rad Laboratories, Relation Therapeutics, IntrECate biotherapeutics, Fog Pharma, Passkey Therapeutics and Dahlia Biosciences unrelated to this work. B.E.M. reports compensation for consulting from Empress Therapeutics unrelated to this work. S.R. holds equity in Amgen and receives research funding from Microsoft. P.S.W. receives research funding from Microsoft and reports compensation for consulting from The Engine Venture unrelated to this work. P.C.B. is a consultant to or holds equity in 10X Genomics, General Automation Lab Technologies/Isolation Bio, Celsius Therapeutics, Next Gen Diagnostics, Cache DNA, Concerto Biosciences, Stately, Ramona Optics and Bifrost. W.C.H. is a consultant for Thermo Fisher, Solasta Ventures, KSQ Therapeutics, Jubilant Therapeutics, RAPPTA Therapeutics, Function Oncology, Riva Therapeutics, Serinus Biosciences, Crane Biosciences, Frontier Medicines, Kestrel Therapeutics and Calyx. W.H. reports SAB membership from Kestrel Therapeutics. L.C. and A.P.A. are both employees of Microsoft Research and hold equities in Microsoft. The other authors declare no competing interests.

Figures

Fig. 1
Fig. 1. Compressed screening with high-fidelity model systems and high-content assays.
a, Conceptual visualization of how assay and biological model complexity may limit the scalability of conventional screens and how this boundary may be shifted by compressed screening. b, In compressed screening, a set of N perturbations is combined into pools of size P with each drug replicated R times across all pools. Pooling so as to ensure specific perturbations are not repeatedly paired enables the use of linear deconvolution to identify the effects of each. Overall, this reduces the number of samples, S, required to conduct a conventional phenotypic screen (Sconventional=N×R) by a factor of P (Scompressed=N×RP). The example illustrates these ideas for N = 8, R = 4 and P = 4. c, Visualization of the construction of a CS with an acoustic liquid handler. d, Regression framework for inferring the effects of individual perturbations in a CS: we solve for the coefficient matrix (β) that describes the effect of perturbations (whose assignment to pools is denoted in the design matrix X) on the measured features of the screen (matrix Y).
Fig. 2
Fig. 2. Compressed screening identifies compounds with largest effects in a GT setting.
a, Overview of CS benchmarking experiments used to assess the morphological impacts of 316 FDA-approved compounds on U2OS cells. b, Overview of conventional GT screen designed to address a (Methods). c, The effects of the 316 compounds were calculated relative to DMSO controls using the MD and the drug × feature matrix was clustered to identify GT drug-associated phenotypes. d, One-sided Fisher’s exact enrichments (−log10(P value)) of the features differentially enriched in each GT phenotype (log2 fold change > 3) from the seven classes of Cell Painting features (five cellular components plus area or shape and neighborhood features). Each of the seven is further broken down on the basis of whether the observation pertains to the entire cell, the cytoplasm only or the nucleus only. The righthand bar visualizes the mean number of cells per well across all samples in each GT phenotype. e, Heat map (−log10(P value), one-sided permutation test with no correction) showing the top five drugs associated with each of the eight GT clusters. f, Overview of our compressed screening benchmarking experiment, which tested a range of compressions (Scompressed=N×RP) for the same 316 drugs (N) by examining several pool sizes (P) and replications (R) to identify the capabilities and limits of the approach. g, CS experimental overview. h, Analytical approach for inferring the effects of each perturbation using regularized linear regression and solving for the coefficient matrix (β). i, Inferred perturbation effects in a CS (scaled L1 norm, y axis) versus those from the GT screen (MD, x axis) for two replicate runs (r, Pearson correlation; two-sided correlation test CS run 1, P value < 2.2 × 10−16; CS run 2, P value < 2.2 × 10−16). j, Correlation of the effect sizes between GT and CS runs across all pool sizes for the perturbations that were significantly associated with any of the phenotypic clusters in the GT screen (one-sided permutation test without multiple hypothesis correction, P value < 0.01). k, Receiver operating characteristic (ROC) curves (false positive rate versus true positive rate) calculated to show the performance of the CS screens in correctly identifying GT hits for each pool size while varying the deconvolution permutation testing threshold (from 0 to 1 in steps of 0.01). l, Mean scaled L1 norm of the perturbations called as hits (scaled L1 norm > 0) in both replicate CSs at each pool size (y axis). The drugs plotted are those that resulted in a statistically significant effect in any pool size (one-sided permutation test without multiple hypothesis correction, P value < 0.01). m, False negative rate, calculated as perturbations with significant MDs in the GT screen but unrecovered in CS among all significant GT perturbations, as a function of pool size in the CS.
Fig. 3
Fig. 3. CS of biological ligands on PDAC organoids reveals major axes of transcriptional response that are recapitulated in single-ligand validation screens with clinical relevance.
a, Overview of a CS designed to explore the effects of macrophage-derived ligands on patient-derived PDAC organoid transcriptional states. b, Overview of experimental setup for the 68 biological ligand CS (with select single-ligand landmark perturbations) on PDAC organoids with a scRNA-seq readout. c, Overview of computational analyses on scRNA-seq results from the CS used to identify GEPs and the ligands that induce them. d, Scatter plot of significant ligand effects on cNMF modules (deconvolution regression coefficients) from two CSs with distinct random pooling. e, Heat map of the mean significant ligand effects on cNMF modules over both CS runs. f, Top, overview of a single-ligand validation experiment. The top 11 hits (adjusted P value < 0.05) that emerged in both CSs were validated by performing single-ligand treatments in duplicate. Hits are grouped by the GEPs they induce, and landmark perturbations are noted with an asterisk. DMSO-treated wells served as negative controls. Bottom, Heat map visualizing the Pearson correlation between the effects of each ligand on the CS cNMF GEPs in the CS (rows) and the effects of the same ligands on the CS cNMF GEPs in the single-ligand experiment (columns). g, Top, Venn diagrams depicting the number of shared and unique genes between the cNMF PDAC IL-4 and IL-13 response GEP and corresponding signatures in MsigDB. Bottom, Kaplan–Meier survival plots of TCGA PAAD cohort (n = 182, bulk RNA-seq expression data) based on (left to right) our PDAC IL-4 and IL-13 response module or three gene signatures (Reactome, Biocarta and Lu et al. IL-4) from MsigDB.
Fig. 4
Fig. 4. CS of an MOA drug library identifies modulators of immune responses across human PBMCs.
a, Overview of CS for examining the immunomodulatory effects of a MOA drug library on the responses of human PBMCs to stimulation with either LPS or IFNβ. b, Experimental overview. c, Left, overview of data processing and analysis workflow. Right, overview of the computational workflow used to analyze the CS data. d, Summary statistics of the number of affected stimulant–response GEPs and number of affected cell types for each molecule in each stimulation condition (LPS or IFNβ). Permutation test P-value cutoff = 0.01. e, Classification of the impact of a compound on cell-type-specific immune modulation. f, Example of a compound (δ-tocotrienol) with diverse effects within the same cell type and across different cell types. The usage scores for each GEP were normalized against the median of the DMSO + IFNβ condition. A Mann–Whitney U-test (two-sided, no correction) was performed to test score differences (Methods). The bottom, center and top lines of the box plots indicate the 25th percentile, median and 75th percentile, respectively. Whiskers are drawn to the farthest datapoints within 1.5× the interquartile range from the nearest hinge. Sample size by stimulation condition: DMSO, n = 396 (monocytes), n = 1,730 (CD4) and n = 404 (NK cells); IFNβ, n = 197 (monocytes), n = 1,276 (CD4) and n = 265 (NK cells); IFNβ + δ-tocotrienol, n = 41(monocytes), n = 631 (CD4) and n = 53 (NK cells). g, Ruxolitinib acts as an IFNβ interferer for CD4 T cell GEP3. A Mann–Whitney U-test (two-sided, no correction) was performed to test score differences (Methods). The bottom, center and top lines of the box plots indicate the 25th percentile, median and 75th percentile, respectively. Whiskers are drawn to the farthest datapoints within 1.5× the interquartile range from the nearest hinge. Sample sizes: DMSO, n = 1,730; IFNβ, n = 1,276; IFNβ + ruxolitinib, n = 1,356. h, Heat map showing the effects of all 90 compounds on PBMC responses to IFNβ (top) and LPS (bottom). Color bars represent the strength of the effect. Negative values denote a negative potentiator or interferer while positive values denote a positive potentiator or interferer. Permutation test P-value cutoff = 0.01. i, Low-dimensional embedding (UMAP) of single-compound validation experiment of ruxolitinib’s effect on LPS responses. j, Evaluation of CS LPS response module (CD8 T cell GEP3) in ruxolitinib-only perturbation. The bottom, center and top lines of the box plots indicate the 25th percentile, median and 75th percentile, respectively. Whiskers are drawn to the farthest datapoints within 1.5× the interquartile range from the nearest hinge. Sample sizes by condition: DMSO, n = 112 (B cells), n = 648 (CD4), n = 376 (CD8), n = 27 (dendritic cells (DCs)), n = 215 (monocytes), n = 188 (NK cells) and n = 27 (γδ T cells); LPS, n = 130 (B cells), n = 1,004 (CD4), n = 478 (CD8), n = 10 (DCs), n = 48 (monocytes), n = 264 (NK cells) and n = 41 (γδ T cells); LPS + ruxolitinib, n = 62 (B cells), n = 475 (CD4), n = 299 (CD8), n = 5 (DCs), n = 19 (monocytes), n = 152 (NK cells) and n = 28 (γδ T cells).
Extended Data Fig. 1
Extended Data Fig. 1. Developing compressed screening by testing 316 small molecules in the U2OS cell line with a Cell Painting readout.
a. Histogram of the log10 Mahalanobis Distance (MD) values calculated for each small molecule perturbation relative to the mean of the negative controls (DMSO) over morphological features quantified by the Cell Paiting assay at 6 hours, 24 hours, and 28 hours. For each time point, the coefficient of variation (std./mean) of the log10MD is reported. b. Histogram of log10MD values calculated for each small molecule perturbation relative to the mean of the negative controls (DMSO) over morphological features quantified by the Cell Paiting assay at the 24-hour timepoint at three drug doses: 0.1, 1, and 10 µM. For each dose, the coefficient of variation (std./mean) of the log10MD is reported. c. Histogram of cell number distribution across 192 DMSO control wells for all imaging plates. d. Histogram of cell number distribution in control (right) and perturbation (left) wells, stratified by drug dosage in the GT. e. Violin plot of cell number for perturbations associated each ground truth (GT) phenotypic cluster, plotted by GT phenotypic cluster. f. Scatterplot of non-zero enrichment scores from one-sided permutation test for each perturbation in each GT phenotype. g. Representative Cell Painting images from the morphological phenotype clusters identified in the GT screen. Cells were stained with dyes marking nuclei (Hoechst 33342), endoplasmic reticula (Concanavalin A-AlexaFluor 488), mitochondria (MitoTracker Deep Red), F-actin (Phalloidin-AlexaFluor 568), Golgi apparati and plasma membranes (Wheat Germ Agglutinin-AlexaFluor 594), and nucleoli/cytoplasmic RNA (SYTO14). Diverse phenotypes were observed in compounded-treated U2OS cells, such as: altered nuclei shape and size (Cluster 7); redistribution of ER to one side of nucleus (Cluster 6); mitochondrial puncta (Clyster 8); and, bright, abundant Golgi staining (Cluster 2). Scale bars: 200 μm. h. Bar plot of fingerprint drug categories and their representation in each cluster. i. Representative images of drugs (anti-neoplastic agents) associated with phenotypic cluster 7 with a range of effect sizes (MDs) in the GT screen. The extent of variation in staining of DNA (Hoechst 33342) and nucleolus and cellular RNA (SYTO14) correlate with MD. Scale bars: 200 μm.
Extended Data Fig. 2
Extended Data Fig. 2. Additional analytical results from the CS Cell Painting benchmark.
a. Bar graph of top and bottom 10 perturbations in GT screen by mean cell number across n = 6 replicate wells with that perturbation. Error bar indicates 95% confidence interval. b. Histogram of cell number distribution in perturbation wells, stratified by extent of compression. Coefficient of variance (CV; std./mean) = 0.088, R2 = 0.037 amongst compressed run mean cell counts; CV = 0.22, R2 = 0.048 amongst uncompressed and compressed run mean cell count. c. Histogram of cell number distribution in GT perturbation wells stratified by whether the perturbation was identified as a hit in the compressed screen. d. Comparison of different statistical methods to evaluate the correlation of effect sizes between GT and CS. Error bar indicates 95% confidence interval. e. Scatterplot of correlation between effect sizes (L1 norms of regression coefficients) in two CS runs (permutation test, p-value < 0.01. f. Using GT screen significant perturbations as ground truth, ROC curves (true positive rate vs. false positive rate) show the performance of the CS screens in run 2 for correctly identifying hits at each pool size while varying the permutation testing threshold (from 0 to 1 in steps of 0.01) in the deconvolution algorithm.
Extended Data Fig. 3
Extended Data Fig. 3. PDAC compressed screen scRNA-seq quality metrics and cNMF modules.
a. Scatter plot of the number of cells per perturbation across all pools in each replicate plate. b. Violin plots of the number of UMIs, the number of unique genes, and the percent of genes that are mitochondrial in the compressed screen scRNA-seq datasets. c. Heatmaps visualizing the Pearson correlation across cells for their usage of cNMF gene expression programs. Bolded GEPs are selected as highly variable and annotated as response GEPs. d. Heatmaps visualizing the Pearson correlation across cells for their module scores of cNMF gene expression programs and their module scores for existing gene signatures. e. Top three genes by gene spectra score for the highly variable cNMF modules. f. Violin plot of IL4I1 expression in macrophage subtypes in the Raghavan et al. dataset. Two-sided Mann-Whitney U test without correction was performed to test score differences (Methods). All the box plots indicate 25th percentile at the bottom, median in the middle and 75th percentile at the top. Whiskers are drawn to the farthest datapoints within 1.5* interquartile range from the nearest hinge. Sample sizes: C1Q1+ TAM n = 2063, FCN1+ TAM n = 1963, SPP1+ TAM n = 567. g. UMAP visualizations of all cells from both compressed screens, colored by cNMF module usage. h. UMAP visualizations of all cells from both compressed screens, colored by density of cells from pools containing specific ligands. i. Top: Scatter plot of mean cognate receptor(s) expression (log-normalized) for each screened ligand over control PDAC organoid cells in the compressed scRNA-seq dataset. Bottom: Scatter plot of mean cognate receptor(s) expression (log-normalized) for each screened ligand over primary tumor cells from the matched patient in the Raghavan et al. study. Ligands are ordered by mean expression of receptor(s) in each dataset and ligands with significant (p value< 0.01, one-sided permutation test without correction) effects on identified cNMF GEPs are colored in orange.
Extended Data Fig. 4
Extended Data Fig. 4. Single-ligand perturbation experiment scRNA-seq quality metrics and cNMF modules.
a. Violin plots of the number of UMIs, the number of unique genes, and the percent of mitochondrial genes in the single-ligand scRNA-seq dataset. b. Heatmaps visualizing the Pearson correlation across cells for their module scores of single-ligand cNMF gene expression programs and their scores for existing gene signatures. c. Heatmap of the top three genes by gene spectra score for the single-ligand cNMF modules that corresponded (correlated highly) with the highly variable compressed cNMF modules. d. Heatmap visualizing the Pearson correlation between compressed screen cNMF GEPs gene spectra scores (rows) and single-ligand cNMF GEPs gene scores (columns). e. Ranking of top 50 genes in compressed screen (CS) PDAC IL-4/IL-13 response GEP (top) and single-ligand PDAC IL-4/IL-13 response GEP (bottom) by gene loading values from respective cNMF runs. Genes common to both are highlighted in orange. f. Heatmap depicting regression coefficients for the single-ligand validation data using the single-ligand screen cNMF GEPs as response variables. g. Heatmap depicting regression coefficients for the single-ligand validation data using the CS cNMF GEPs as response variables instead of the single-ligand experiment cNMF GEPs.
Extended Data Fig. 5
Extended Data Fig. 5. PDAC organoid specific IL-4/IL-13 response module is context specific and unique from other IL-4/IL-13 signatures.
a. Left: Heatmap showing the Pearson correlation of the expression of the Moffitt classical and basal transcriptional signatures with the expression of each CS cNMF module over bulk PDAC RNA-seq data from TCGA. Right: Heatmap of the Pearson correlation of the Moffitt classical and basal transcriptional signatures with the expression of each CS cNMF module over malignant PDAC single cells from Raghavan et al. b. Scatterplots showing the correlation between the Moffitt classical score and our PDAC IL-4/IL-13 IL-4/IL-13 response GEP (top) or three IL-4/IL-13 transcriptional signatures from MsigDB as computed over bulk RNA-seq data from PDAC tumors available in TCGA. c. Scatterplots showing the correlation between the Moffitt classical score and our PDAC IL-4/IL-13 response GEP (top) or three IL-4/IL-13 transcriptional signatures from MsigDB as computed across malignant PDAC cells from Raghavan et al. d. Scatterplots showing the correlation between the Moffitt basal score and our PDAC IL-4/IL-13 response GEP (top) or three IL-4/IL-13 transcriptional signatures from MsigDB as computed over bulk RNA-seq data from PDAC tumors available in TCGA. e. Scatterplots showing the correlation between the Moffitt basal score and our PDAC IL-4/IL-13 response GEP (top) or three IL-4/IL-13 transcriptional signatures from MsigDB as computed across malignant PDAC cells from Raghavan et al. f. Venn diagrams for the overlap between single-ligand validation experiment cNMF GEP module genes and genes from existing signatures in the literature. g. Kaplan–Meier survival plots of a pancreatic cancer patient cohort (TCGA PAAD, n = 182, bulk RNA-seq expression data) based on single-ligand IFNγ GEP and TGF-β GEP (left column) compared with their literature counterparts (right column). h. Integrated low-dimensional embedding (UMAP) of the scRNA-seq data from the IL-4 single-ligand perturbation experiment. Color scale indicates the density of the ligand treatment. i. Top 25 differentially expressed genes between IL-4 and DMSO-only treated groups (two-sided Wilcoxon test, BH adjusted p-value < 0.01). j. Overrepresentation Analysis (ORA) of all significant (two-sided Wilcoxon test, BH adjusted p-value < 0.05) differentially expressed genes in IL-4 vs control cells using MsigDB Hallmark dataset. For the ORA, one-sided Fisher’s exact test is computed and FDR correction is applied to the p-value.
Extended Data Fig. 6
Extended Data Fig. 6. Modulation effect of 90 MOA compounds on LPS or IFNβ response across PBMC cell types.
a. Potentiation or interference strength of 90 compounds on cell type specific GEPs, including non-stimulant response GEPs, derived from cNMF runs using data from LPS+control screens (top) or IFNβ+control screens (bottom).
Extended Data Fig. 7
Extended Data Fig. 7. Evaluation of the effects of MOA compounds on IFNβ responses in PBMCs.
a. Line plots of the number of detected positive/negative IFNβ response potentiators and interferers per cell type as a function of the p-value cut-off used in one-sided permutation tests for the significance of regression coefficients. b. Top: Ponatinib induces multiple different effects on IFNβ response modules across cell types. Bottom: Evaluation of genes comprising IFNβ JAK-STAT related response GEPs. ‘IFNβ JAK-STAT common genes’ are the intersection of selected top genes from B cell GEP3, CD4 T cell GEP3, and CD8 T cell GEP1. ‘B cell GEP3 unique genes’ are the genes unique to the selected top genes from B cell GEP3. All scores are calculated using scanpy ‘score_genes’ function and normalized to median of DMSO + IFNβ group. Two-sided Mann-Whitney U test was performed to test score differences (Methods). All the box plots indicate 25th percentile at the bottom, median in the middle and 75th percentile at the top. Whiskers are drawn to the farthest datapoints within 1.5* interquartile range from the nearest hinge. Sample sizes in each stimulation condition: DMSO n = 198 (B cell), n = 1,730 (CD4) n = 201 (CD8); DMSO + IFNβ n = 174 (B cell), n = 1,276 (CD4), n = 87 (CD8); Ponatinib+IFNβ n = 119 (B cell), n = 1,145 (CD4), n = 66 (CD8). c. Annotation of B cell cNMF GEP modules from IFNβ + control condition. d. Annotation of CD4 T cell cNMF GEP modules from IFNβ + control condition seen in Fig. 4f. GEP3 highly correlates with JAK-STAT pathway signature. e. Annotation of CD8 T cell cNMF GEP modules from IFNβ + control condition.
Extended Data Fig. 8
Extended Data Fig. 8. Evaluation of the effects of MOA compounds on IFNβ responses in PBMCs (continued).
a. Bar plot of compounds with the strongest effects on IFNβ response in each cell type. b. Annotation of monocyte cNMF GEP modules from IFNβ + control condition.
Extended Data Fig. 9
Extended Data Fig. 9. Evaluation of the effects of MOA compounds on LPS responses in PBMCs.
a. Line plots of the number of detected positive/negative LPS response potentiators and interferers per cell type as a function of the p-value cut-off used in permutation tests for the significance of regression coefficients. b. Merimepodib exerts multiple different effects on LPS response modules across cell types. Two-sided Mann-Whitney U test without multiple hypothesis correction was performed to test score differences (Methods). All the box plots indicate 25th percentile at the bottom, median in the middle and 75th percentile at the top. Whiskers are drawn to the farthest datapoints within 1.5* interquartile range from the nearest hinge. Sample sizes in each stimulation condition: DMSO n = 198 (B), n = 1730 (CD4), n = 201 (CD8), n = 396 (monocyte); DMSO + LPS n = 507 (B), n = 3,259 (CD4), n = 61(CD8), n = 1,395 (monocyte); Merimepodib+LPS n = 233 (B), n = 2,865 (CD4), n = 375 (CD8), n = 165 (monocyte). c. Annotation of monocyte cNMF GEP modules from LPS+control condition. d. Annotation of B cell GEPs from LPS+control condition. GEP3 highly correlates with amine biosynthesis/metabolic processes and TNF pathway signatures. e. Annotation of CD8 T cell GEPs from LPS+control condition. GEP3 highly correlates with JAK-STAT pathway signature. f. Annotation of CD4 T cell cNMF GEP modules from LPS+control condition.
Extended Data Fig. 10
Extended Data Fig. 10. Evaluation of the effects of MOA compounds on LPS responses in PBMCs (continued).
a. Annotation of NK cell cNMF GEP modules from LPS+control condition. b. Bar plot of compounds with the strongest effects on LPS response in each cell type. c. Divergent effects on LPS GEP7 in monocytes by two pyruvate dehydrogenase kinase inhibitors where BX-912 is a positive potentiator and AZD7545 is a positive interferer. Two-sided Mann-Whitney U test without correction was performed to test score differences (Methods). All the box plots indicate 25th percentile at the bottom, median in the middle and 75th percentile at the top. Whiskers are drawn to the farthest datapoints within 1.5* interquartile range from the nearest hinge. d. ML298 Hydrochloride as a representative compound with pleiotropic effects across cell types in both IFNβ (right) and LPS (left) stimulation conditions. Module scores were normalized against median in DMSO+stimulation condition in each comparison. Two-sided Mann-Whitney U test without multiple hypothesis correction was performed to test score differences (Methods). All the box plots indicate 25th percentile at the bottom, median in the middle and 75th percentile at the top. Whiskers are drawn to the farthest datapoints within 1.5* interquartile range from the nearest hinge. e. Ruxolitinib as a positive interferer of LPS-GEP3 in CD8 T cells. Two-sided Mann-Whitney U test without correction was performed to test score differences (Methods). All the box plots indicate 25th percentile at the bottom, median in the middle and 75th percentile at the top. Whiskers are drawn to the farthest datapoints within 1.5* interquartile range from the nearest hinge. f. Evaluation of CS LPS response module (B cell GEP3) in Ruxolitinib-only perturbation. Two-sided Mann-Whitney U test without correction was performed to test score differences (Methods). All the box plots indicate 25th percentile at the bottom, median in the middle and 75th percentile at the top. Whiskers are drawn to the farthest datapoints within 1.5* interquartile range from the nearest hinge. Despite a statistically insignificant difference in monocytes between DMSO-only and DMSO + LPS treated groups, the large shift between the module scores warrants the inclusion of Ruxolitinib’s effect as an example of a positive potentiator in this cell type.

References

    1. Joyce, A. R. & Palsson, B. Ø. The model organism as a system: integrating ‘omics’ data sets. Nat. Rev. Mol. Cell Biol.7, 198–210 (2006). - PubMed
    1. Eder, J., Sedrani, R. & Wiesmann, C. The discovery of first-in-class drugs: origins and evolution. Nat. Rev. Drug Discov.13, 577–587 (2014). - PubMed
    1. Swinney, D. C. & Anthony, J. How were new medicines discovered? Nat. Rev. Drug Discov.10, 507–519 (2011). - PubMed
    1. Moffat, J. G., Vincent, F., Lee, J. A., Eder, J. & Prunotto, M. Opportunities and challenges in phenotypic drug discovery: an industry perspective. Nat. Rev. Drug Discov.16, 531–543 (2017). - PubMed
    1. Swinney, D. C. Phenotypic vs. target-based drug discovery for first-in-class medicines. Clin. Pharmacol. Ther.93, 299–301 (2013). - PubMed

MeSH terms

Substances

LinkOut - more resources