. 2025 Jul;43(7):1101-1115.
doi: 10.1038/s41587-024-02386-x. Epub 2024 Oct 7.

Mapping multimodal phenotypes to perturbations in cells and tissue with CRISPRmap

Affiliations

Mapping multimodal phenotypes to perturbations in cells and tissue with CRISPRmap

Jiacheng Gu et al. Nat Biotechnol. 2025 Jul.

Erratum in

  • Author Correction: Mapping multimodal phenotypes to perturbations in cells and tissue with CRISPRmap.
    Gu J, Iyer A, Wesley B, Taglialatela A, Leuzzi G, Hangai S, Decker A, Gu R, Klickstein N, Shuai Y, Jankovic K, Parker-Burns L, Jin Y, Zhang JY, Hong J, Niu X, Costa JA, Pezet MG, Chou J, Chen C', Paiva M, Snoeck HW, Landau DA, Azizi E, Chan EM, Ciccia A, Gaublomme JT. Gu J, et al. Nat Biotechnol. 2025 Jul;43(7):1203. doi: 10.1038/s41587-025-02594-z. Nat Biotechnol. 2025. PMID: 40044831 Free PMC article. No abstract available.

Abstract

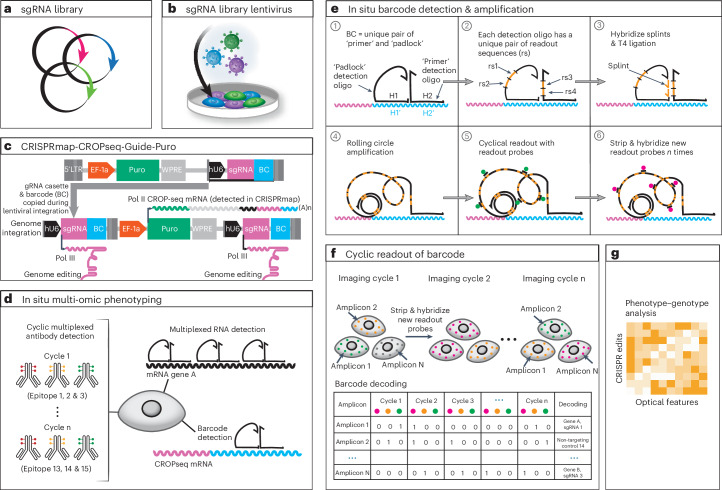
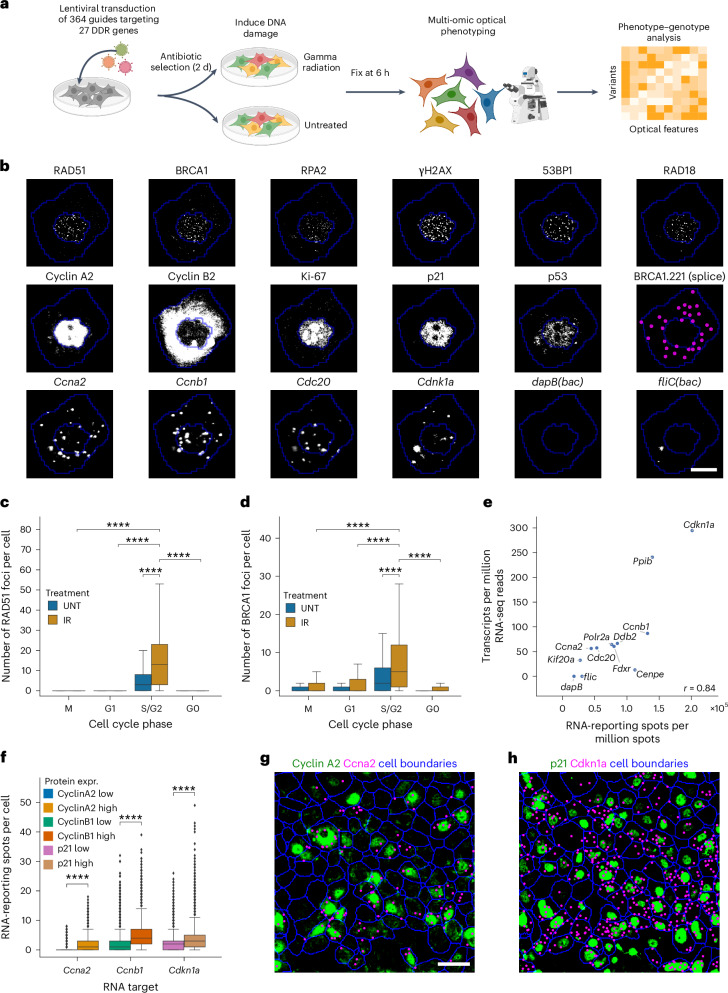
Unlike sequencing-based methods, which require cell lysis, optical pooled genetic screens enable investigation of spatial phenotypes, including cell morphology, protein subcellular localization, cell-cell interactions and tissue organization, in response to targeted CRISPR perturbations. Here we report a multimodal optical pooled CRISPR screening method, which we call CRISPRmap. CRISPRmap combines in situ CRISPR guide-identifying barcode readout with multiplexed immunofluorescence and RNA detection. Barcodes are detected and read out through combinatorial hybridization of DNA oligos, enhancing barcode detection efficiency. CRISPRmap enables in situ barcode readout in cell types and contexts that were elusive to conventional optical pooled screening, including cultured primary cells, embryonic stem cells, induced pluripotent stem cells, derived neurons and in vivo cells in a tissue context. We conducted a screen in a breast cancer cell line of the effects of DNA damage repair gene variants on cellular responses to commonly used cancer therapies, and we show that optical phenotyping pinpoints likely pathogenic patient-derived mutations that were previously classified as variants of unknown clinical significance.


Conflict of interest statement

Competing interests: Columbia University has filed a patent application related to this work, for which J.T.G. is an inventor. E.M.C.ʼs laboratory receives support from Novartis. D.A.L. has served as a consultant for AbbVie, AstraZeneca and Illumina and is on the scientific advisory boards of Mission Bio, Pangea, Alethiomics and C2i Genomics. D.A.L. has also received prior research funding from Bristol Myers Squibb, 10x Genomics, Ultima Genomics and Illumina, all unrelated to the current study. The remaining authors declare no competing interests. Ethics: All human iPSCs and embyonic stem cells (ESCs) used in this study were previously generated and reported to be derived from material obtained under informed consent and appropriate ethical approvals. The human ESC (RUES2) is approved by the National Institutes of Health (NIH) Intramural Embryonic Stem Cell Research Oversight Committee. Animal care and experimental procedures were performed in accordance with the NIH Guide for the Care and Use of Laboratory Animals and were approved by the Columbia University Institutional Animal Care and Use Committee (protocol AC-AABT8654).

Figures

Fig. 1
Fig. 1. CRISPRmap assay design overview.
a, Synthesized sgRNA and barcode library are cloned onto the modified CROPseq vector for sgRNA and barcode expression. b, Plasmids are lentivirally transduced into target cells. c, Design of the CRISPmap-CROPseq-Guide-Puro vector. Human U6 (hU6) promoter (black) drives the sgRNA expression by RNA Pol III, and a Pol III stop signal is inserted between the sgRNA and the barcode. The hU6-sgRNA-stop cassette and the barcode are inserted in the 3′ LTR sequence and will, thus, be copied during genome integration to the upstream of the EF-1a promoter. The EF-1a promoter drives the expression of the CROPseq mRNA by RNA Pol II, which expresses the puromycin resistance gene (green), hU6 (black), sgRNA (magenta) and barcode (cyan). This figure was adapted from Datlinger et al.. d, In situ multimodal phenotyping and CRISPRmap barcode detection. Multimodal phenotyping interrogates proteomic and transcriptomic states, and CRISPRmap barcode readout identifies the sgRNA identity. Cyclic antibody staining (IBEX) is used to detect dozens of epitopes. Pairs of padlock and primer oligos are hybridized to the CROPseq mRNA or endogenous RNAs to detect CRISPRmap barcodes or target RNA transcripts. e, In situ barcode detection and amplification. Padlock and primer oligos hybridize to the barcode sequence on the CROPseq mRNA. Padlock and primer each encode a unique pair of readout sequences. Splints hybridize to the corresponding readout sequences on primer oligos. Padlock oligos and splints are joined by T4 ligation to enable RCA. Fluorophore-conjugated readout probes hybridize to readout sequences on the amplicons in a cyclic manner for barcode identification. f, Barcode readout and decoding. Images across fluorescence channels and imaging cycles are co-registered into a unified readout stack. Barcode decoding at the amplicon level is achieved through spot detection, assigning a bit code (0 for absence, 1 for presence) in each image to generate a barcode across images. If the barcode aligns with a guide-identifying barcode in the codebook, a guide identity is assigned to the corresponding amplicon. g, Phenotype–genotype analysis. Multimodal and multiplexed phenotyping provides high-dimensional optical features for systematic analysis. BC, barcode; LTR, long terminal repeat; Pol, polymerase.
Fig. 2
Fig. 2. CRISPRmap high-fidelity genotype–phenotype mapping.
a, Visualization of genotype–phenotype mapping in cells without (left) or with (middle and right) GFP-pilot library. WGA (magenta) and DAPI (blue) signals are shown (left and middle). Cell boundaries are outlined in blue, whereas decoded barcodes are shown as false-colored spots (magenta for GFP-targeting guides, green for non-targeting guides) (right). Raw GFP signal is displayed by grayscale in all panels. Scale bar, 50 μm. b, Visualization of the barcode readout and phenotyping, showing a cell with a GFP-targeting guide (top row) and a cell with a non-targeting guide (bottom row). Decoded barcodes are displayed as white spots (second-most right column) and projected onto the eight readout images as white circles with raw readout signals displayed in magenta for channel 1 and in green for channel 2 (columns 1–8). Raw GFP signal is shown in grayscale (right-most column). Cell and nuclear boundaries are outlined in blue in all panels. Scale bar, 10 μm (top) and 15 μm (bottom). c, Quantification of all possible primer–padlock combinations, showing robust detection of the 10 allowed combinations and minimal detection of the 15 unallowed combinations. d, Distribution of the number of assigned amplicons per cell under the standard QC (Methods). e, Quantification of genotype–phenotype mapping showing that cells with GFP-targeting guides have significantly reduced GFP fluorescence (P = 1.53 × 10−209). Two-sided Mann–Whitney test, *P < 0.05, **P < 0.01, ***P < 0.001, ****P < 0.0001. n = 1 with 4,620 transduced cells, n = 1 with 4,810 non-transduced cells. Boxes indicate the median and interquartile range (IQR) with whiskers extending 1.5× IQR past the upper and lower quartiles. f, Barcode detection between conventional OPS and CRISPRmap for HT1080 cells, fibroblasts, iPSCs, iMNs and hESCs. Scale bar, 10 μm. g, Fraction of cells with barcode detection in CRISPRmap on fibroblasts (n = 2 biological replicates), HT1080 cells (n = 5 from four biological replicates), iPSCs (n = 5 from two biological replicates), iMNs and hESCs and conventional OPS on fibroblasts (n = 3 from two biological replicates), HT1080 cells, iPSCs, iMNs and hESCs. n = 2 technical replicates unless otherwise specified. Data are presented as mean values ± 95% confidence interval (CI). BC, barcode.
Fig. 3
Fig. 3. CRISPRmap base editing screening enables multimodal phenotyping of cell states.
a, Experimental workflow (Methods). Image was made using BioRender. b, Subcellular distribution of six DDR protein stains (top row), five cell cycle regulator stains (middle row), barcode detection (middle row, most right) and transcript detection for six genes (bottom row) for a single cell. Cell and nuclear segmentation are outlined in blue, raw antibody signal and transcript detection in grayscale. Decoded barcodes are shown as false-colored (magenta) spots. Only data under the cell segmentation mask are displayed. Scale bar, 10 μm. c, Quantification of the number of RAD51 foci per cell across cell cycle phases in UNT (n = 1 with 120,253 cells) and IR (n = 1 with 106,116 cells) cells, showing significant foci induction by irradiation and enrichment in the S/G2 phase. Boxes indicate the median and interquartile range (IQR) with whiskers extending 1.5× IQR past the upper and lower quartiles (outliers are omitted). Two-sided Mann–Whitney test, *P < 0.05, **P < 0.01, ***P < 0.001, ****P < 0.0001. The P values of (G2/S_UNT, G0_IR, G1_IR and M_IR) versus G2/S_IR are 0.00e + 00, 0.00e + 00, 0.00e + 00 and 2.74 × 10−37, respectively. d, As in c for BRCA1 foci. The P values are 0.00e + 00, 0.00e + 00, 0.00e + 00 and 3.78 × 10−15. e, Correlation between RNA-reporting spots per million spots measured by RNAmap and TPM reads from RNA sequencing. Pearson correlation (r) equals 0.84. f, RNA–protein correlation measured by RNAmap and antibody staining for three RNA–protein pairs (Ccna2-cyclin A2, Ccnb1-cyclin B1 and Cdkn1a-p21), showing significantly enriched RNA-reporting spots in cells with high protein expression. Boxes indicate the median and IQR with whiskers extending 1.5× IQR past the upper and lower quartiles. Two-sided Mann–Whitney test, *P < 0.05, **P < 0.01, ***P < 0.001, ****P < 0.0001. The P values (from left to right) are 0.00e + 00, 0.00e + 00 and 0.00e + 00. g, Visualization of the decoded Ccna2-reporting spots (magenta) and cyclin A2 staining (green). Scale bar, 50 μm. h, As in g for Cdkn1a (magenta) and p21 (green). IR, irradiated; UNT, untreated.
Fig. 4
Fig. 4. Performance of CRISPRmap base editing screening on gamma-irradiated MCF7 cells.
a, Correlation between L2FC in RAD51 foci number and the RS2 on-target score. All guides targeting RAD51 regulators, including RAD51 paralogs (RAD51D, RAD51C, XRCC3), BRCA1 and BRCA2, are shown. Splice and nonsense variants with high RS2 score show more significant L2FC. Pearson correlation (r) = −0.30. b, Quantification of RAD51 foci in irradiated S/G2-phase cells with guides targeting RAD51 regulators that have low RS2 score, grouped by sgRNA category. No or moderate significant separation from cells with control guides was observed. Two-sided Kolmogorov–Smirnov test, *Padj < 0.05, **Padj < 0.01, ***Padj < 0.001, ****Padj < 0.0001. The P values (from top to bottom) are 4.19 × 10−1, 8.03 × 10−3 and 9.79 × 10−1. c, As in b for guides with high RS2 score, showing significant reduction in RAD51 foci in cells with nonsense and splice guides. The P values (from top to bottom) are 9.07 × 10−2, 1.11 × 10−15 and 9.82 × 10−17. d, As in a for L2FC in BRCA1 foci for BRCA1-targeting guides. Pearson correlation (r) = −0.75. e, Same as b for BRCA1 foci and guides targeting BRCA1 that have low RS2 score. The P values (from top to bottom) are 3.52 × 10−1 and 4.99 × 10−1. f, Same as e for guides with high RS2 score, showing significant reduction in BRCA1 foci in all categories. The P values (from top to bottom) are 4.88 × 10−3, 1.30 × 10−10 and 6.86 × 10−6. g, Volcano plot showing no AAVS1-targeting or NTC guides shows statistically significant changes in RAD51 foci. Guides targeting DDR genes with RS2 score ≥ 0.55 and all AAVS1-targeting and NTC guides are shown. Two-sided Kolmogorov–Smirnov test. h, Same as g highlighting guides that result in significant changes in RAD51 foci. i, Gene enrichment analysis of guides causing significant changes in RAD51 foci. One-sided (greater) Fisherʼs exact test. Significance, Padj < 0.05. j, Same as g for BRCA1 foci. k, Same as h for guides that result in significant changes in BRCA1 foci (l) same as i for guides causing significant changes in BRCA1 foci. NS, not significant.
Fig. 5
Fig. 5. Variant analysis on functionally relevant genes identified variant clusters with treatment-specific optical signatures.
a, Crucial effectors in DNA damage repair. RAD51 paralogs, including RAD51D, RAD51C and XRCC3, are required for the formation of RAD51 foci at DNA double-strand breaks (DSBs). The BRCA1–BARD1 complex recruits RAD51 to DSB sites. FANCG and FANCI are involved in DNA inter-strand crosslinking (ICL) repair. b, Clustering of guides targeting RAD51 paralog genes (RAD51C, RAD51D and XRCC3), showing a cluster with reduced RAD51 foci in all four DNA-damaging agents–treated and irradiated cells and increased large γH2AX foci in OLAP-treated and CISP-treated cells. The mutations of this cluster are mostly splice and nonsense variants. The left-most column cluster features milder phenotypes mainly associated with missense VUSs. L2FCs in each optical phenotype in corresponding treatment conditions are shown as rows in the heatmap. Cells in all cell cycle phases are included; untreated cells are not included. All guides with RS2 on-target score ≥ 0.5 were included in the clustering and are shown in the heatmap. Columns were cut at a depth of 2, and rows were cut at a depth of 3 based on the dendrogram. Color scale is −1 to 1. c, Same as b for guides targeting BRCA1 and BARD1, showing a cluster with reduced RAD51 and BRCA1 foci in irradiated cells and increased large γH2AX foci and micronuclei in OLAP-treated and CISP-treated cells composed mainly of pathogenic splice and nonsense variants and another cluster with mild phenotypes composed mainly of missense variants. d, Same as b for guides targeting FANCI and FANCG, showing a cluster with mostly splicing variants showing increased large γH2AX foci and micronuclei in OLAP-treated and CISP-treated cells. The left-most column cluster features milder phenotypes mainly associated with missense variants.
Fig. 6
Fig. 6. Subcellular resolution CRISPRmap barcode readout and multiplexed phenotyping in vivo.
a, Experimental workflow. Cas9 OE19 cells were transduced with the 364-guide DDR library and selected with puromycin for 2 d, before inoculation in the flanks of nude mice. Tumors were harvested after 17 d of growth and processed for CRISPRmap and immunofluorescence imaging. Image was made using BioRender. b, Quantification of proportion of cells segmented on the E-cadherin stain passing the barcode QC criteria (blue; Methods) and proportion of E-cadherin segmented cells that is part of a clonal region (orange; Methods). Data are presented as mean values ± 95% confidence interval (CI). n = 3 technical replicates. c, Visualization of in vivo barcode detection, showing the guide distribution landscape in a tumor section. Decoded barcodes are shown as spots, false colored according to their guide identity. The region highlighted by a white dashed square is zoomed in on eh. Scale bar, 200 μm. d, Clonality analysis of barcoded cells in a cell-centric manner based on 10-nearest neighbor graphs (Methods). Scale bar, 50 μm. e, Cell (green) and nuclear (blue) boundaries detected by segmentation of E-cadherin and DAPI, respectively. Subcellular resolution of barcode readout. Decoded barcodes are shown as spots, false colored according to their guide identity. f, Iterative immunofluorescence distinguishes cell types and cellular states in vivo. Protein stains of tenascin C (magenta), mouse CD31 (green) and DAPI (blue) are shown. Antibodies are predicted to recognize epitopes from both human and mouse origins unless otherwise specified. g, As in f for vimentin (magenta) and human p21 (green). h, As in f for N-cadherin (magenta) and E-cadherin (green).

References

    1. Datlinger, P. et al. Pooled CRISPR screening with single-cell transcriptome readout. Nat. Methods14, 297–301 (2017). - PMC - PubMed
    1. Dixit, A. et al. Perturb-seq: dissecting molecular circuits with scalable single-cell RNA profiling of pooled genetic screens. Cell167, 1853–1866 (2016). - PMC - PubMed
    1. Feldman, D. et al. Pooled genetic perturbation screens with image-based phenotypes. Nat. Protoc.17, 476–512 (2022). - PMC - PubMed
    1. Feldman, D. et al. Optical pooled screens in human cells. Cell179, 787–799 (2019). - PMC - PubMed
    1. Funk, L. et al. The phenotypic landscape of essential human genes. Cell185, 4634–4653 (2022). - PMC - PubMed

LinkOut - more resources